On Energy-Based Profiling of Malware in Android Alessio Merlo
Mauro Migliardi
Paolo Fontanelli
DIBRIS - University of Genova, 16145, Genova (Italy) and E-Campus University 22060, Novedrate (Italy) alessio.merlo@{unige.it, uniecampus.it}
DEI - University of Padova, 35131, Padova (Italy)
[email protected]
DIBRIS - University of Genova, 16145, Genova (Italy)
[email protected]
Abstract—The growing spread of malware on Android OS requires new approaches for the detection and recognition of malicious applications on mobile devices. An emerging idea is characterizing malicious behaviors in terms of energy consumption, to support the definition of Energy-aware Intrusion Detection Systems that are able to recognize malicious behaviors in terms of their energy footprint. To this aim, the energy consumption of several hardware components of a mobile device must be measured at a sufficiently fine-grained level of precision. Furthermore, the same measurements must not be energyhungry. In Android, several sources can provide energy consumption information, from high-level API to low level measurements taken directly from the battery driver. In this paper, we consider two approaches to measurements available in literature and, by measuring the consumption of a device under attack, we empirically assess their suitability to support the profiling of both benign and malicious applications in Android. Then, we propose a new approach able to overcome the limitations of the existing ones and we provide empirical evidence on the feasibility and the correctness of our proposal. Keywords—Android Security; Malware; Energy-awareness; Measurements;
I. I NTRODUCTION The general computing scenario is getting a more and more significant contribution from tablet PCs and smartphones. The recent generation of mobile devices has overcome many of the limitations that riddled older palmtop devices and has reached a level of performance and usability that makes them a feasible substitute of traditional desktop and laptop PCs. In daily life, the dependency of users from their mobile computing devices is growing steadily and is rapidly reaching the point in which the unavailability of those devices will jeopardize the capability to efficiently perform in business as well as in other daily tasks. This phenomenon has been clearly demonstrated during the October 2011 Blackberry’s blackout [1]. Furthermore, mobile devices have recently penetrated the world of public bodies and governmental agencies. A first significant example of this phenomenon can be seen in hospitals and medical centers, where institutions such as the MetroSouth Medical Center in Blue Island [2] have provided tablet PCs (Apple iPad) to doctors to ease the task of ordering tests and procedures. Another example is the security certification of Android smartphones by the US Department of Defense
978-1-4799-5313-4/14/$31.00 ©2014 IEEE
[3] that allowed the deployment of Dell hardware with Froyo (Android OS v2.2) in the Pentagon. Additionally, there are several recent research projects that focus on providing healthrelated services through mobile devices. The actual goals of these projects range widely from simple access to medical records [4] to the measurement of the user level of wellness [5]. In this context, the Android OS is one of the major actors as it runs on more than 80% of the devices in the marketa . All of these require a radically new perception of how the security problem has to be tackled in mobile devices and an approach that differs deeply from previous works. As a matter of fact, while there are general and comprehensive taxonomies of mobile malware [6], the current view of security on mobile devices is tightly bound and generally limited to privacy and the problem of keeping personal data already stored on the device safe from theft and/or malicious exploitation. On the contrary, we claim that the newly acquired importance of mobile devices in the daily efficiency chain requires looking at security from a more holistic point of view where privacy is only a facet and the problem of availability has to be taken into serious account. When approaching mobile security from the availability side, it is important to notice that the very nature of mobile devices, i.e. their strict dependence from a limited power source, makes them vulnerable to energy related attacks [7] and turns energy into a vital resource that needs to be monitored and accounted for also in the security perspective [8]. In this view, an emerging idea is the concept of energy footprints, aimed at classifying (to some extent) activities (and in particular, malware) on a mobile device in term of their energy consumption. This approach has been recently pioneered in [9] and [10] with different approaches to the problem of getting reliable power consumption measurements. Realistic and energy-saving measurements are of paramount importance to build effective energy footprints that can be used to detect anomalous activities in terms of the energy costs they cause on the device. In this paper we study how energy consumption may be measured in a mobile OS, namely the Android OS, and we a http://www.dailytech.com/Gartner+Numbers+Show+Android+Holds+82+ of+Worldwide+Smartphone+Market/article33748.htm, accessed on January the 14th 2014
535
identify two different measurement approaches described in the literature. The first approach is based on the high level APIs dedicated to measuring power consumption, and has been adopted by several well-known apps such as PowerTutor [11]. A second approach deals with the lower layer of the Android OS (i.e. the Linux Kernel) and requires modifying the battery drivers to retrieve high resolution energy consumption data (e.g. [12], [9]). In this paper, we study the level of accuracy and the limitations these two approaches and we discuss to which extent they are up to the task of recognizing misplaced energy in the system. Our analysis indicate that the first one is too coarse grained while the second one is rather precise but very invasive and appears to be very power-consuming. Then, we present the measurements we performed adopting the above mentioned approaches during an attack to the device and we show that the empirical evidence confirm our analysis. As only the second one is capable of providing data with a resolution sufficient to discover ongoing malicious activities, we propose to adopt a third approach that is more precise than the first one but less invasive and more energy-saving than the second one. We empirically prove the effectiveness of our approach by means of experimentation. The paper is structured as follows: in Section II we discuss some related works; in Section III we analyze two different measurement methodologies available in literature and we discuss their strengths and limitations; in Section IV we present our experiments and we show that the empirical data confirm our analysis; in Section V we discuss our approach and we show that it provides measurements apt to identify the ongoing attack. Finally, in Section VI we provide some concluding remarks and we propose some future directions for our studies. II. R ELATED W ORK The topic of our work is the detection of security threats and attacks on Android on the basis of their energy consumption. More in details, in this paper we analyze different methodologies to measure energy consumption and we evaluate how fit they are to the task of leveraging the models proposed in [9] and building an effective database for the energy footprints of both legitimate and malicious activities on Android devices. In the last years, several OS-specific solutions have been devised to tackle the problem of malware detection on mobile devices. As an example, in [13] the authors propose a specific malware detection tool based on code-signature recognition, however, no discussion on energy-related recognition of attacks is provided. The authors in [14] and [15] propose solutions that are dedicated to the Symbian and/or Windows Mobile OS and in [15] a brief discussion of energy-related malware is provided. The work in [11] and [9] model the energy consumption of a mobile device and show that it is possible to effectively profile the energy consumption of activities as long as the measurements are capable of distinguishing among hardware
components (e.g. GPS, Wi-Fi, 3G, CPU, . . . ) and they are performed with a sufficient level of precision. In the literature it is possible to identify several solutions to the problem of modeling and measuring the energy consumption of Android-based devices. However, an official classification of these different approaches does not exist. In this paper we will adopt a classification of current solutions in terms of i) adopted measurement tools, ii) invasiveness of measurements in the Android stack and iii) use of collected data. Regarding the first category, measurements can be collected using internal hardware (i.e. relying on the device instrumentation) or external (based on ad-hoc hardware connected to the device). Internal measurements are generally less precise than external ones. However, the necessity of external hardware severely reduces the usability of the device. The information provided by the different layers in the Android stack are available both to internal and external measurements. In fact, information on energy consumption can be obtained by invoking proper APIs (high level measurements) or directly by querying (and in case customizing) the battery driver and the Linux Kernel (low level measurements). High level measurements are usually more coarse-grained and less precise than low level ones; however they do not require introducing modifications in the Android stack. Finally, collected data can be processed online, i.e. directly on the device, or delivered to an external server for offline analysis. Online analysis is performed by specific applications (e.g. an energy-saving app) and does not generally overtake the boundary of the single device. External servers often perform offline analysis by collecting data from several devices. It is important to notice, however, that offline measurements are not functional as security support, since the collection of data may be denied by the attack itself. In [10], [11], [16], [17] the authors propose some internal measurements approaches. In detail, [11] describes PowerTutor, an Android application performing an online estimation of the actual power consumption of the device deriving the global estimation from a model of the different hardware components. PowerTutor uses high-level measurements and the resulting measurements are very coarse-grained as we discuss in the following. Sesame [16] is a solution that allows mobile devices to perform automatic self-modeling of their consumption profile. This task is performed by collecting data at low level (i.e. directly from the battery driver) and by means of online analysis. The AppScope tool described in [12] provides accurate low-level energy consumption measurements. Unfortunately, this tool is tailored to a single model of mobile device (the Google Nexus One) and it is not open-source. This prevents the replication of the experiments on other models and thus the evaluation of the correctness of the measurements. Besides being closed source, AppScope adopts a mechanism for consumption analysis measurement that, because of its usage of static references, it is strictly tied to a single device model. This makes quite difficult to port the tool to other models. The previous solutions have been designed as green computing
536
tools, thus they are aimed at evaluating the global energy consumption of mobile devices to allow reducing it. None of them has been designed with security purposes in mind as we do in this paper. In fact, we tackle the problem of identifying malicious behaviors in Android in terms of their energetic footprint, so that the presence of a malicious behavior in an Android device may be spotted by means of the energy consumption it produces inside the mobile phone. A database of the energetic footprints of malicious applications, as proposed in [9], would allow designing and implementing a new generation of Intrusion Detection Systems capable of recognizing malware by taking into account both their code-signature as well as their energetic footprint. To the best of our knowledge, there exists a single work dealing with the recognition of attacks in terms of energetic footprints [18]. In this work, the authors describe how to detect three different kinds of attacks, however they rely exclusively on ad-hoc external hardware, thus their approach has a very limited usability in mobile devices that are actually deployed on the field. Thus, we argue that it is necessary to rely on internal, online measurements at a sufficiently fine-grained level, in order to support effective energy-based profiling and detection of malicious behavior, as proposed in [9]. However, the profiling method proposed in [9] is based on based on low level measurements. This reveals to be sufficient for detecting malicious behaviors, but such approach is very invasive and requires customization of the specific battery driver. To overcome such limitations, in the following we apply energetic measurement at different level of abstraction in order to find out a possible trade-off between measurements precision and effective energetic profiling of malicious applications in Android, without neglecting the energy cost of measurements themselves. III. M EASURING E NERGY C ONSUMPTION IN A NDROID In this section we will analyze the effectiveness and intrusiveness of two different measuring methodologies for the energy consumption on Android devices: the first one is devised for general purpose, while the other is designed specifically to recognize security threats. Then, we will evaluate how fit they are to the task of discriminating the presence or absence of an example attack (namely a ping-flood attack) during the execution of a legal application (i.e. Skype). High Level measurements (HL): the first methodology is a high-level one based on hardware resource usage counters adopted by general purpose applications such as PowerTutor and described in [11]. This approach measures values as close as possible to the energy sinks (i.e. the hardware components that use energy) to achieve the capability to distinguish among the different parts of the devices that use the energy. To take our analysis to a further level of detail we will adopt PowerTutor as our case study for this approach. PowerTutor reads hardware components activity states from the /sys device file system and uses these values to modulate the sum of estimated levels of consumption for each different
hardware component state. The measurement performed by the profiler service are recorded and stored on the device and an application may chart them in different graphical displays. However, the profiler also sends all the recorded data to the PowerTutor research group to allow aggregated profiling of devices (i.e. offline analysis). PowerTutor claims to be able to evaluate the power consumption of different hardware components of a device. In our study, we take into account screen, audio, CPU, Wi-Fi, GPS and 3G network. The energy model of hardware components adopted by PowerTutor is rather simple. Regarding the device screen, an estimated level of consumption is multiplied for the brightness level of the screen and summed to a base consumption; in the case of the audio device, the consumption is an on-off value. The power model of the CPU simply assumes that there is a linear relation between the level of CPU utilization and the current clock frequency, and only the most expensive power state (C0) is taken into account. The last assumption, however, is absolutely realistic since the presence of the profiling demon prevents the CPU from getting into power saving state. The model for the Wi-Fi network takes into account the uplink channel rate, the uplink data rate and the number of packets transmitted per second. The combination of these three parameters is used to linearly interpolate between minimum and maximum power estimated consumption. The model for the GPS takes into account three power states, namely off, sleep and on, it associates a constant value for the power consumption to each of these states and it integrates over time such values. Finally, the model for the 3G network takes into account the fact that a data connection exists or not, the type of data connection (UMTS or HSDPA) and three different energy states (namely idle, fach and dch) according to the type of channel the 3G connection is currently using. The transitions between idle and active states are calculated on the basis of the amount of traffic registered by the interface. The main peculiarity of this approach is that it allows distinguishing among the different power sinks in the device; however, the energy modeling is rather simple and the measurements tend to be coarse-grained. Low Level measurements (LL): A completely different approach is described in [9]. In this work measurements take place as close as possible to the energy source (i.e. the battery) to achieve the best possible precision in the measurement of energy consumption. More in details, the authors patched theAB8500 driver in order to extract at will the values of current and voltage currently provided by the battery. Then, they wrote a demon service that forces the sampling of consumption values with a temporal resolution of 250 ms. This approach provides high precision measurements, but has three main drawbacks. First of all, LL measurements provide the global energy consumption only, making it impossible to isolate the energy contributions of single hardware components. Furthermore, the forced high sampling frequency increases the energy consumption of the device. Finally, the
537
application of the proposed methodology requires to modify in depth the Android distribution and the specific driver, resulting very low portability. IV. E XPERIMENTAL E VALUATION We now analyze the effectiveness of the HL and LL measurements approaches described in the previous section in trying to identify an attack interrupting a legitimate application. In our study we will adopt an application and an attack whose combination generates power consumption through: i) Wi-Fi, ii) CPU, iii) screen and iv) audio, while makes no use of either GPS or 3G network. More in details, we will use a Skype call and a ping-flood attack over Wi-Fi, albeit the same configuration can be applied to the 3G network interface of the device. The main reason because we choose the Wi-Fi interface instead of the 3G one, is the fluctuating behavior of 3G technology in terms of energy consumption and resource utilization [19]. Details of the testbed: our testbed includes a Skype call, a ping-flood, i.e. an external DoS attack involving the ICMP protocol, and a combination of both activities. The final aim of our experiments is to assess to which extent the recorded measurements at high and low level are reliable to detect and evaluate the variation of energy consumption in an Android device due to the interchange of two activities (i.e. the Skype call and the ping-flood attack). During experiments we kept mobile devices in a controlled execution environment, by stopping all other applications and reducing as much as possible the activities performed by the Android OS. Note that it is impossible to completely reduce the consumption of the OS to 0; this fact impacts measurements to some extent, as we discuss in the following. The Skype call is a bi-directional audio and video stream between two devices. During the call, variable video and audio traffic is exchanged, thus avoiding some optimization normally performed by Skype during the transmission (i.e. avoiding sending video or audio data if the image is fixed and the audio is void). The ping-flood attack is performed by an external PC connected on the same subnet of the mobile device and it is executed continuously. During the attack, a high number of ICMP packets are sent to the Wi-Fi interface of the device, causing the saturation of the network interface. The combined execution of the Skype call and the ping-flood attack is performed as follows: the ping-flood attack starts after 50 seconds from the beginning of the Skype call. The experiment terminates in 80 seconds. The Skype application tries to optimize the quality of the call on the available bandwidth. When the attack traffic starts to mount, the legitimate Skype packets are substituted by ICMP packets and the application adapts itself to use less bandwidth. The amount of bytes traveling through the Wi-Fi interface changes substantially, thus a reliable measurement of the WiFi consumption should record the corresponding variation in the energy consumption.
A. Experimental Results
Experiments have been executed on two different mobile devices, i.e. a HTC Desire HD, and a Sony Xperia U. We performed HL measurements on the HTC Desire HD by means of PowerTutor ver.5, and LL measurements on the Sony Xperia U by replicating the customization on the AB8500 driver and the experimental setup according to [9]. The use of different devices has been an Hobson’s choice: on one hand, we had to replicate the LL measurement approach proposed in [9], thus we had to deal with a mobile device mounting an AB8500 driver as the Sony Xperia U there discussed. On the other hand, we had to perform HL measurements on a mobile device being fully-compatible with PowerTutor. Unluckily, none of the currently available devices using batteries relying on a AB8500 driver are fullycompatible with PowerTutor. For this reason, we have been compelled to perform experiments on different mobile devices. However, this is not a limiting factor for the purpose of our experiments; in fact we are interested in the capability to build up energy footprints of activities (and their combination) over time, while the absolute value of the measurements themselves, although significant to evaluate the energy impact of the measurement activities, are not significant for the task at hand. Furthermore, it is important to notice that there is no relation between the hardware we used and the precision of the measurements: in fact we observed both precise and imprecise measurements with the HTC Desire, thus we can state that the problem is in the measurements approach and not in the underlying hardware. We tested the three scenarios previously discussed (i.e. Skype call, ping-flood attack, and Skype + ping-flood) on each device. We repeated each experiments 10 times and we measured the energy consumption of audio, screen, Wi-Fi, and CPU. All repetitions have shown the same power consumption shapes that we discuss in the following. HL measurements. We profiled the energy consumption of audio, screen, CPU and Wi-Fi on the HTC Desire HD, using PowerTutor that calculates the energy consumption of single hardware components once per second. The audio component is always on during the use of the Skype application, and the power consumption model in PowerTutor is a simple on-off switch, thus the measured consumption related to the audio hardware during all the Skype call is constant, independently from the actual characteristics of the audio traffic. Furthermore, the ping-flood attack does not impact on the audio consumption in any way. Similar considerations can be devised about the screen component. More specifically, PowerTutor takes into account the level of brightness of the screen for assessing the actual consumption. However, during the Skype call the screen is always on if video is in use, resulting in a fixed consumption of 631 mW. Also in this case, the presence of the ping-flood attack has
538
no effect on the on or off state of the screen b . For previous reasons, HL measurements of audio and screen consumption do not provide any useful information in our testbed and we may disregard it without any loss of generality. Therefore, we focus the discussion of our analysis on Wi-Fi and CPU only. 1200
HL: Skype
PowerI(mW)
1000
800
600
400
200
TimeI(s)
0 0
10
20
30
Figure 1.
1000
40
50
WiFi
CPU
60
70
80
CPUF+FWiFi
HL: energy footprint of the Skype call
HL:CPingCFlood
PowerC(mW)
900
800
700
600
500
400
300
200
100
0 0
10
Figure 2.
1200
20
CPU
30
40
WiFi
50
60
70
CPUC+CWiFi
TimeC(s)
80
HL: energy footprint of the ping-flood attack
Powerm(mW)
1000
800
600
400
200
HL: Skypem+mPingmFlood
0 0
10
20
CPU
Figure 3.
30
40
50
WiFi
60
70
Timem(s)
80
CPUm+mWiFi
HL: energy footprint of the Skype call and the ping-flood attack
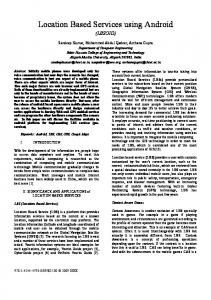
Fig. 1 indicates that most of the consumption of the Skype call is due to the Wi-Fi network interface (719 mW), while the CPU shows variable energy consumption around 200 mW. The total consumption on CPU and Wi-Fi is between 960 b the screen may remain on if the user adopts speakerphone mode and does not actively switches off the screen; however, also in this case the presence of the attack does not impact the screen state.
and 1000 mW during the Skype call. As shown in Fig. 2, the energy consumption due to a ping-flood attack impacts mostly the Wi-Fi and marginally the CPU, leading to an observed global consumption lower than in the case of the Skype call (i.e. between 719 and 860 mW). Interestingly, PowerTutor measures a Wi-Fi consumption of 912 mW both during the Skype call and the ping-flood attack, although the number of packets exchanged per second is rather different. In detail, according to the log of PowerTutor, during the Skype call an average number of 94 packets per seconds is exchanged, while during the ping-flood attack (that basically saturates the Wi-Fi interface) an average number of 998 packets per seconds are exchanged. This empirically demonstrates that PowerTutor calculates the same energy consumption while the Wi-Fi is communicating, independently from the number of actual packets. This point suggests that the HL measurements provided by PowerTutor are unable to recognize variations in consumption due to variations in the number of packages. As a proof of this, Fig. 3 shows that PowerTutor does not recognize any variation in the Wi-Fi consumption although after 50 seconds the pingflood attack begins. On the contrary, it keeps measuring a fixed consumption of 719 mW on the Wi-Fi interface during the whole experiment. It is worth noticing that the only variation in both the CPU and the Wi-Fi energy consumption is recognized after 76 seconds, since the Skype call is suddenly interrupted due to the saturation of the bandwidth caused by the ping-flood attack. However, the ping-flood attack does not necessarily lead to an interruption of the Skype call. In this latter case, there is no way to recognize the presence of the ping-flood attack by relying on PowerTutor measurements. LL Measurements. LL measurements provide an instant consumption of the whole system at a granularity of 250 msec. Since this kind of measurement does not allow to precisely discriminate between the single energy sinks, we had to reduce the energy consumption of audio, screen, 3G and GPS at the minimum in order to exclude as much as possible their contribution on the global measurements. We defined and executed proper script at Android’s Linux layer to keep them deactivated during the whole measurements. Fig. 4, 5, and 6 show the trend of measurements. Note that the value displayed at time T is the average of all the measures taken in the previous 10 seconds, that is, given the sampling rate, the average of 40 samples. This, actually, implements a smoothing filter that takes out erratic variations and reveals the power consumption trend producing a clearer, albeit less precise in time, view of the energy footprints. According to Fig. 4, the execution of a Skype call has a regular trend with the consumption constantly in a neighborhood of 2300 mW. Variations are due to the different number of packets exchanged per seconds and the base OS activity, as the analysis of logs demonstrates. Similar considerations worth for the ping-flood attack, showing that it is very difficult to associate a regular trend to
539
2700
LL: Skype
Power (mW)
2650 2600 2550 2500 2450 2400 2350 2300 2250
Time (s)
2200 0
10
20
Figure 4.
30
40
50
60
70
80
LL: energy footprint of the Skype call
a specific single activity by considering global consumption only. 2700
LL: Ping Flood
Power (mW)
2650 2600 2550
2500 2450 2400
2350 2300 2250
Time (s)
2200 0
10
Figure 5.
20
30
40
50
60
70
80
V. M IDDLE L EVEL MEASUREMENTS
LL: energy footprint of the ping-flood attack
However, LL measurements reveal to be reliable in recognizing variations due to the overlapping of two activities. In fact, as Fig. 6 shows, LL measurements allow to recognize the beginning of the ping-flood attack. In detail, the number of new packets pushed inside the network interface during the attack forces additional consumption on the Wi-Fi and, consequently, on the battery that observes higher consumption. 2540
LL: Skype and Ping Flood
Power (mW)
2520
2500
2480
2460
2440
2420
Time (s)
2400 0
Figure 6.
10
of HL measurements may provide and exploit the important feature of isolating energy consumption of single hardware devices for coarse-grained detection. On the other side, the precise global power consumption measurements provided by the patched drivers identify clearly the attack onset. This is possible since LL measurements provide a level of accuracy that is much higher than the one we achieved with HL ones. This accuracy allows to easily spot the beginning of the ping-flood attack. Nonetheless, the cost of this methodology is quite high in terms of intrusiveness into the operating system and also, as the absolute values of measured power suggest, in term of power consumption caused by the measurements themselves. The LL measurements accuracy also clearly identifies the variations in global power consumption also due to background activities of the system that it was not possible to completely shut down, leading to cyclic trends in the resulting graphs (see Fig. 4, 5, and 6) which are loosely related with single activities. To overcome such limitations, in the next section we propose a third approach (Middle Level measurements) allowing to precisely measure the actual global power consumption at a higher level, thus preserving the reliability of LL measurements and the non-intrusiveness and the energy-saving property of HL measurements.
20
30
40
50
60
70
80
LL: energy footprint of the Skype call and the ping-flood attack
General considerations. HL measurements are not particularly reliable since neither the CPU power consumption, nor the Wi-Fi power consumption, nor the sum of the two is capable of discriminating when the attack begins; not even in a simplified scenario with only two ongoing activities. Thus, we may conclude that the estimation provided starting from hardware usage counters is not precise enough to serve for security purposes. However, more fine-grained calculation
Middle Level (ML) measurements are based on the direct observation of power consumption from the battery hardware without drilling into the driver itself. As we have already observed in the previous section and contrarily to what is commonly believed, measuring the energy consumption directly may provide disclosure of malicious activities, even a better one than what is provided by indirect measurements through hardware components utilization. Our goal is to achieve a sufficient level of accuracy without the need to patch into the OS drivers and force unessential sampling. Most of the modern Li-ion batteries have an integrated chip dedicated to controlling the energy flowing into and from the cells to prevent over-charge and over-discharge that will ruin the same batteries, possibly causing them to burst. These chips provide a measure of these energy flows that may be extremely precise when they integrate a Coulomb counter as it is the case of the Dallas Semiconductor DS2784 1-Cell Stand-Alone Fuel Gauge IC that is embedded in the SEIDIO, Product number BASI16HNX1, 1600mAh capacity, battery we have used. The values measured by the chip are made available to user space through the files • sys/devices/platform/ds2784-battery/getcurrent, and • sys/devices/platform/ds2784-battery/getvoltage. We read such files at different intervals served that measurements less than two always equals. This led us to conclude chip embedded in the battery is capable
540
and we have obseconds apart are that, even if the of high precision
measurements with a relatively small interval between them, the OS copies the values into the files only once every two seconds. The observed sampling frequency is rather low and could allow for attacks generating very short spikes exactly between two sampling instants to go undetected; thus, in principle, it could be possible to hide an attack from this kind of measurements. However, there are two reasons why this fact does not represent a significant security risk. First, it is extremely difficult for an attacker to synchronize with OS internals at that level of precision before the system has been successfully intruded. Second, the hardware chip embedded in the battery provides a measure of the remaining battery capacity too, thus it is possible to compare the integral of the sampled power values with the remaining battery capacity to identify the presence of anomalies between measurements. For these reasons, we consider the sampling frequency sufficient to perform a security monitoring of the power consumption. In order to evaluate the potential of the ML approach in identifying the presence of malicious activities, we replicated the experiments described in Section IV. The device used for ML measurements has been an HTC Desire with the previously mentioned battery. Once again, the need to have specific capabilities in the hardware forced us to use yet another different device. As we stated before, though, the hardware diversity poses limitations only in the comparison between absolute values of the power consumption, while it allows comparing the trends and the power consumption shapes needed to identify the onset of the ping-flood attack.
Figure 7.
ML: energy footprint of the Skype call
result; in fact, while the frequency of the measurements is lower, the smoothing applied to LL measurements prevents them from creating spikes outside the capabilities of the ML approach. The absolute values for the power consumption is one order of magnitude lower in ML than it is in LL measurements; however, because of the hardware diversity, we cannot conclude that this difference is completely due to the lower energy impact of the ML approach. Nonetheless, such a significant reduction in power consumption allows us to: 1) state that the ML approach does not introduce additional power consumption when compared to the LL approach, since it does not forces unnecessary sampling and readings from the battery driver; 2) formulate the hypothesis that the ML approach reduces significantly the power consumption with respect to the LL approach. In future works we will define the actual size of this reduction if a mobile device compliant with both the LL and the ML measurements methodology will be available. To complete our evaluation of the ML approach, we now observe the graph of the Skype and ping-flood situation (Fig. 9). Again, the absolute value of the power consumption is quite different from the one observed through the LL measurements. However the trend and the power consumption shape show an extreme level of similarity and the onset of the attack is easily spotted at T equals to 50 seconds. It is also quite important to notice that, in this case, the graph for the power consumption resulting from the Skype call and the ping-flood attack assumes values that are very close to the sum of the average consumption of Skype and the average consumption of the ping-flood attack. This, again, suggests that the energy footprint of ML measurements may be very low. VI. C ONCLUSION AND FUTURE WORKS
Figure 8.
Figure 9.
ML: energy footprint of the ping-flood attack
ML: energy footprint of the Skype call and the ping-flood attack
In figures 7, 8 and 9 we show the graphs of the measurements obtained by sampling the values contained in the previously cited /sys files. Figures 7 and 8 clearly indicate that the shape of the power consumption graph is basically the same observable in LL measurements. This, actually, is an expected
In this paper, we have analyzed two different approaches to the problem of measuring the energy consumption of activities on an Android device and we have evaluated their suitability to recognizing ongoing malicious activities. More in details, we have analyzed if a high level approach based on hardware resources usage counters as the one described in [11] and a low level approach based on direct energy measurements at battery level as the one described in [9] provide measurements accurate enough to identify the onset of a ping-flood attack on top of a legitimate Skype call. Our findings show that only the second provides reliable energy measurements for identifying the attacks, but has a high level of OS intrusiveness that greatly limits the portability of the approach. Furthermore, high sampling frequency may squander energy for the measurements themselves. To overcome said limitations, we have studied a third, middle level solution providing the level of efficacy in measurements of the low level approach with the portability of the high level
541
one, with potentially a lower energy footprint. The experimental evaluation shows that this approach is capable of identifying the attack. Furthermore, although in this paper we do not provide a precise assessment of the power consumption due to the measurement, the experimental evidence shows a low level for the global energy consumption. Our work shows that the common idea that hardware usage counters are better suited to recognize security threats than energy measurements is actually a misconception. Furthermore, it shows that it is possible to get energy consumption measurements from a middle level achieving sufficient accuracy without neglecting portability and without introducing the high energy consumption overheads that is typical of the low level approach. Finally, we argue that superior reliability in measurements for energy footprints of malware can be reached if future developments will allow combining the precision of middle/low level measurements with the possibility of precisely isolating the consumption of single hardware components. Authors in [20] argue that it is not possible to identify malicious activities from energy consumption, however our work shows that they adopted too imprecise measurements (i.e. the HL measurements taken by means of PowerTutor). In our future work, we will study how to provide precise measurements of the energy consumption overhead introduced by the ML measurements and their porting on a number of Android-based devices. Furthermore, we will generalize the set of applications and attacks considered to foster the building of publicly-available databases of energy footprints. R EFERENCES
[10] A. A. Nacci, F. Trov`o, F. Maggi, M. Ferroni, A. Cazzola, D. Sciuto, M. D. Santambrogio. Adaptive and Flexible Smartphone Power Modeling, in Mobile Networks and Applications, Volume 18, Issue 5, pp 600-609, Springer, October 2013. [11] L. Zhang, B. Tiwana, Z. Qian, Z. Wang, R. P. Dick, Z. Mao and L. Yang. Accurate Online Power Estimation and Automatic Battery Behavior Based Power Model Generation for Smartphones, in Proc. of the Int. Conf. on Hardware/Software Codesign and System Synthesis, Oct. 2010. [12] C. Yoon, D. Kim, W. Jung, et al. AppScope: Application Energy Metering Framework for Android Smartphone using Kernel Activity Monitoring, In Proc. of the 2012 USENIX Technical Conference, June 13-15, 2012. [13] I. Burguera, U. Zurutuza, S. Nadjm-Therani. Crowdroid: behavior-based malware detection system for Android. In Proc. of the 1st ACM workshop on Security and privacy in smartphones and mobile devices (SPSM’11), 2011. [14] A. D. Schmidt, F. Peters, F. Lamour, C. Scheel, S. Ahmet, S. Albayrak. Monitoring smartphones for anomaly detection. Mob. Netw. Appl. 14, 1 (February 2009), 92-106. [15] H. Kim, J. Smith, K. G. Shin. Detecting energy-greedy anomalies and mobile malware variants, in Proc. of the 6th International Conference on Mobile systems, applications, and services (MobiSys ’08). ACM, New York, NY, USA, pp. 239-252. [16] M. Dong, L. Zhong. Self-constructive high-rate system energy modeling for battery-powered mobile systems. In Proceedings of the 9th international conference on Mobile systems, applications, and services (MobiSys ’11). ACM, New York, NY, USA, 335-348. [17] Y. Xiao, R. Bhaumik, Z. Yang, M. Siekkinen, P. Savolainen, A. YlaJaaski. A System-Level Model for Runtime Power Estimation on Mobile Devices. In Proceedings of the 2010 IEEE/ACM Int’l Conference on Green Computing and Communications & Int’l Conference on Cyber, Physical and Social Computing (GREENCOM-CPSCOM ’10). IEEE Computer Society, Washington, DC, USA, 27-34. [18] T. Martin, M. Hsiao, D. Ha, J. Krishnaswami. Denial-of-Service Attacks on Battery-powered Mobile Computers. In Proc. of the 2nd IEEE International Conference on Pervasive Computing and Communications (PerCom’04), Washington, DC, USA, p. 309. [19] A. Carroll, G. Heiser. An analysis of power consumption in a smartphone. In Proceedings of the 2010 USENIX conference on USENIX annual technical conference (USENIXATC’10) [20] J. Hoffmann, S. Neumann, T. Holtz. Mobile Malware Detection Based on Energy Fingerprints ? A Dead End?, in Research in Attacks, Intrusions, and Defenses, LNCS Vol. 8145, 2013, pp 348-368
[1] J. Pepitone. BlackBerry service restored after worst outage ever, http: //money.cnn.com/2011/10/13/technology/blackberry outage/, accessed on January 12th 2014. [2] M.Thomas. iPad functionality is just what the doctor ordered, http://www.suntimes.com/news/metro/2814148,CST-NWShealth19.article, accessed on January 12th 2014. [3] US. Department of Defense, Security Technical implementation Guide, http://iase.disa.mil/stigs/a-z.html, accessed on January 12th 2014. [4] C. Doukas, T. Pliakas, I. Maglogiannis. Mobile healthcare information management utilizing Cloud Computing and Android OS, in Proc. of the 2010 IEEE Annual International Conference of Engineering in Medicine and Biology Society (EMBC), pp.1037-1040, Aug. 31, 2010-Sept. 4, 2010, doi: 10.1109/IEMBS.2010.5628061 [5] C. Soomlek, L. Benedicenti. Operational Wellness Model: A Wellness Model Designed for an Agent-Based Wellness Visualization System, eHealth, Telemedicine, and Social Medicine, 2010. ETELEMED ’10. Second International Conference on , vol., no., pp.45,50, 10-16 Feb. 2010, doi: 10.1109/eTELEMED.2010.14 [6] K. W. Derr. Nightmares with Mobile Devices are Just around the Corner!, Proc. Of the 2007 IEEE International Conference on Portable Information Devices, 2007. DOI: 10.1109/PORTABLE.2007.14 [7] L. Caviglione, A. Merlo. The energy impact of security mechanisms in modern mobile devices, in Network Security, Volume 2012, Issue 2, February 2012, Pages 11-14. [8] X. Li, F. T. Chong. A Case for Energy-Aware Security Mechanisms, 27th International Conference on Advanced Information Networking and Applications Workshops, pp. 1541-1546, 2013 27th International Conference on Advanced Information Networking and Applications Workshops, 2013 [9] M. Curti, A. Merlo, M. Migliardi, S. Schiappacasse. Towards EnergyAware Intrusion Detection Systems on Mobile Devices in Proc. of the 8th International Conference on High Performance Computing Systems (HPCS 2013), July 1-5 2013, Helsinki (Finland), pp. 289-296.
542