Institute of Computer Science, FORTH Vassilika Vouton, P.O.Box 1385, 711. 10, Heraklion, Greece and ... a power-law for the total-degree CCDF of the property graph ...... of online FOAF12 documents and analyzed the resulting RDF instance ...
IEEE TRANSACTIONS ON KNOWLEDGE AND DATA ENGINEERING
1
On Graph Features of Semantic Web Schemas Yannis Theoharis, Yannis Tzitzikas, Dimitris Kotzinos, and Vassilis Christophides
Abstract— In this paper, we measure and analyze the graph features of Semantic Web (SW) schemas with focus on powerlaw degree distributions. Our main finding is that the majority of SW schemas with a significant number of properties (resp. classes) approximate a power-law for total-degree (resp. number of subsumed classes) distribution. Moreover, our analysis revealed some emerging conceptual modeling practices of SW schema developers, namely: a) each schema has a few focal classes that have been analyzed in detail (i.e., they have numerous properties and subclasses) which are further connected with focal classes defined in other schemas, b) class subsumption hierarchies are mostly unbalanced (i.e., some branches are deep and heavy, while others are shallow and light), c) most properties have as domain/range classes that are located high at the class subsumption hierarchies and d) the number of recursive/multiple properties is significant. The knowledge of these features is essential for guiding synthetic SW schema generation, which is an important step towards benchmarking SW repositories and query languages implementations. Index Terms— Semantic Web, power-laws, conceptual schemas morphology
A
I. I NTRODUCTION
great number of Semantic Web (SW) schemas expressed in either RDFS [1] or OWL [2] has been developed during the last years. A SW schema can be viewed as a directed labeled graph where nodes are classes or literal types and arcs are properties. In this paper, we are interested in studying the morphology of real SW schemas based on the graph features they exhibit. A main feature that characterizes graphs is the degree distribution. The Internet topology [3], the WWW [4], [5], as well as the call graph [6] have been observed to exhibit a power-law distribution for their in- and out-degrees. In our context, we need to analyze SW schema graphs whose structure is of different nature than the graphs already studied in the literature. In particular, according to the RDF/S [1] or OWL [2] specifications, in these graphs we have a) arcs representing subsumption relationships among classes, and b) arcs representing relations between classes (e.g. has a) or attributes (e.g. title), collectively called properties. Hence, for each SW schema we essentially need to study two graphs that have the same set of nodes (i.e., classes or literal types), namely, the subsumption, and the property graph. It would be interesting to investigate whether the property graph exhibits a power-law degree distribution. Examining the distributions involved in the subsumption graph could provide additional hints about the morphology of SW schemas. Specifically, we investigate power-laws on two different functions of a DRV (Discrete Random Variable) X . The first, called Complementary Cumulative Density Function (CCDF), i.e., P (X ≥ x), measures the frequencies of X values, while the second, denoted Y. Theoharis, Y. Tzitzikas, D. Kotzinos and V. Christophides are with the Institute of Computer Science, FORTH Vassilika Vouton, P.O.Box 1385, 711 10, Heraklion, Greece and with the Department of Computer Science, University of Crete, P.O.Box 2208, 71409 Heraklion, Greece (Email: {theohari, tzitzik, kotzino, christop}@ics.forth.gr).
by VR (Value vs Rank), measures the relationship between the i − th biggest X value and its rank (in descending order), i.
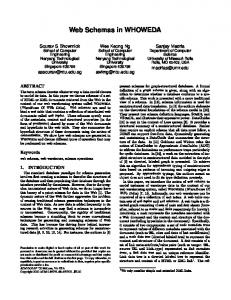
Regarding the property graph, it should be noted that it may contain self-loops (e.g., recursive properties) and multiple arcs (i.e., two classes may be connected by more than one property). In our study, we mainly focus on the core RDFS [1] features which are also exploited by OWL. This decision is motivated by the fact that the majority of available SW schemas rely on the RDFS specification (according to [7], 85.45% relies on RDFS, while 14.55% on OWL). We additionally take into account OWL expressions, such as unionOf, intersectionOf, someValuesFrom and allValuesFrom, that impact the features of the underlying property and subsumption graphs. Furthermore, we study the features of individual1 SW schema graphs instead of the universal SW graph aggregating all SW schemas. This is motivated by the fact that the statistical analysis of individual SW schema graph features is essential to synthetically generate realistic SW schemas. Such a detailed analysis of individual SW schemas is not provided in [8], which essentially analyzes the aggregation of all DAML library ontologies. For instance, they found that the total-degree (i.e. in- plus out-degree) CCDF approximates a power-law with exponent 1.48. In our work, we have found individual schemas that approximate a power-law for the total-degree CCDF of the property graph with exponents that lie in [0.65, 2.05]. Moreover, to obtain a more accurate picture regarding the morphology of each schema, we distinguish between arcs for which transitivity holds (i.e., subsumption relationships) from the others (user-defined properties). This is not the case in [8] which mixes both kinds of arcs. Furthermore, the percentages of schemas exhibiting each of the features under consideration are different (see Figure 1). This fact further justifies the decision to study individual schemas rather than the universal SW graph. In this context, the main contributions of this work are: i) This is the first work analyzing the property graph for individual SW schemas We show that in their majority they approximate a power-law for property total degree functions (94.8% for VR and 67.2% for CCDF). In contrast to our work, [9] studied only the subsumption graph of schemas, while [8] did not distinguish subsumption relationships from user-defined properties. ii) By analyzing the subsumed classes VR (apart from the CCDF which has been also analyzed by [9]), we have realized the high variability of number of subsumed classes values (beyond the high variability of their frequencies). More precisely, we show that the VR (resp. CCDF) function approximates a power-law for the 87.9% (resp. 60.2%) of the schemas defining a significant number of classes. Unlike our work, [9] studied the universal subsumption graph ag1 With the term ”individual schema” we refer to the union of the schema under consideration and the schemas it relies on.
IEEE TRANSACTIONS ON KNOWLEDGE AND DATA ENGINEERING
PL
2
PL
VR
41.3%
CCDF
24.1%
|propertiesTo(c)| c
Gs*
|propertiesFrom(c)|
VR
58.6%
CCDF
32.7%
|descendants(c)|
Gp
PL VR
87.9%
CCDF
60.2%
PL c
|properties(c)|
VR
94.8%
CCDF
67.2%
G p : 17% of the properties of each schema are “multiple arcs” G p : 12% of the properties of each schema are self-loops Class Subsumption Property Undirected Property
PL: Power Law (ACC ≥ 0.9)
Fig. 1.
|propertiesFrom(c)| = |{p ∈ P | from(p)=c}| |propertiesTo(c)| = |{p ∈ P | to(p)=c}| |properties(c)| = |propertiesFrom(c)| + |propertiesTo(c)|
The main results of our analysis
gregating a set of taxonomic schemas (i.e. schemas with few or no properties) and reported a power-law exponent equal to 2.2. In our work, we have found that individual schemas approximate a power-law for subsumed classes CCDF (resp. VR) with exponents that lie in [0.54, 1.47] (resp. [0.97, 2.44]). iii) We provide the means to sketch an abstract morphology of SW schemas. In particular, we show that the classes with big degrees in the property graph (i.e., classes with many properties) are usually located at the higher levels of the subsumption graph. Finally, class subsumption hierarchies are mostly unbalanced with large branches and many leaves (i.e., 75% of the classes). To the best of our knowledge, no other work has reported similar results. The knowledge of the above features is essential for guiding synthetic SW schema generation. This is actually a first step towards synthetic SW data generation (instantiating one or several SW schemas) needed to benchmark SW repositories and query languages implementations against voluminous datasets. Our choice is motivated by the fact that the full potential of the SW lies on the existence of schemas, which can be exploited to support advanced querying and reasoning services against the available SW data. Last but not least, existing work in the literature already reports experimental findings regarding SW data ([10], [11], [12], [7], [13], [14], [15]). The remainder of this paper is organized as follows: Section II provides formal definitions of SW schema graphs, while Section III defines power-law distributions. Section IV details the corpus of schemas used in this work, the methods adopted in the experiments performed, and details the results of our analysis. Based on these measurements section V sketches the general morphology of SW schemas. Section VI shows how the graph features that are commonly exhibited by real SW schemas can be used to generate synthetic ones. Finally, Section VII resumes related work and Section VIII summarizes the contributions of our paper and identifies issues for future research. II. S EMANTIC W EB S CHEMA G RAPHS SW schemas are usually represented as directed labeled graphs where nodes are classes or literal types and arcs are properties. These graphs may have self-loops (representing recursive properties) and multiple arcs (when two classes are connected by
several properties). In particular, SW schemas have two different kinds of arcs. The first comprises attributes or relationships among classes, which are called properties. The second comprises subsumption relationships (rdfs:subclassOf ) among classes. As the interpretation of these two arc kinds is different, for each SW schema we need to define two graphs: a) the property and b) the subsumption graph. Both graphs have the same set of nodes (i.e., the union of classes and literal types used in the schema) but they comprise different kinds of arcs. Def 2.1: The property graph of a schema is a directed graph G p = ({C ∪ L}, P ), where C is a set of nodes labeled with a class name, L is a set of nodes labeled with a literal type, P is a set of arcs of the form hc1 , p, c2 i where c1 ∈ C , c2 ∈ C ∪ L, and p is a property name.� If hc1, p, c2i is an arc, we shall write domain(p) = c1 and range(p) = c2. Def 2.2: The class subsumption graph of a schema is a directed graph G s = (C, Ps ), where C is a set of nodes labeled with a class name and Ps is the transitive and reflexive binary relation that represents subsumption relationships among classes.� We can denote an arc of this kind by hc1 , c2 i meaning that c1 is a subclass of c2 . For example, Figure 3 depicts the property and the subsumption graph of the schema ns1 illustrated in Figure 2. It should be stressed that, according to the RDF/S semantics [16], class subsumption is a transitive relation and hence the subsumption graph should be transitively closed. The effect of the subsumption to the property graph is implicit. A. Tackling OWL Characteristics In this work we ignore the logic-style descriptions (e.g., minCardinality, differentFrom etc.) of schemas expressed in OWL [2], apart from those that concern the morphology of their graphs, i.e., unionOf, intersectionOf, someValuesFrom, allValuesFrom and inverseOf expressions. In particular, we have transformed OWL unionOf and intersectionOf expressions (in class or property definitions) as depicted in Figure 4. More precisely, for each expression of the from A ∪ B , A ∪ B ∪ C , A ∩ B , A ∩ B ∩ C , we have added the appropriate subsumption relationships of the form hA ∪ B, rdfs:subclassOf, A ∪ B ∪ Ci, hA ∩ B ∩ C, rdfs:subclassOf, A ∩ Bi. We also exploited the Restriction feature of OWL (someValuesFrom / allValuesFrom) to identify the domain/range of properties. Finally, inverseOf expressions have been taken into consideration by the analysis of total degrees of the property graph (see Section IV-B). B. Schema Reusability & Refinement The articulation of SW schemas spread all over the world (through reuse or refinement) impacts the resulting subsumption and property graphs. Schema reuse or refinement are well-known notions in the software engineering community and have been widely used for XML schemas [17]. Reusability of SW schemas is mainly achieved through the definition of properties, i.e., a schema can define as domain/range of one of its properties a class that is defined in another schema. This case is depicted in Figure 2 where schema ns4 defines that property p2, which is defined in ns1, has as domain the class B2 (defined in ns2) and as range the class C4 (defined in ns4). Refinement of SW schemas is achieved through the introduction of subsumption relationships between
IEEE TRANSACTIONS ON KNOWLEDGE AND DATA ENGINEERING
ns1
ns3 E1
p2
B1
p1
p1
B1
p5
C1
D1
p3
E1
p2
F1
p4
p5
G1
p3
D1
ns4 ns2
A4
B2
p2
C4
E1
p6 p2
p3
G1 D1
isA property
C1
B1 F1
E1
G1
F1
Class
C2
Fig. 3.
Property and subsumption graphs of schema ns1 of Figure 2
Class defined in the schema Class defined in other schemas
IntersectionOf:
UnionOf: D
p
Fig. 2.
A1
C1
A2
B2
isA property defined in the schema property defined in other schemas instanceOf
p1
B1
p6
C1
Subsumption Graph
Property Graph
A1
F1 p4
3
A
SW schemas reusability and refinement A
classes/properties defined in different schemas. For instance, in Figure 2, ns2 defines classes B2 and C2 and declares that they are subsumed by E1 and F1 respectively, which have been introduced in schema ns1. Note that a schema can declare that one class may subsume another without defining any of these two classes. For example, ns3 declares that classes B1 and C1, which are defined in ns1, are subclasses of E1 and F1 respectively, which are also defined in schema ns1. Due to the aforementioned interconnection among schemas, the (property or subsumption) graph of a schema is obtained from the union of its classes and properties with those of the schemas that are reused or refined by it. III. P OWER L AWS In this Section we introduce power-laws and elaborate on various kinds of distributions that one can study in order to identify them. Subsequently, we show how we can decide whether a function approximates a power-law. A. Power Law Functions Def 3.1: A power-law is a function f : X ⊆ R∗+ → R∗+ of the form: f (x) = αx−β , where α, β are constants, with α, β ∈ R∗+ . Equivalently, log f (x) = log α − β log x. � This means that f (x) can be drawn as a line in the log-log scale with a slope equal to −β . Power-law functions are scale-free, in the sense that if x is rescaled by multiplying it by a constant, then f (x) would still be proportional to x−β . The above definition excludes the value β = 0, since in this case f (x) would be equal to α for all values of x, i.e. f would be constant (uniform distribution, if f is the probability density function of a discrete random variable). Loosely speaking, uniform distributions can be regarded as a trivial case of powerlaw distributions. Intuitively, the value of β is a measure of the skewness of the distribution, i.e. β = 0 implies no skewness. As will be explained in Section VI, the power-law exponents for the distributions studied in this paper can be employed to synthetically generate realistic SW schema graphs. At this point, the question that naturally arises is on what kind of distributions one could investigate power-laws. Let X be a Discrete Random Variable (DRV) whose set of possible values is denoted by D. For X one could study:
B
C
B p
isA property
Fig. 4.
C
D
Treatment of union and intersection OWL constructs
its complementary cumulative probability density function (CCDF), i.e., P (X ≥ x); • the relationship among the values of its range and their rank in decreasing order (VR), i.e., a function2 V R : [1, |D|] → D. To measure the occurrence frequency of X values, one could instead consider PDF (Probability Density Function), i.e., P (X = x). However, CCDF yields more credible experimental results as we will explain in Section III-B. As a matter of fact, one needs only to measure CCDF and the results regarding PDF follow immediately. It is worth mentioning, that VR reflects the variability of the values, while CCDF measures only the occurrence frequencies of the values and not their correlation [18]. To highlight their difference, consider the following example. Let S = h10, 9, 9, 9, 5, 5, 5, 5, 4, 4i be a sequence of X values. The first and second columns of Table I show respectively the corresponding PDF and CCDF. For instance, P (X ≥ 4) = 10 10 = 1, since 10 elements of S are greater than or equal to 4. Similarly, 8 P (X ≥ 5) = 10 = 0.8. One could also define a function g (see the third column of Table I) that measures only the discrete values of S that are greater than or equal to a specific value. For example, g(4) = 4, since there exist only 4 (i.e., {10, 9, 5, 4}) distinct values of S which are greater than or equal to 4. Similarly, g(5) = 3, since only 3 distinct values of S are greater than or equal to 5. Obviously, g is different from CCDF. Consider now that S 0 = {10, 9, 9, 8, 5, 5, 5, 5, 4, 4} 6= S . Then, P (X ≥ 4) = 1 for both S and S 0 , while g(4) = 4 for S but g(4) = 5 for S 0 . Table I (right) shows the VR function corresponding to S . Specifically, the greatest value of S is 10. Similarly, the second greatest (distinct) value of S is 9. As one can easily observe, VR is the inverse of g . As a consequence VR is directly correlated with •
2 Although, in the literature VR is referred as distribution (e.g. ”degreerank distribution” in [3]), it ignores the occurrence frequencies of values (its definition is referred as non-stochastic in [18]). To refer to both CCDF and VR with one term, we hereafter use the term ”function”.
Fig. 5.
x 4 5 9 10
-0.5
4
log( % of classes with >= x descendants )
log( % of classes with >= x descendants )
IEEE TRANSACTIONS ON KNOWLEDGE AND DATA ENGINEERING
CCDF of schema 45 Fitting (ACC = 0.91)
-1 -1.5 -2 -2.5 -3
0
0.5
1 1.5 log( # of classes )
2
2.5
0
CCDF of schema 9 Fitting (ACC = 0.94)
-0.5 -1 -1.5 -2 -2.5 -3 -3.5 -4
0
0.5
1 1.5 log( # of classes )
2
2.5
Examples of different ACC values for CCDF PDF P (X = x) 0.2 0.4 0.3 0.1
CCDF P (X ≥ x) 1 0.8 0.4 0.1
g(x) 4 3 2 1
rank 1 2 3 4
VR(rank) 10 9 5 4
TABLE I F UNCTIONS CORRESPONDING TO THE BAG S = {10, 9, 9, 9, 5, 5, 5, 5, 4, 4}
g and not with CCDF and hence we measure it separately.
We should also stress that the rank in VR refers to a decreasing ordered set of values. For instance, in {10, 9, 5, 4} value 10 has rank 1 and value 9 has rank 2. In this respect, the so called Zipfian distribution [19] is different from VR. In particular, the former correlates the occurrence frequency of values, with their corresponding rank (and thus is also called ”frequencyrank” relationship [20]) in decreasing order. For example, the occurrence frequencies of S values in decreasing order consist of the set {4, 3, 2, 1}, since the most frequent in S value (i.e. 5) has occurrence frequency 4, i.e., f r(1) = 4. Similarly, the second most frequent in S value (i.e. 9) has occurrence frequency 3, i.e., f r(2) = 3. Since ”frequency-rank” relationship is essentially the same as CCDF (and PDF) [21] we do not measure it separately. Intuitively, the fact that the VR of a DRV X follows a powerlaw reveals the high variability of X values. For instance, the value variability of {1000, 100, 10, 1} is higher than that of {4, 3, 2, 1}. On the other hand, the fact that the CCDF follows a power-law reveals the high variability of the frequencies of X values. For instance, the variability of value frequencies of {4, 3, 3, 2, 2, 2, 2, 1, 1, 1, 1, 1, 1, 1, 1} is higher than that of {4, 4, 3, 3, 2, 2, 1, 1} (note that in both cases the set of values is the same, i.e., {4, 3, 2, 1}). As a consequence, the increased percentages (that are reported in Sections IV-B, IV-C) of the schemas that approximate a powerlaw for VR in contrast to CCDF, reveal that the high variability of the considered DRV values is more frequent than the high variability of their frequencies. Last, but not least, both CCDF and VR functions are useful (each one for different reasons) for synthetic SW schema generation, as will be explained in Section VI.
B. Power Law Investigation Method In this paragraph we address the issue of investigating whether a function approximates a power-law and if it does, to what extent. We rely on a commonly used method, called Linear Regression [22], to fit a line in a set of 2-dimensional points (based on the least square errors method) and, thus, to investigate whether the log-log plot of a function approximates a line. The accuracy of the approximation is indicated by the correlation coefficient, the absolute value of which (hereafter called ACC ) always lies in [0, 1]. An ACC value 1.0 indicates perfect linear correlation, i.e., the points are exactly on a line. In the sequel, whenever we say that a function approximates a power-law, we mean that ACC ≥ 0.9, i.e., over 90% approximation. To provide a graphical representation of what the value of ACC means, Figure 5 illustrates two functions (figures are plotted in log-log scale with log base 10). In the left plot ACC = 0.91, while in the right ACC = 0.943 . If PDF follows a power-law with exponent β , i.e., P (X = x) = αx−β , then CCDF follows a power-law with exponent β − 1, i.e., P (X ≥ x) = γx−(β−1) (see [23] for details). Based on this fact, we only study CCDF and the results regarding PDF immediately follow. In this manner we avoid biased slope computations for the PDF plots due to their characteristic ’heavy tails’ [18], [23]. IV. E XPERIMENTAL R ESULTS In this section, we present in detail our sampling, methodology and the results of our experimental analysis4 . In particular, we study the degree distributions of G p and G s . The out-degree of G p can be regarded as the distribution of property domains, while the in-degree as the distribution of their ranges. However, from a conceptual modeling viewpoint, the direction of the properties is not important. One can replace the property hB1, p1, C1i of ns1 of Figure 2, with the property hC1, p7, B1i by inverting the direction and changing the property label (see also the OWL inverse properties). Thus, it is reasonable to also study the total-degree distribution of G p and try to compare its characteristics with those of the in-/out-degrees. Furthermore, since subsumption plays a significant role in SW schemas we are also interested in investigating the in/out-degree (corresponding to transitive subclasses/superclasses 3 To produce the plots as well as to perform linear regression we used Gnuplot. 4 To perform this analysis we extended VRP [24] statistics package.
IEEE TRANSACTIONS ON KNOWLEDGE AND DATA ENGINEERING id 1 2 3 4 5 6 7 8 9-16 17 18-26 27 28 29-36 37 38 39 40 41 42 43 44 45 46 47 48 49 50 51 52 53 54-55 56 57 58
Name tap dcd100 not-galen opencycprotege cyc bsr milo sweet data sweet phenomena clib-core-office mds weap of mass destr ontology science sumo framenet 1.1 inferred adw p3p-rdf-schema akt-refont-20020509 kimo akt portal ont mgedontology spacenamespace resume phontology spase 051214 cerif geo Inf Met copyright Ontology georelations onto geocoordsyst moviedatabase datatypes cononto Fuzzy
# of Classes 6031 5112 3135 2966 2731 2724 2480 2036 1923 1352 856 828 823 790 643 537 445 422 362 341 228 226 224 217 193 176 164 158 155 148 115 113 108 101 101
83 SCHEMAS WITH ≥ 100
5
# of Prop. 379 355 484 1317 1193 1770 458 205 190 1786 914 263 296 301 254 753 161 379 243 126 208 114 143 119 148 224 226 335 117 144 190 102 394 334 117
id 59 60 61 62 63 64 65 66 67 68 69 70 71 72 73 74 75 76 77 78 79 80 81 82 83
84 85 86 87 88 89
A. SW Schemas Corpus We collected 250 schemas from RDFSuite5 , SchemaWeb6 and Swoogle [25] schema registries. It should be noted that this corpus contains the biggest (in terms of number of classes and properties) schemas published on the WWW until May 2006, including the largest schemas from Swoogle2005 ontology set (with 4000 ontologies). The size of each schema (i.e., the number of classes and properties) is crucial for our analysis since for small schemas the ’noise’ would be significant and thus would hinder the deduction of credible conclusions. For instance, consider a schema that defines 30 properties. On average, there will be many classes that appear as domain of one and only property, i.e., the corresponding nodes of G p will have out-degree equal to 1. Some other classes will have out-degree 2 and only few classes will have a significantly higher out-degree (e.g. 10). Then the out-degree CCDF plot consists of 3 points (i.e., P (X ≥ 1), P (X ≥ 2) and P (X ≥ 10)). Since two points always define a line, the third point will probably not decrease the ACC value significantly. In this manner, almost all plots would 5 http://athena.ics.forth.gr:9090/RDF/VRP/Examples/
# of Classes 16518 9810 7006 1483 1012 795 620 592 503 463 295 295 288 223 216 166 166 138 129 127 125 125 107 101 100
# of Prop. 20 16 25 16 99 16 16 30 28 30 24 24 56 16 17 33 33 16 24 85 16 16 16 46 16
Small sized schemas reused/refined by others Dublin Core Element Set v1.1 41 Dublin Core Terms Namespace 41 The DCMI Types namespace 53 FOAF RDF vocabulary 53 OILStandardSchema 51 WGS84 Geo Positioning 43
TABLE II ≥ 100 PROPERTIES AND 25 WITH < 100
CLASSES (58 WITH
respectively) distributions of the subsumption graph, G s . To summarize we consider four DRVs, i.e., three for the out-/in/total-degrees of G p , and one for the in-degrees of G s . For each of the two functions of the considered DRVs we mainly focus on two aspects: a) the fraction of schemas that approximates a power-law; and b) the ranges of the power-law characteristic exponents.
6 www.schemaweb.info
Name unspsc84-title unspsc go acm-css mygrid-reasoned gams facc mygrid-services-lite java ontology mygriddomainontology sweet hum act sweet mat thing orel math inter kmi basic wine ontology food ontology substance gold sweto v2 3 earthrealm property openmath pizza 20041007 sweet biosphere
71 71 71 127 35 75
PROPERTIES )
be considered as good approximations of a power-law and as a consequence our study would loose its interest. To avoid this effect, the plots should comprise many points and this is achieved only for schemas with a significant number of properties (for plots that correspond to G p ) or classes (for plots that correspond to G s ). Hence, we categorized (see Table II) the schemas of our corpus according to their size. One group consists of 83 schemas with more than 100 classes. Note that there are four sets (i.e., 9 − 16, 18−26, 29−36, 54−55) of strongly interconnected schemas (i.e., each schema of a set reuses/refines all the other set schemas). A second group (subset of the first one) comprises 58 schemas that have more than 100 properties. It should be stressed that our extended corpus of 250 schemas also contains (e.g. schemas 84-89 in Table II) schemas that are smaller in size (but popular nevertheless), such as FOAF and Dublin Core. As they are small, they have not been analyzed separately and as a consequence the results of our analysis do not refer to them. Note however, that their classes and properties affect the results regarding many other big sized schemas that refine/reuse them. In this respect, for each schema we consider the graph obtained as the union of itself and all the schemas that it reuses or refines (see Section II-B). Detailed figures depicting the distributions of all corpus schemas are available at http://athena.ics.forth.gr:9090/RDF/VRP/SWSchemas/. B. Features of the Property Graph In this paragraph we present the results of our experimental analysis regarding G p . Apart from in-/out-/total-degrees, we also study the percentage of self-loops and multiple arcs. The main conclusion drawn is that the majority of SW schemas approximate
IEEE TRANSACTIONS ON KNOWLEDGE AND DATA ENGINEERING
Function CCDF VR Function CCDF VR Function CCDF VR
6
Domains (out-degrees) ≥ 100 Properties ≥ 300 Properties 19/58 (32.7%) 9/30 (30%) 34/58 (58.6%) 20/30 (66.6%) Ranges (in-degrees) ≥ 100 Properties ≥ 300 Properties 14/58 (24.1%) 12/30 (40%) 24/58 (41.3%) 22/30 (73.3%) Total (in- and out-degrees) ≥ 100 Properties ≥ 300 Properties 39/58 (67.2%) 25/30 (83.3%) 55/58 (94.8%) 29/30 (96.6%)
isA
C0
C1
C2
C4
C6
C7
C3
C5
C8
C9 C10
C11
TABLE III N UMBER OF SCHEMAS EXHIBITING A POWER - LAW FUNCTION FOR DOMAIN / RANGE / TOTAL Fig. 6. Distr. self-loops multiple arcs
Min 0.0 0.0
Max 0.382 0.626
Mean 0.126 0.177
St.dev. 0.124 0.194
COV 0.984 1.09
TABLE IV D ISTRIBUTION OF SELF - LOOPS / MULTIPLE ARCS
Structural pattern of class hierarchies Function CCDF VR
≥ 100 Classes 50/83 (60.2%) 73/83 (87.9%)
≥ 200 Classes 48/61 (78.6%) 59/61 (96.7%)
TABLE V N UMBER OF SCHEMAS EXHIBITING A POWER - LAW DISTRIBUTION FOR CLASS DESCENDANTS
a power-law for total-degree functions, while for out- and indegrees the corresponding percentages are significantly lower. We should also note that the percentages of the VR are always higher (see Table III) than those of the CCDF. This fact reveals that the variability of degree values is higher than the variability of their frequencies. In other terms, the trend of schema properties to define as domain/range focal (i.e., of high degree values) rather than peripheral (i.e., of low degree values) classes is stronger than the trend of schemas to define much more frequently peripheral than focal classes. 1) Distribution of Property Domains (out-degrees): Table III (upper) shows the portion of schemas that define more than 100/300 properties and also approximate a power-law for each considered function of property domains. The main conclusion that can be drawn is that the VR functions of property domains of most schemas (i.e., 58.6%) approximate a power-law. For CCDF the range of exponents lies between [0.5, 1.99], while for VR it lies between [0.83, 2.22]. 2) Distribution of Property Ranges (in-degrees): Table III (middle) shows the portion of the schemas that define more than 100/300 properties and also approximate a power-law for each function of property ranges. We conclude that as the number of properties increases, the portion of schemas that approximate a power-law also increases. The range of CCDF exponents lies in [1.12, 1.71]. Finally, for VR the corresponding range of its exponents is [0.91, 2.23]. 3) Distribution of Total Degrees: There is a strong correlation between the number of properties that have as domain a class and the number of properties that have as range the same class. This correlation was revealed by the analysis of the total-degree (in- and out-degree) functions, the results of which are shown in Table III (bottom). Note that the percentages for total degrees are greater than those corresponding to both in- (ranges) and outdegrees (domains). So if we consider the properties as undirected, then their distribution better approximates a power-law. The range of the exponents in this case lie in [0.65, 2.05] for CCDF and in [0.79, 2.18] for VR.
4) Self Loops and Multiple arcs: As we can see in Table IV, the percentage of self-loops is quite significant, i.e., 12.6% in the average case and its maximum reaches the 38.2% for schema 37. The average percentage of multiple arcs is slightly bigger, i.e., 17.7%, but its maximum roughly diverges from that of self-loops, reaching the 62.6% for schema 56. C. Features of the Subsumption Graph Concerning G s , we mainly focus on the in-degree (i.e., class descendants) functions7 . To discover dominating structural patterns of these hierarchies, we also studied the percentage of schema classes that are leaves. In addition to the vertical view of the hierarchies provided by the DRV for in-degrees and the percentage of leaf classes, we employ another DRV for analyzing the number of classes located at each hierarchy level and thus, reveal a horizontal view of the subsumption hierarchies. From our experiments we observed that class hierarchies are usually unbalanced, i.e., some branches are very deep, while others are shallow. Thus, few classes located high in the subsumption graph have big in-degree (i.e., many descendants), in contrary, most of those located at lower levels have small in-degree. In particular, large branches expose few leaves at the medium levels, while most of them are located at the maximum branch depth (see Figure 6). In conjunction with the list-like structure [27] of subsumption relationships, we can sketch the general morphology of class hierarchies as depicted in Figure 6 (transitive arcs are not drawn for simplicity). 1) Distribution of Class Descendants (in-degrees): Table V shows the portion of schemas that approximate a power-law for the two functions (CCDF and VR). Our results are presented for two groups of schemas: one with ≥ 100, and another with ≥ 200 classes. We can easily observe that the emergence of a power-law is almost total for VR function. Also, by comparing the two columns of Table V, we can observe that, as the number 7 For the analysis of out-degree (i.e., class ancestors) functions, readers are referred to [26].
IEEE TRANSACTIONS ON KNOWLEDGE AND DATA ENGINEERING
Distr. % of leaf classes
Min 49.88%
Max 96.37%
Mean 74.41%
St.dev. 0.1
7
COV 0.14
TABLE VI D ISTRIBUTION OF PERCENTAGES OF LEAF CLASSES
2.6
D. Combinatoric Features An interesting finding of our experiments is that most properties have as domain, classes which are located high in the class hierarchy, i.e., somewhere between the root and the middle level. This was revealed by computing for each schema the correlation coefficient (in most cases in [−1, −0.5]) between the depth in G s , of each class with its corresponding out-degree in G p . This fact shows that the specification of a class in SW schemas is used more for classification purposes rather than for refining classes with additional properties. The same trend was observed for range classes, although the dominance of classes located higher over those located lower in the subsumption graph is not so important as for property domains.
Exponent Vs # of Classes
2.4
exponent
2.2 2 1.8 1.6 1.4 1.2 1 100
1000
10000
# of classes
Fig. 7.
of classes increases (see Figure 7).
Exponents vs number of classes for VR class level distribution
of classes increases, the portion of schemas that approximate a power-law for both functions, also increases. The range of CCDF exponents lies in [0.54, 1.47] with a non linear but increasing trend with respect to classes number. The range of the VR exponents lies in [0.97, 2.44], while their mean value is 1.4 approximately. As one can easily observe from Table V, the percentages of the VR are higher than those of the CCDF. In this case, every DRV value corresponds to the number of (transitive) subclasses of one or more classes. The variability of values is high, since classes located at higher levels in the hierarchy have much more subclasses than classes located at lower levels. It is evident, that this variability increases as long as the total depth of the class hierarchies increases. On the other hand, the value frequencies (and consequently their variability) heavily depends on the morphology of hierarchies. 2) Leaf Classes: We observed that on average 75% of the classes of each schema are leaves (see Table VI). Given that in most schemas subsumption hierarchies are deep (on average depth = 8 [26]), if the number of direct descendants was the same for all classes, the percentage of leaves would be close to 50% (i.e., as in complete trees). However, from our experiments we observed that this number is small for intermediate level classes and big for the classes that are close to the leaves (see Figure 6). 3) Distribution of Class Levels: We consider that the level of a class c equals 0 if c is the root, otherwise it equals p + 1 where p is the level of its parent class (if c has more than one parents, then p is the maximum of their levels). In most cases, the number of classes at each level is different (so PDF is a constant 1 for all possible x values). The function, i.e., P (X = x) = depth biggest number of classes is observed between the middle and the maximum leaf level. This is due to the fact that only few branches reach the maximum depth of the hierarchies, while most of them end few levels higher. The class levels VR of 42.1% of schemas (for schemas with more than 200 classes it reaches the 54%) approximate a powerlaw with exponents in [1.04, 2.38]. Moreover, the corresponding exponent of the VR distribution increases as long as the number
V. E MERGING M ORPHOLOGY OF SW S CHEMAS Figure 8 depicts the abstract morphology of the graphs employed by the SW schemas of our corpus. The upper left part of the figure illustrates the distribution of classes to the various subsumption hierarchy levels. The upper right part of the figure shows the distribution of properties according to their level, computed as the mean of the levels of the classes that it connects (i.e., level(p) = (level(f rom(p)) + level(to(p)))/2). The drawings of Figure 8 (which resemble vases and amphoraes) were derived by first splitting the range of levels [0...maxDepth] into 4 equally sized intervals (named A, B, C, D), and then counting the classes/properties that are located at each level interval. At the upper left part of the figure we can observe that the minimum number of classes does not occur at level A (as one would expect) but between A and B. This is due to the fact that level A comprises all the literals, as well as, the classes of commonly reused schemas (like the Dublin Core or the FOAF schema) with shallow class hierarchies. The maximum number of classes is not placed at level D (as one would expect) but at level C (see also Section IV-C.3). This is due to the fact that class hierarchies are mostly unbalanced. At the upper right part of figure we can see that the maximum number of properties are placed at level B (see also Section IVD) and the minimum at level D. Notice that the number of properties at level A is bigger than the corresponding number of classes, since top level classes, although few, usually expose several properties. The bottom part of the figure illustrates the total number of elements (classes and properties) located at each level interval. In particular, the bottom right part of the figure captures schemas that have more properties than classes. For those schemas, the maximum number of properties is bigger than the maximum number of classes for a specific level interval and as a consequence the bottom right part of the figure converges to that of properties (upper right part). On the other hand, schemas with much more classes than properties are divided into two groups with respect to the level interval, denoted by M, at which the sum of classes and properties reaches its maximum. The former comprises schemas for which M converges to the level interval where the maximum number of classes occurs (resulting in the bottom left part of the figure). The latter comprises schemas for which M converges to the
IEEE TRANSACTIONS ON KNOWLEDGE AND DATA ENGINEERING
Level
Distribution of Classes
Distribution of Properties
(wrt to their level)
(wrt to their level)
Literal classes are all at level 1, plus some common used schemas (e.g. Dublin core, FOAF)
A
B
Top classes (although not many) have quite a lot of properties
Most properties have level slightly above the middle one
C Because the class subsumption hierarchies are not balanced
D
subclassOf
Very few properties at leaves
property
Distribution of Classes and Properties (wrt to their level) |Classes| >> |Properties|
|Classes| < |Properties|
Level
A
B
C
D
subclassOf
property
Fig. 8. Distributions of classes and properties w.r.t. their level in the subsumption hierarchy
level interval where the maximum number of properties occurs (resulting in the bottom right part of the figure). M actually depends on the morphology of the subsumption hierarchy of each schema, i.e., its depth, as well as, the percentage of its classes placed at lower levels. VI. T OWARDS S YNTHETIC SW S CHEMA G ENERATION In this Section we discuss how our findings can be exploited for generating synthetic SW schemas (for more details see [28]) by giving as input: i) the number of schema classes and properties; ii) the characteristic power-law exponent of the class descendants CCDF; iii) the characteristic power-law exponent of the total-degree VR; iv) the maximum depth of the class subsumption hierarchy; v) the morphology of the subsumption graph, e.g. on average 75% of classes are leaves and the level at which most classes are located is on average 43 of the depth of the subsumption graph; vi) the fact that classes of high out-degree in the property graph are located highly in the subsumption graph. We should notice that one may generate a taxonomy, i.e., a schema comprising only (or mainly) subsumption relationships (e.g., schemas 59 − 83 in Table II). In that case, we only need to generate G s and the inputs (iii) and (vi) are useless. The generation algorithm consists of two steps. The first, exploits the aforementioned findings in order to reduce the
8
generation of G p , G s to the problem of generating graphs given their in- and out-degree sequences8 (for G s the arcs transitivity should be taken into consideration). The second step is to solve that problem by a Linear Programming reduction, which allows us to generate SW graphs in polynomial time. Bellow, we sketch the main aspects of synthetic schema generation algorithm, with special focus on the manner in which the findings of this work are exploited. A. Generating G p , G s Degree Sequences To generate the total-degree sequence of G p , as well as the in-degree sequence of G s , we exploit two methods to sample a bag of values from a DRV that follows a power-law [28]. The first (denoted by PDFSampling) is based on the PDF 9 of the DRV, while the second (denoted by VRSampling) is based on the VR function of the DRV. PDFSampling is useful when we know the maximum allowed value for X . This is actually the case of in-degrees of G s in which the maximum allowed value is |C| − 1 (i.e., root descendants). On the other hand, VRSampling is useful when we know the sum of the values that should be sampled. This is actually the case of the total-degrees of G p where the sum of all total-degree values should be twice the number of schema properties (graph arcs). Recall that in the total-degree sequence we count every arc twice, i.e., once through the origin and once through the destination node. 1) The case of G p : In order to generate G p , we will first generate its total-degree sequence, denoted by D. We choose to generate D instead of Dout, i.e., out-degree sequence and Din, i.e., in-degree sequence, because the percentage of real SW schemas that approximate a power-law for the total-degree VR is higher (i.e., 94.8%) than the corresponding percentage for out- (i.e., 58.6%) and in-degrees (i.e., 41.3%). Given the characteristic exponent, we can generate D by using the V RSampling method. Moreover, the strong correlation (see Section IV-B) between the out- and in-degrees of nodes can be used to split D into Din and Dout. 2) The case of G s : To generate the in-degree sequence of G s , we can exploit the fact that the majority (i.e., 60.2%) of schemas approximate a power-law for class descendants CCDF function (see Table V). Given a) the characteristic exponent, b) the depth (denoted by d) of G s , and taking into account that on average the 75% of classes of real SW schemas are leaves (see Table VI), we can generate the in-degree sequence of G s by using the P DF Sampling method. To generate the out-degree sequence of G s , the best choice is the class levels distribution, whose VR function approximates a power-law for 42.1% of schemas (see Section IV-C.3). In this respect, we can generate the out-degree sequence of G s by using the V RSampling method. To this end, we also exploit the finding that the level, denoted by k, at which the maximum number of nodes are located is approximately 3 4 × depth for real SW schemas (see Section V). The number of classes located at other levels decreases as long as the distance of the specific level to level k increases. 8 The (in-/out-/total-) degree sequence of a graph is a sequence comprising the (in-/out-/total-) degree of every node. 9 As mentioned in Section III-A the PDF exponent equals the CCDF exponent plus the unity.
IEEE TRANSACTIONS ON KNOWLEDGE AND DATA ENGINEERING
B. Generating G p , G s given their degree sequences
At this step we assume that the degree sequences of G p , G s are given. We can generate G p , G s by a Linear Programming reduction. In particular, candidate arcs can be expressed as variables and the degree sequences as linear constraints. The arcs transitivity (needed only for G s ) can also be modeled by a set of linear constraints. Since the generation of each graph is a separate process, we need a method to map one node of G s to one and only node of G p . To this end, we exploit the fact that nodes with high out-degree in the G p are located highly in the G s (see Sections IV-D, V). In this manner, we achieve that both two graphs have the same set of nodes. Finally, we should consider attributes i.e., arcs of G p which have as destination Literals (e.g., String, Integer). We add to the set of G p nodes, the Literal types, as specified in XML schema10 . Then we connect them to the pre-existent nodes of G p under the condition that the total-degree sequence of G p remains the same. The percentage of attributes over the total number of properties is given as input. VII. R ELATED W ORK In this section we discuss the contributions of our work with respect to prior research in the field. The results presented in this paper go beyond the statistical analysis presented in [29], which provides only min/avg/max values for depth and size of RDFS class (and property) subsumption hierarchies. Moreover, authors in [27] analyzed the expressiveness of the OWL fragments employed by a large corpus of SW schemas (we employee the same corpus of schemas but analyze only the big ones) and discovered that only few OWL schemas are OWL Full, while most of them are OWL Lite or DL. Furthermore, [9] classified the ontologies of the DAML ontology library11 into three clusters, the taxonomic (i.e., ontologies with few properties and a large number of classes), the logic-style (i.e., ontologies with a high number of axioms per class) and the database-like one (i.e., ontologies of medium size containing on average 65 classes and 25 properties). They observed that the distribution of the DAML restrictions (e.g., property cardinalities) follows a power-law for each of the 3 clusters. They also observed that the class descendants CCDF approximates a power-law (with exponent 2.2) for the taxonomic cluster. However, they did not study the property graph. Moreover, according to the analysis presented in [8], the totaldegree CCDF of the graph obtained by aggregating all ontologies of the DAML library approximates a power-law (with exponent 1.48). However, authors did not distinguish between subsumption and user defined properties, which constitutes a decisive factor for the quality of the analysis method and the interpretation of the presented results. Unlike that study, in our work we treat and analyze the graphs of each SW schema separately (i.e., the graphs obtained from the union of its classes/properties and only those of other schemas that it reuses or/and refines). Additionally, a recent work [30] analyzed the graph structure of two OWL ontologies (one of them is schema 37 while the other is a small one) focusing on measures like the diameter, the density of the graphs as well as on different notions of centrality (i.e., degree, betweenness, eigenvector centrality). They showed 10 http://www.w3.org/XML/Schema
11 www.daml.org/ontologies
9
the usefulness of these measures for the identification of important concepts, of clusters of concepts and of the core conceptual backbone of an ontology. In this study both classes and properties have been considered as graph nodes (i.e., a bipartite graph). In the same direction, [31], [32] address the problem of ontology ranking, which is useful in the case that one should choose one among many ontologies returned by a SW search engine to a user query (e.g., find a schema that defines a class named ”Person”). Specifically, to decide which ontology is better than others, [31] uses various graph measures, such as the number of properties divided by the number of properties and subsumption relationships, the number of attributes divided by the number of classes, the number of instances per class and the ratio of the classes that have instances. Furthermore, as many ontologies may contain a class that matches the user search criteria, [32] tries to estimate to what extent a particular class is representative of the specific ontology. To this end, each class is ranked based on the number of its subclasses, attributes and properties. In addition, the average distance of the shortest paths connecting classes whose label is similar to the search terms is employed. Obviously, [31], [32] do not study the degree distributions of property and subsumption graphs of SW schemas. Summarizing, the metrics proposed in [30], [31], [32] are useful for evaluating and ranking ontologies according to various quality criteria. However, this is out of the scope of our work, since we mainly focus on examining graphs features of real SW schemas that can be exploited to generate synthetic ones. Furthermore, there exist works [10], [11], [12], [7], [13] that study features of the data graphs instantiating schemas rather than the schema graphs themselves. Unlike these works, we are interested in features commonly exhibited by SW schemas. In particular, authors in [10], [11] collected a voluminous set of online FOAF12 documents and analyzed the resulting RDF instance graph. They also observed a power-law for both in- and out-degree distribution, while authors in [12] analyzed a slice of a specific folksonomy and found that the network composed of the tags from the folksonomy follows a power-law degree distribution. Moreover, authors in [13] analyzed subsets of the instance graphs of the Gene Ontology (schema 61) that also exhibit power-law degree distributions. Additionally, authors in [7] focused on aspects such as the provenance, the age and the size of SW documents (i.e., schema instances). They found that the CCDF of instances per class follows a power-law, i.e., few classes are populated by many instances while most classes by few instances or none at all. These results provide a complementary view regarding the significance of classes, i.e., not only (as in our work) determined by the number of properties for which they appear as a domain/range, but also by the corresponding number of instances. However, a study of the involved data graphs is not presented in [7]. VIII. C ONCLUSION To the best of our knowledge, this is the first work that measured and analyzed the graph features of individual schemas coming from an adequately big SW corpus. The main conclusions drawn from our analysis are that the majority of schemas with a significant number of classes and properties approximate a powerlaw for class descendants and property total degree distributions. 12 www.foaf-project.org/
IEEE TRANSACTIONS ON KNOWLEDGE AND DATA ENGINEERING
These findings reveal that there exist few ”focal” classes that form the conceptual backbone of the defined schema, and many ”peripheral” ones that are used to further detail the analysis of the former. When a ”peripheral” class is added to the schema, it is more likely to be related through properties with ”focal” classes rather than with other peripheral ones. Moreover, the ”focal” classes of a schema consist ideal articulation points for interconnection with other schemas, since many properties are located in their neighbourhood (the path between a focal concept and the others is small). Both processes of SW schemas development fit in the definition of preferential attachment [5] (also called the “rich-get-richer” phenomenon), which has been proven to yield power-law degree distributions. We have already started exploiting the findings of this work for synthetic SW data generation [28] as a part of our ongoing RDF benchmarking efforts [33]. ACKNOWLEDGMENT This work was partially supported by the EU Integrated Project on Digital Preservation CASPAR (FP6-2005-IST-033572). R EFERENCES [1] D. Brickley and R. V. Guha, “RDF Vocabulary Description Language 1.0: RDF Schema, W3C Recommendation,” 10 February 2004. [Online]. Available: http://www.w3.org/TR/rdf-schema/ [2] D. L. McGuinness and F. van Harmelen, “OWL Web Ontology Language Overview, W3C Recommendation,” 10 Febrouary 2004. [Online]. Available: http://www.w3.org/TR/owl-features/ [3] M. Faloutsos, P. Faloutsos, and C. Faloutsos, “On power law relationships of the internet topology,” in Procs of ACM SIGCOMM’99, 1999. [4] R. Kumar, P. Raghavan, S. Rajagopalan, and A. Tomkins, “Extracting large scale knowledge bases from the Web,” in Procs of 8th WWW Conference, April 1999. [5] A. Barab´asi and R. Albert, “Emergence of scaling in random networks,” Science, vol. 286, no. 509, 1999. [6] A. A. Nanavati, S. Gurumurthy, G. Das, D. Chakraborty, K. Dasgupta, S. Mukherjea, and A. Joshi, “On the structural properties of massive telecom call graphs: findings and implications,” in Procs of the 15th ACM international conference on Information and knowledge management (CIKM ’06), 2006, pp. 435–444. [7] L. Ding and T. Finin, “Characterizing the Semantic Web on the Web,” in Procs of the 5th International Semantic Web Conference, ISWC’06, Athens, GA, USA, 2006. [8] R. Gil, R. Garc´ıa, and J. Delgado, “Measuring the Semantic Web,” Semantic Web Challenges for Knowledge Management: towards the Knowledge Web, vol. 1, pp. 69–72, July 2004. [9] C. Tempich and R. Volz, “Towards a benchmark for Semantic Web reasoners-an analysis of the DAML ontology library,” in Procs of The 2nd Int. Workshop on Evaluation of Ontology-based Tools, EON2003, 2003. [10] L. Ding, T. Finin, and A. Joshi, “Analyzing Social Networks on the Semantic Web,” IEEE Intelligent Systems, January 2005. [11] H. Halpin, V. Robu, and H. Shepherd, “The dynamics and semantics of collaborative tagging,” in http://www.cwi.nl/themes/sen4/seminar/sen4seminar/bottom.html, 2006. [12] K. Shen and L. Wu, “Folksonomy as a Complex Network,” in Cornell University Library, http://arxiv.org/PS cache/cs/pdf/0509/0509072.pdf. [13] L. Tari, C. Baral, and P. Dasgupta, “Understanding the global properties of functionally-related gene networks using the gene ontology,” Pacific Symposium on Biocomputing, vol. 10, pp. 209–220, 2005. [14] A. Hogan, A. Harth, and S. Decker, “Performing Object Consolidation on the Semantic Web Data Graph,” in Procs of of I3: Identity, Identifiers, Identification Workshop at 16th International World Wide Web Conference (WWW2007), Banff, Canada,, 2007. [15] B. Aleman-Meza, C. Halaschek, A. Sheth, I. Arpinar, and G. Sannapareddy, “SWETO: Large-Scale Semantic Web Test-bed,” in Procs of the 16th International Conference on Software Engineering and Knowledge Engineering (SEKE2004): Workshop on Ontology in Action, Banff, Canada,, June 2004, pp. 490–493.
10
[16] P. Hayes, “RDF Semantics. W3C Recommendation,” 10 February 2004. [Online]. Available: http://www.w3.org/TR/rdf-mt/ [17] G. M. Kuper and J. Sim´eon, “Subsumption for XML types,” in ICDT ’01: Proceedings of the 8th International Conference on Database Theory. London, UK: Springer-Verlag, 2001, pp. 331–345. [18] L. Li, D. Alderson, J. C. Doyle, and W. Willinger, “Towards a theory of scale-free graphs: Definition, properties, and implications,” Internet Math, vol. 2, no. 4, pp. 431–523, 2005. [19] G. K. Zipf, Human Behaviour and the Principle of Least Effort. Massachusetts: Addison-Wesley, 1949. [20] Z. Bi, C. Faloutsos, and F. Korn, “The ”DGX” Distribution for Mining Massive, Skewed Data,” in Procs of the KDD 2001, San Francisco, CA, August 2001. [21] L. A. Adamic, “Zipf, Power-laws, and Pareto a ranking tutorial,” April 2000. [Online]. Available: http://www.hpl.hp.com/research/idl/papers/ranking/ranking.html [22] W. H. Press, S. A. Teukolsky, W. T. Vetterling, and B. P. Flannery, Numerical Recipes in C. Cambridge University Press, 1992, (2nd edition). [23] D. Chakrabarti and C. Faloutsos, “Graph mining: Laws, generators, and algorithms,” ACM Comput. Surv., vol. 38, no. 1, 2006. [24] S. Alexaki, V. Christophides, G. Karvounarakis, D. Plexousakis, and K. Tolle, “The ICS-FORTH RDFSuite: Managing Voluminous RDF Description Bases,” in 2nd International Workshop on the Semantic Web, Hongkong, May 2001. [25] L. Ding, T. Finin, A. Joshi, R. Pan, R. S. Cost, Y. Peng, P. Reddivari, V. C. Doshi, and J. Sachs, “Swoogle: A search and metadataengine for the semantic web,” in Procs of the Thirteenth ACM Conference on Information and Knowledge Management, CIKM’04, Washington, DC, November 2004. [26] Y. Theoharis, “On Power Laws and the Semantic Web,” Master’s thesis, Computer Science Department, University of Crete, February 2007. [Online]. Available: athena.ics.forth.gr:9090/RDF/publications/MasterThesisTheohari.pdf [27] T. D. Wang, “Gauging ontologies and schemas by numbers,” in Procs of the 4th International EON Workshop, located at the 15th International World Wide Web Conference WWW 2006, Edinburgh, United Kingdom, 2006. [28] Y. Theoharis, G. Georgakopoulos, and V. Christophides, “On the Synthetic Generation of Semantic Web Schemas,” in Procs of the Joint ODBIS & SWDB Workshop on Semantic Web, Ontologies, Databases. Colocated with VLDB2007, September 2007. [29] A. Magkanaraki, S. Alexaki, V. Christophides, and D. Plexousakis, “Benchmarking RDF schemata for the Semantic Web,” in Procs of the 1st International Semantic Web Conference, ISWC’02, 2002. [30] B. Hoser, A. Hotho, R. J¨ aschke, C. Schmitz, and G. Stumme, “Semantic network analysis of ontologies,” in Procs of the 3rd European Semantic Web Conference, Budva, Montenegro, 2006. [31] H. Alani and C. Brewster, “Ontology ranking based on the analysis of concept structures,” in Procs of the 3rd international Conference on Knowledge Capture, Banff, Canada,, October 2005. [32] S. Tartir, I. B. Arpinar, M. Moore, A. P. Sheth, and B. AlemanMeza, “OntoQA: Metric-Based Ontology Quality Analysis,” in Procs of IEEE ICDM 2005 Workshop on KnowledgeAcquisition from Distributed, Autonomous, Semantically Heterogeneous Data and Knowledge Sources, 2005. [33] Y. Theoharis, V. Christophides, and G. Karvounarakis, “Benchmarking Database Representations of RDF/S Stores,” in Procs of the 4th International Semantic Web Conference, ISWC’05, 2005.
IEEE TRANSACTIONS ON KNOWLEDGE AND DATA ENGINEERING
Yannis Theoharis is currently a research assistant - R&D Engineer at the Information Systems and Software Technology Laboratory of the Institute of Computer Science, Foundation for Research and Technology-Hellas (FORTH-ICS). He has received his B.Sc. (2005) and M.Sc. (2007) from the Computer Science Department at University of Crete. Currently he is also an undergraduate student of the Mathematics Department at University of Crete. His research interests include Database Systems and Theory, Information Retrieval Systems and Web Data Management. During his studies he also concentrated on Database Technologies for the Semantic Web, Graph Mining & Algorithms and Optimization Theory. Results of his research have been published in 6 papers in various refereed journals, conferences and workshops.
Yannis Tzitzikas is currently an Assistant Professor in the Computer Science Dep. at University of Crete (Greece) and Associate Researcher in Information Systems Lab at FORTH-ICS (Greece). Before joining UofCrete and FORTH-ICS he was postdoctoral fellow at the University of Namur (Belgium) and ERCIM postdoctoral fellow at ISTI-CNR (Pisa, Italy) and at VTT Technical Research Centre of Finland. He conducted his undergraduate and graduate studies (MSc, PhD) in the Computer Science Department at University of Crete. In parallel, he was a member of the Information Systems Lab of FORTH-ICS for about 8 years, where he conducted basic and applied research around semantic-networkbased information systems within several EU-founded research projects. His research interests fall in the intersection of the following areas: Information Systems, Information Indexing and Retrieval, Conceptual Modeling, Knowledge Representation and Reasoning, and Collaborative Distributed Applications. His current research revolves around faceted metadata and semantics (theory and applications), the P2P paradigm (focusing on conceptual modelling issues, query evaluation algorithms and automatic schema integration techniques), and flexible interaction schemes for information bases. Currently he is also interested in digital preservation (theory, methodologies, technologies) and on extending and applying Semantic Web technologies. The results of his research have been published in more than 45 papers in refereed international conferences and journals, and he has received two best paper awards (at CIA2003 and ISWC07).
Dimitris Kotzinos is an Assistant Professor at the Department of Geomatics and Surveying at the TEI of Serres and an affiliated researcher at the Information Systems and Software Technology Laboratory of the Institute of Computer Science, Foundation for Research and Technology-Hellas (FORTH-ICS). He holds a Ph.D. on the topic of ”Application of digital map technologies on developing internet based Advanced Traveler Information Systems (ATIS)” from the Department of Production and Management, Technical University of Crete, Greece (2001) and a M.Sc. in Transportation, from the Civil Engineering Department, OhioState University, Columbus, USA (1996). His B.S. is in Computer Science, Department of Computer Science, University of Crete, Greece. (1994). His main research interests include development of methodologies, algorithms and tools for web based information systems, portals and web services. Especially applications of the above in the fields of: E-learning, Geographic Information Portals, real-time Advanced Traveler Information Systems (A.T.I.S.). He has published over 25 papers in various journals, conferences and workshops and serves as a program committee member and reviewer for various conferences and journals.
11
Vassilis Christophides studied Electrical engineering at the National Technical University of Athens (NTUA), Greece. He received his DEA in computer science from the University PARIS VI and his Ph.D. from the Conservatoire National des Arts et Metiers (CNAM) of Paris, France. He is an Associate Professor at the Department of Computer Science, University of Crete, and affiliated researcher at the Information Systems and Software Technology Laboratory of the Institute of Computer Science Foundation for Research and Technology-Hellas (FORTH-ICS). His main research interests include Semantic Web and Peer-to-Peer information management systems, semistructured and XML/RDF data models and query languages as well as description and composition languages for e-services. He has published over 60 articles in international conferences and journals and has served on numerous conferences program committees (ACM SIGMOD, VLDB, EDBT, WWW, ISWC, ICWE, ICWS, ECDL). He has received the 2004 SIGMOD Test of Time Award and the Best Paper Award at the 2nd and 6th International Semantic Web Conference in 2003 and 2007.