Rafi, A., Samsudin, K. A., & Ismail, A. (2006). On Improving Spatial Ability Through Computer-Mediated Engineering Drawing Instruction. Educational Technology & Society, 9 (3), 149-159.
On Improving Spatial Ability Through Computer-Mediated Engineering Drawing Instruction Ahmad Rafi Faculty of Creative Multimedia, Multimedia University, Cyberjaya, 63100 Selangor, Malaysia Tel: +603-8312 5555 Fax: +603-8312 5554
[email protected]
Khairul Anuar Samsudin and Azniah Ismail Fakulti Teknologi dan Komunikasi, Universiti Pendidikan Sultan Idris, Tanjung Malim, 35900 Perak, Malaysia Tel: +605-450 5021/5041/5050 Fax: +605-458 2615
[email protected] [email protected] ABSTRACT This study investigates the effectiveness of computer-mediated Engineering Drawing instruction in improving spatial ability namely spatial visualisation and mental rotation. A multi factorial quasi experimental design study was employed involving a cohort of 138, 20 year old average undergraduates. Three interventional treatments were administered, namely Interactive Engineering Drawing Trainer (EDwgT), conventional instruction using printed materials enhanced with digital video clips, and conventional instruction using printed materials only. Using an experimental 3 x 2 x 2 factorial design, the research has found statistical significant improvements in spatial visualisation tasks. There appears to be no improvement in reaction times for Mental Rotation. The authors also have investigated the gender differences and the influence of prior experience of spatial ability.
Keywords Spatial ability, Spatial visualisation, Mental rotation, Computer-mediated Engineering Drawing
Introduction on spatial ability Spatial ability is widely perceived by the scientific fraternity to be a vital trait in human intelligence. This involves a cognitive process through the brain’s attempts to perceive and interpret certain types of incoming information namely the visual and spatial information. A simple comprehension of this visual-spatial information is one’s ability to remember how to move around in a house. This skill becomes evident when individuals are engaged in activities rich in visual and spatial content such as Engineering, Science, Architecture and Technology. Though deemed vital, the emphasis to train and practice in spatial skills seldom receives the desired attention where historically other forms of intelligence in particular mathematical ability have been given more emphasis albeit recent evidence that suggests a similar importance of humans mental capabilities of the former. According to Smith (1964), many assumptions of spatial ability tests were prone to practical and mechanical abilities that are useful in predicting success in technical fields, but not as measures of abstract reasoning abilities. Several definitions has been proposed, all having different nomenclatures but in essence they indicate this ability to be a non-unitary construct of human intelligence deemed very important in life. Mayer and Sims (1994) explained spatial ability as the ability to rotate or fold objects in two or three dimensions and to imagine the changing configurations. According to Sternberg (1990), one’s spatial ability pertains with the visualisation of shapes, rotation of objects, and how pieces of a puzzle would fit together. Likewise, Linn and Petersen (1985) indicated the skills in representing, transforming, generating and recalling symbolic and nonlinguistic information are asscociated with this ability. Spatial ability is also viewed to be multi faceted comprising several sub skills. Meta-analysis of studies made between 1974 and 1982 by Linn and Petersen (1985) suggested spatial ability to be composed of three distinct components namely spatial visualisation, spatial perception and mental rotation.
Factors influencing the development of spatial ability Factors influencing the development of spatial ability have been identified in several psychological studies such as gender, age and spatial-related experience (Miller, 1996). Results of the meta-analysis (Linn & Petersen, ISSN 1436-4522 (online) and 1176-3647 (print). © International Forum of Educational Technology & Society (IFETS). The authors and the forum jointly retain the copyright of the articles. Permission to make digital or hard copies of part or all of this work for personal or classroom use is granted without fee provided that copies are not made or distributed for profit or commercial advantage and that copies bear the full citation on the first page. Copyrights for components of this work owned by others than IFETS must be honoured. Abstracting with credit is permitted. To copy otherwise, to republish, to post on servers, or to redistribute to lists, requires prior specific permission and/or a fee. Request permissions from the editors at
[email protected].
149
1985; Voyer et al.,1995) show that gender differences in favor of males in spatial abilities exist. The magnitude of these gender differences are slight, moderate and pronounced in spatial visualisation, spatial perception and mental rotation respectively. Men are arguably faster at the second stage of the mental rotation operation comprising sequential stages; perceiving, rotating, and comparing where women are relatively slower at this stage (Kail et al., 1979; Petrusic et al.,1978) contributing to this disparity. Explanations from biological and nonbiological perspectives namely socio-cultural factors have expatiated women’s relative lower performance in spatial tasks. Several theories such as male cerebral lateralisation (Gur et al., 2000; Vogel et al., 2003), sex hormone (Hier & Crowley, 1982), and x-linked genetic theory (Harris, 1978) explicate the cause of gender differences from biological perspective. Gender differences in spatial aptitude may be caused by several socio-cultural factors such as gender-typed socialisation. Children’s conception of how to behave is shaped by the gender-linked beliefs about them resulted from their parental notions on gender-related abilities (Swim, 1996). Girls are inadvertently not encouraged to pursue an interest in masculine domains which are heavily loaded with spatial reasoning aspects. Females may also underestimate their potentials in spatial domains due to their parental beliefs that affect their self-perception of capability (Fouad & Smith, 1996). Male children have more opportunities to engage in spatial activities at an early age through gender-biased activities that promote spatial skills development (Baenniger & Newcombe,1989). The situation is exacerbated by girls’ lack of practice that engenders low motivation where engagement in spatial tasks will be discouraged or the likelihood of failure will increase (Stericker & LeVesconte, 1982). Age related differences in spatial ability were investigated by Piaget and Inhelder (1971) suggesting that an individual’s cognitive development determines the potential of what one could achieve. At the initial stage a child exhibits a purely egocentric view of the world that continues to the second stage. A child develops spatial thoughts independent of images but still requires the actual presence of the object being manipulated at the third stage in the range of 7 to 12 years old. This stage of development concurs with Ben-Chaim’s et. al (1989) proposition that the optimal age for acquiring spatial skills through instruction is between 11 and 12 years old. The capability of exploring mental manipulation involving infinite spatial possibilities and complex mathematical concepts is attainable at the formal operational stage from the age of 13 years old onwards. The maximum potential is reached at the age of 17 implying that students in high schools or post secondary education are formal operational thinkers. Individuals’ spatial ability seems to reach maturation stage at adolescence and will gradually decline in the late twenties in the general populations due to aging effects even among individuals who are using these abilities in their profession (Salthouse et. al, 1990). Prior to Maccoby’s and Jacklin’s (1974) study there were many hypotheses debating whether spatial ability was inherited or learned behavior. Findings of some research after this time provide evidence that spatial skills can be taught (Alington et al., 1992; Bishop, 1989; Petrusic et al., 1978). In 1987, the National Council of Teachers of Mathematics recommended that an individual must have experienced with geometric properties and relationships to help develop this ability. The extent of improvement and level of performance gain for both sexes are very important considerations in studies dealing with spatial skills training. Practice effects have also been detected in previous research for spatial training both for general and specific skills. Empirical evidence shows females through practice improved at a significantly higher rate because according to Baenniger and Newcombe (1989) men might be operating closer to their maximum potential. On the other hand, Sorby’s (1999) study suggests that there is significant room for improvement of spatial skill for both men and women depending on the difficulty of the task. Of late, various instructional interventional programs using computer and multimedia technologies have been carried out (Ahmad Rafi et al., 2005; Khairul & Azniah, 2004; Lehmann, 2000; Turos & Ervin; 2000) to address spatial skills acquisition and its corresponding impact for both genders reveal promising results.
Purpose of Study Spatial skills such as spatial visualisation and mental rotation are important abilities in tertiary education involving studies which are highly involved with spatial and visual understanding especially in Engineering, Computer Graphics, Architectural and other scientific courses. Investigation on developing these cognitive skills among undergraduates is vital to assist students lacking these abilities. The effectiveness of training using different instructional methods will suggest educators on utilising appropriate approaches that maximise the training impact. Demographic factors such as gender and spatial experience also contributes to the overall training outcomes. Considering these points, three research questions were formulated to articulate the research study as follows: 150
a)
Will learner’s spatial visualisation and mental rotation abilities improve after performing Engineering Drawing tasks? b) Are there substantial differences in improvement attributed to methods of instruction used for Engineering Drawing tasks? c) Do demographic factors such as gender and spatial experience substantially influence training outcomes?
In this study, three experimental conditions involving Engineering Drawing exercises were administered namely the computer-mediated Interactive Engineering Drawing Trainer (EDwgT), conventional instruction using printed materials enhanced with digital video clips, and conventional instruction using printed materials. Conventional instructional method was operationalised as learning strategy that employs similar training materials of Engineering Drawing using printed materials with tutor supervision. Several predictions were made in order to answer the research questions with regard to spatial skills improvement, effectiveness of training methods and the influence of demographic factor on training outcomes. These are: a) learners’ performance gain in spatial ability measures namely spatial visualisation, mental rotation accuracy and mental rotation speed will be significant in the computer-mediated EDwgT followed by video-enhanced conventional instruction, and finally conventional instruction, b) male learners will achieve greater performance gain in the spatial ability measures than female learners, c) high spatial experience learners will achieve greater performance gain than low spatial experience learners.
Methods Participants A cohort of one hundred and thirty eight (138) undergraduate students with an average age of 20 participated in the experiment involving equal numbers of females and males. The sample was drawn from an intact class of Computer-Aided Design course involving students majoring in Information Technology and Communication (ITC), Universiti Pendidikan Sultan Idris, Malaysia. A convenience sampling was used and the participants were randomly assigned to three treatment groups forming two experimental groups and one control group. The treatments for the two experimental conditions were computer-mediated instruction and video-enhanced conventional instruction. The control group only received conventional instructions. All participants were given course credits for their participation. Instructional Materials and Apparatus The EDwgT was carried out by each participant on a personal computer with a pre-installed multimedia program freely downloaded from the Visualisation and Spatial Reasoning website (Blasko & Holiday-Darr, 2000). It was developed to replicate typical Engineering Drawing tasks comprising of multi 2D orthographic views together with isometric representations. This program allowed the user to learn the fundamentals of constructing the orthographic projections from an isometric view. Several utility buttons were also embedded in the interface for user guidance while exploring the problem solving activities. Individual differences in spatial visualisation and mental rotation were measured respectively using the Spatial Visualisation Test (Middle Grades Mathematics Project, 1983) and an online mental rotation test developed by Chay (2000) based on the Vandenberg and Kuse (1978) respectively. The categorisation of participants into high and low spatial experience levels was adopted from Spatial Experience Questionnaire (SEQ) designed by McDaniel et. al. (1978). The first instrument comprises 32 multiple-choice items with five response choices for each item. Items consisted of views having one, two and three dimensional figures shown in line drawings to be completed within 25 to 35 minutes. The second instrument, the electronic test version comprises 30 evaluation items each composed of a target and comparison figure positioned at various degrees of orientation. Scoring involved assigning one point for a correct response and all questions were randomly presented to avoid order effect.
151
Procedure This study employed a factorial pre-test post-test quasi experimental (3 x 2 x 2) design protocol comprising three independent variables namely treatment group (3 levels: experimental 1, experimental 2 and control), gender (2 levels: females and males) and prior spatial experience (2 levels: high and low). The dependent variables in the study were mean scores of the spatial visualisation and mental rotation tests that served as both pre-test and posttest measures. The SEQ is a 25-item self-reported questionnaire consisting of a list of spatial activities such as drawing, map reading, and playing chess. Each item has a four-point scale ranging from two extremes (i.e. very often and never) to be rated by participants on the experiment. The two levels of spatial experience were categorised based on the total scores of the questionnaire such that low experience was 42 and below, and high experience was 43 and above. For the mental rotation test all participants were explicitly explained that their performance in the spatial test depend on both accuracy and speed factors in which they were allowed three minutes to complete the test. Practice session on two to three items in the online mental rotation test was instructed prior to pre-testing measurements to allow participants to familiarise with the interactive instructions and interfaces. Data containing number of correct attempts and response times in seconds were automatically generated and retrieved for analysis in statistical program. The spatial visualisation test was developed with manual instruction in which students were given 25 to 30 minutes to complete the tasks. During the intervention, training in EDwgT to improve performance in spatial tasks was applied to the first experimental group in the computer lab.
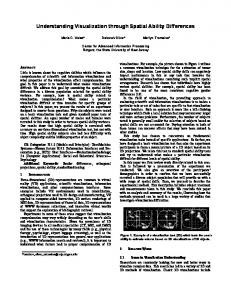
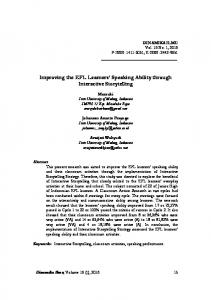
Figure 1: The Interactive Engineering Drawing Trainer (EDwgT) window The second experimental group received similar instructional materials in printed form augmented with video materials. The digital video clips were produced using the screen motion capture software, Techsmitch’s Camtasia Studio Two to record screen activities into avi files. Participants were advised to use the clips to assist problem solving issues.
Figure 2: A snapshot of a video clip launched by users 152
The control group only received printed instructional materials consisting Engineering Drawing exercises scheduled in five sessions, two hours per week for five weeks duration. All groups received the same training materials, time allocation and time of day of training to avoid external threats confounding the treatment. This ensures any differences in performance after treatment were solely attributed to the effectiveness of the instructional approaches used. The authors were the facilitators throughout the training sessions providing guidelines and directions to ensure participants could follow the treatment programs with ease. Post-test was administered on the fifth week utilising the same tests used in the pre-testing stage to reveal any performance gain resulting from the spatial training. The five-week gap between pre-testing and post-testing will ensure that any improvement detected is not attributed to test re-test effect but is due to the intended effect of spatial training.
Data Analysis It is important to ensure that the groups were statistically equivalent prior to treatments. Three independentsample t-tests for each pre-test of the spatial ability revealed no significant group differences at p> 0.05. Similar tests conducted to detect diferences due to gender and spatial experience showed all the groups were statistically equivalent except for spatial visualisation pre-test measure indicating high spatial experience participants were more accurate than the low spatial experience counterparts. The absence of gender differences for both measures of spatial ability especially in mental rotation were most surprising as most literature reported otherwise. Table 1 summarises the means and standard deviations of the pre-test and post-test measurements. Table 1: Means and standard deviations for the spatial ability measures Mental Rotation Spatial Visualisation Conditions (max 30) Reaction time (secs) (max 32) Pre Post Pre Post Pre Post Experimental 1 Females High exp. 13.70 19.40 24.00 27.10 124.88 100.67 (4.69) (2.63) (2.71) (1.20) (42.81) (32.38) Low exp. 12.46 16.15 19.77 22.54 118.43 126.90 (2.66) (2.64) (1.79) (2.50) (40.51) (32.00) Males High exp. 15.60 20.10 24.60 27.00 113.31 94.70 (4.03) (3.96) (2.37) (1.25) (25.68) (24.41) Low exp. 14.23 19.15 19.92 22.15 113.98 119.46 (3.92) (3.83) (1.15) (2.11) (42.27) (32.70) Total 13.91 18.57 21.78 24.39 119.10 97.68 (Females+Males) (3.86) (3.57) (2.97) (3.01) (34.87) (28.08) Experimental 2 Females High exp. 14.00 17.88 22.13 24.00 142.32 119.56 (4.04) (2.75) (2.36) (2.92) (34.06) (30.16) Low exp. 12.93 15.07 21.07 22.67 124.58 117.87 (2.63) (2.02) (3.56) (3.41) (38.07) (31.90) Males High exp. 15.67 20.00 22.11 24.11 115.80 105.58 (4.00) (2.87) (3.62) (3.57) (39.86) (43.79) Low exp 13.36 17.50 20.00 23.14 137.96 129.61 (3.43) (2.07) (3.68) (3.61) (39.53) (28.43) Total 13.78 17.26 21.13 23.33 130.03 119.34 (Females+Males) (3.46) (2.89) (3.44) (3.37) (38.24) (33.23) Control Females
High exp. Low exp.
Males
High exp. Low exp.
14.83 (4.31) 12.82 (2.74)
18.67 (2.07) 14.59 (3.02)
19.83 (3.54) 19.82 (3.50)
21.00 (3.80) 22.35 (3.32)
138.52 (29.80) 141.85 (38.21)
117.97 (27.36) 127.74 (36.85)
15.70 (3.77) 14.31 (3.17)
18.00 (4.11) 16.92 (2.81)
19.60 (3.37) 20.69 (3.04)
21.80 (3.68) 21.85 (3.58)
137.79 (40.33) 150.28 (24.25)
124.29 (40.83) 131.92 (25.32) 153
Total (Females+Males)
14.13 (3.40)
16.52 (3.43)
20.02 (3.27)
21.91 (3.44)
142.92 (33.54)
126.90 (33.02)
Spatial Visualisation Three-way interaction between method of instructions, gender and level of spatial experience was not found to be significant, F(2,126) = 0.58, p = .56 by the analysis of variance performed. Similarly, no three-way interactions among the three independent variables were found to be signififant. The main effect for method of instructions was significant, F(2,126) = 3.47, p = .03, showing better performances for participants receiving training in EDwgT compared to the other two methods. Gender factor produced significant main effect, F(1,126) = 9.91, p = .002 indicating males to be more accurate in spatial visualisation tasks than their female counterparts. A highly significant main effect of spatial experience was detected, F(1,126) = 21.60, p = .0005 revealing better spatial visualisation performance for high spatial experience participants compared to their low spatial experience counterparts. Table 2 summarises the results of the main effects and interactions for spatial visualisation post-test. Table 2: ANOVA for the Spatial Visualisation Test df Sum of Squares Mean Square Method 2 60.96 30.48 Gender 1 87.16 87.16 Spatial Experience 1 190.01 190.01 Method x Gender 2 11.28 5.64 Method x Spatial Experience 2 2.01 1.01 Gender x Spatial Experience 1 27.84 27.84 Method x Gender x Spatial 2 10.22 5.11 Experience Error 126 1108.37 8.80 *p