Proceedings of the 7th WSEAS International Conference on Power Systems, Beijing, China, September 15-17, 2007
282
On-Line Measurement of Power Quality Parameters Using Signal Processing Techniques SURAJ D PARDESHI, M RAMAMOOORTY, R.B.KELKAR1 Power Electronics and Instrumentation Cell Electrical Research and Development Association Makarpura Industrial; Estate, Vadodara-390010 1 Department of Electrical Engg. M.S.Univ Vadodara-390 001 INDIA http://www.erda.org
[email protected]
Abstract: This paper presents a new signal processing techniques for real time measurement of various power quality parameters. Signal processing techniques are applied for real time measurement of power quality parameters such as frequency, harmonics, flicker and disturbances. The paper covers the limitation existing in the presently used methods and the possible remedies by the use of these algorithms. This paper describes the mathematical model used in each algorithm its simulation on MATLAB and deployment of these techniques on a multiprocessor hardware using Digital Signal Processor (DSP) TMS320F2806. Simulation and experimental results confirm the validity of the proposed signal processing techniques for on line measurement of power quality parameters. Keywords: Digital Filters, Kalman, Harmonics, Flicker, IEC61850, Power quality.
1. INTRODUCTION In recent years, both industrial and commercial customers of electrical utilities have reported a rising incidence of misadventures related to power quality. A power quality problem can best be described as any variation in the electrical power service, such as voltage dips and fluctuations, momentary interruptions, harmonics, df/dt and transients, resulting in mis-operation or failure of end-use equipment. The afore mentioned disturbances, degrading the reliability and quality of the power supply, though always existed on utility systems, are, nowadays, causing more and more troubles. This is due to increased refinement of today’s automated equipment, such as variable-speed drives or robots, automated production lines or machine tools, programmable logic controllers or power supplies in computers. They are far more vulnerable to disturbances on the utility system than previous generation electro mechanical equipments and previous less automated production and information systems.
For these reasons the need of electrical power quality monitoring and analysis for both customers and electrical utilities is strongly increasing [1] Power quality monitoring and analysis must be able to detect, localize, estimate and classify disturbances on the supply line. The algorithms use to perform these tasks must be able to operate in sinusoidal and non-sinusoidal conditions. Also the signal processing techniques should be capable for on-line tracking, measurement and classification of the power quality parameters. The signal processing techniques applied must be fast, accurate and able to be deployed on a hardware platform. The paper describes four new signal processing techniques applied for real time measurement its simulation and deployment of these techniques on multiprocessor hardware platform. (1) Digital filtering technique applied for frequency measurement under sinusoidal and non-sinusoidal conditions. (2) Kalman filter technique applied for on line tracking of power system harmonics. (3) Fast Fourier Transform and statistical method applied for real time detection of flicker. (4) Multi-resolution signal decomposition techniques based on wavelet transform for on line detection, localization and classify disturbances such as sag, swell and transients in power systems. The reason for implementing different technique for different parameters is that each parameter in power system is dynamic and has different resolution in terms of frequency and amplitude. Implementing a single technique for all the parameters result in loss of valuable information. So the technique which provides the maximum benefit for a particular parameter is selected for measurement purpose.
Proceedings of the 7th WSEAS International Conference on Power Systems, Beijing, China, September 15-17, 2007
2. MEASUREMENT SYSTEM ARCHITECTURE AND SIMULATION All the four signal processing techniques are described one by one here in details. 2.1 FREQUENCY MEASUREMENT. In many power system protection and control schemes it is necessary to accurately measure and track the fundamental power frequency under sinusoidal and non-sinusoidal conditions. There are various methods proposed for frequency measurement which include zero crossing methods, FFT leakage, stationary phasor phase changes and least squares fitting. The proposed algorithm [3] is a modified version of Sezi' method [2]. This algorithm uses phase angle and amplitude information in order to compute frequency.
283
same way as the A-filter. Both the low pass and all pass are FIR filters and are designed using equation 4. y(k) = aox(k) + a1 x(k − 1 ) + .. + aMx(k − M)
(4)
The outputs of filter A and L pass through an IIR (Infinite Impulse Response) filter. The IIR filter provide X L and X A as the signal amplitude corresponding to the input from L-filter and A-filter. The divide block computes the quotient of the signals X L and X A . This ratio corresponds to the known ratio of the frequency-dependent amplification factors of the filters L(Ω) and A(Ω) . XL = [1 + cos(5Ω)] (5) XA After the divide block the frequency calculation block performs a root squared of the divider output and then performs the inverse of the cosine function to calculate the value of Ω . X 1 Ω = arccos L − 1 5 X A
(6)
The output of the frequency calculation block is the actual line frequency given by equation 7.
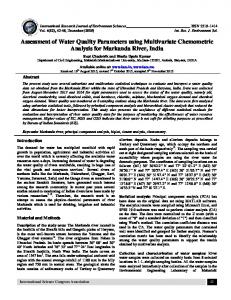
Fig 1. Block diagram of freq measurement for three phases
f =
fsΩ 2π
(7)
Where fs is the sampling frequency.
The three phase voltage signals is sampled and Vα and Vβ are calculated using Eq. 1 and 2 From Vα and Vβ the reference voltage is calculated using Eq 3. The reason for calculating the reference voltage is that even if one of phase is not present than also the system is able to compute line frequency. Vα = 0.816 ∗ Va − 0.41 ∗ Vb − 0.41 ∗ Vc Vβ = 0.707 ∗ Vb − 0.707 ∗ Vc
V =
(V
α
2
+ Vβ 2
)
(3)
( 2)
(1)
V Φ = tan −1 β Vα
Where Va , Vb and Vc are the three phase voltages. As shown in Fig 1 the sample data x[n] of the reference voltage V is first filtered by a band pass FIR (Finite Impulse Response) filter with the pass band frequency range from 30 to 100 Hz. The band pass filter is a two-cycle FIR Fourier filter with rectangular window. The output of the band passfilter is connected to two other filters. One of them is an all pass-filter (A-filter), which changes the phase angle, but not the amplitude, of the signal. The other filter is a low-pass filter (L-filter) that changes the amplitude of the signal, while changing the phase angle of the signal in exactly the
The main advantage of this method is that it avoids waiting between zero crossings of the input signal and hence can compute faster as compared to other methods.
2.1.1
SIMULATION RESULTS
The method has been tested under various conditions using the simulation software MATLAB. The time needed to reach the steady state is over three cycles but can be reduced if filter with shorter order are used.
a) CASE-I The proposed method is tested under various harmonic conditions. The harmonic content in the fundamental voltage is varied from 1% to 50% of the fundamental voltage. Fig. 2 shows the plot of the error v/s harmonic content added to the fundamental.
Fig 2: Error with various harmonic content
Proceedings of the 7th WSEAS International Conference on Power Systems, Beijing, China, September 15-17, 2007
b) CASE -II
The method is also tested for signals with multiple zero crossing. The test signal is as shown in fig 3. The method shows no abnormalities under multiple zero crossing conditions. The result is shown in fig 4.
2.2.2
284
MODELLING OF THE KALMAN FILTER
As shown in the figure 5 the kalman filter block is modeled for estimation and on line tracking of harmonic upto 25th order.
Fig 3. Signal with multiple zero crossing. Fig 5: Kalman model for tracking harmonics and phase angle
Fig 4: Error with multiple zero crossing Simulation results concludes that the maximum error of this model is less that 0.005% under non-sinusoidal and multiple zero crossing conditions.
2.2
The model is tested initially for the sudden change in the amplitude of the fundamental voltage. As shown in the figure the kalman filter is able to track the change the sudden change in the magnitude of the fundamental component within half a cycle as shown in Fig 6
HARMONICS MEASUREMENT
Due to increased utilization of power electronics devices voltage and current waveforms of a distribution or a transmission system are not pure sinusoids but consist of a combination of the fundamental frequency, harmonics and high frequency transients. Furthermore, many of industrial loads are dynamic in nature. This produces time-varying amplitude for the current waveforms. The DFT and FFT transform is a useful analytical tool that has been applied to power system for phasor measurement and harmonic analysis. But DFT suffer from a major drawback that it cannot accurately track the harmonic online also it is necessary that the sampling frequency used in the DFT should be equal to the number of samples multiplied by the fundamental frequency of the signal.
Fig 6: Voltage signal with voltage dip and kalman filter and actual output signal. Also the model is tested for various order of harmonic (3rd, 5th, 7th, 9th, 11th, 13th) and the performance and accuracy of the kalman filter is verified. The waveform consists of the fundamental, the third, the fifth, the ninth eleventh and the thirteenth harmonics as shown in Fig 7.
Kalman filtering is a power tool for on line tracking of amplitudes and phase of power system harmonics [ 4]. A mathematical model [5] of the signals in state variable form is implemented including all the possible spectral components which may be associated with the signal to be analyzed.
Fig 7: Estimated magnitudes of Harmonic components Simulation results conclude that the model is able to track various harmonics on-line.
Proceedings of the 7th WSEAS International Conference on Power Systems, Beijing, China, September 15-17, 2007
2.3
FLICKER MEASUREMENT
Flicker is basically caused by fluctuations of the electrical power network that may occur at any time under the influence of the variations of any of the three components of the network: the load, which is switched on and off according to specific operational needs. Each of these elements produces a contribution to voltage variations that in turn can produce light flicker. Voltage fluctuations up to 30 Hz may produce annoyance even if considering small relative amplitudes such as 0.25% at the critical modulation frequency of 8.8Hz IEC 61000-4-15 [7] mentions the limits for flicker measurement and the design of analog flicker meter. The paper proposed the use of FFT and new statistical block for real time measurement of flicker in power system.
285
Px = P0.1, P1, P3, P10, P30. Record length = 0.6, 6, 18, 60, 300 sec. After computing the value of Px for various frequencies these values are stored in various variables. The flicker magnitude calculated by the various FFT windows are compared with the available reference values as mentioned in the [1]. If the flicker magnitudes of the various frequencies calculated from the various FFT block exceeded the reference values mentioned in [1]. Then the Px value for that particular frequency is taken otherwise the Px value is zero. In this way P0.1, P1, P3, P10 and P50 is calculated. Using these values the magnitude of Pst is calculated using equation 23 which indicates the measure of severity.
PST = 0.1* 3.14* P0.1 + 5.25*P1 + 6.57* P3 + 28* P10 + 8* P30
(8) 2.3.1
SIMULATION RESULTS
The simulation is carried out in MATLAB for flicker measurement. As shown in the fig 8 the voltage signal consist of a fundamental component and interharmonic frequency of 8.8Hz. The software performs the FFT calculation for various windows such as as shown in fig 8:
Fig: 8 FFT windows at various record lengths The FFT algorithm computes the magnitude of various flicker frequencies present in each window at various resolution levels as mentioned in [7]. After computing the flicker magnitude by FFT algorithm in each window the flicker magnitude is then given to the statistical block. The statistical block mentioned in this paper is unique and it differs from the IEC [7] in such a way that it calculates the Px values, which indicates the measure of severity of a particular flicker frequency for a particular period. The algorithm uses this technique to determining the number of time the flicker frequencies has repeated in a given record length. Px = Record length / flicker frequency. Where
2.4
WAVELET BASED SIGNAL DECOMPOSITION TECHNIQUE
To improve the electric power quality, sources of disturbances must be known and controlled. This can be done by first detection, localization of events. To achieve this on line real time evaluation device is necessary. A feasible approach to achieve this goal is to use a powerful tool that has the ability to analysis difference power quality problems simultaneously in both time and frequency domain. Wavelet transform can satisfy this type of analysis. In this paper, multiresolution signal decomposition technique is used to detect the occurrence of the event, classification of the event is done by calculating the energy of the distorted signal. In Multiresolution analysis (MRA), wavelet functions and scaling functions are used as building blocks to decompose and construct the signal at different resolution level. The wavelet function will generate the detail version of the decomposed signal and the scaling function will generate the approximated version of the decomposed signal. This mathematically model can be found in [8]: Multiresolution decomposition is used to achieve two important properties. The first is the localization property in time for any transient phenomena. This will appear by the presence of large coefficients at the time of disturbance. The second property of the partitioning of the signal energy at different frequency bands. This
Proceedings of the 7th WSEAS International Conference on Power Systems, Beijing, China, September 15-17, 2007
286
gives an idea of the frequency content of the distorted signal.
Case-c: Transients
The two mentioned properties are shown in fig 9. This fig shows four level MRA of a distorted signal with sag disturbance. Using scaled and translated version of the wavelet and scaling functions, the distorted signal is decomposed to four detailed version and one approximated. d1, d2, d3 and d4 represent the detailed version of the coefficients and a4 represent the approximated version of the coefficients
The program was also tested for capturing transients. As shown in fig 12 the detail coefficient was also able to capture transient event.
Fig 12: Voltage signal with transient and detail coeff d1
Fig 9. Four level decomposition of the signal
Using the MRA technique the software was developed to detect the occurrence and duration of the disturbance event. For classification of the event Parseval theorem is used [8]. The energy of the distorted signal and the energy of a non-distorted signal are calculated. In normal conditions the difference of energy distribution is zero. Depending on the difference in the energy distribution the sag, swell and transients events are classified.
The detection and localization of the types of power quality disturbances are generally influenced by the choice of analyzing wavelets. Daub4 wavelets are better suited for short as well as fast transient disturbances and hence are selected for simulation as the mother wavelet.
Case-a: Voltage Sag As shown in fig 10 the program was tested for sag disturbances. Using the detail coefficients it is possible to estimate the exact time of occurrence of the event and the duration of the event.
3. HARDWARE PLATFORM The proposed block-diagram of the multiprocessor signal architecture is as shown in Fig 13. The multiprocessor platform using digital signal processor (DSP) (TMS320F2806). The DSP has internal 12-bit ADC with maximum sampling frequency of 12.5MSPS. POWER SUPPLY +5V AND +3.3V
R-PHASE P.T(240V/1 V) C.T(40/1 A) Y-PHASE P.T(240V/1 V) C.T(40/1 A) B-PHASE P.T(240V/1 V) C.T(40/1 A)
FLASH MEMORY PROGRAM/DATA 12-Bit Analog to Digital Converter
TMS320F 2806 CORECPU
FLASH MEMORY PROGRAM/DATA 12-Bit Analog to Digital Converter
TMS320F 2806 CORECPU
CAN-BUS
FLASH MEMORY PROGRAM/DATA 12-Bit Analog to Digital Converter
TMS320F 2806 CORECPU
FLASH MEMORY PROGRAM/DATA 12-Bit Analog to Digital Converter
TMS320F 2806 CORECPU
PIC 18F97J60 ETHERNET INTERFACE 256MB MULTIMEDIA DATASTORAGE CARD
Fig 13: Block diagram of the proposed system. Fig 10: Voltage signal with sag and detail coeff d1
Case-b: Voltage Swell Similarly the program was tested for the voltage swell conditions. As shown in fig 11 the occurrence and duration of voltage swell was captured by detail coefficient
As shown in fig 13. the three phase voltage and current signal are isolated and conditioned using 240/1 P.T and 40/1 Amp C.T and then converted to unipolar voltage and current signals as required by the ADC of the DSP.
4. APPLICATIONS
1.
A. Feeder Protection and Load Shedding. Fig 11. Voltage signal with swell and detail coeff d1
In distribution systems, a precise frequency measurement is necessary for frequency-protection relay. By accurately measuring frequency at different location
Proceedings of the 7th WSEAS International Conference on Power Systems, Beijing, China, September 15-17, 2007
utility can have a controlled load-shedding and load restoring program.
B. Harmonic Filter design. By having an on-line tracking of harmonics the effect of various power electronic equipment on the system can be studied. Also the performance of the harmonic elimation filter can be validated on-line by the proposed technique.
C. Wind Turbines. The power fluctuation from the wind turbines during switching or continuous operation causes voltage fluctuation on the system connected. Flicker issue during higher power output period needs to be investigated..
D. Power Quality Disturbance Analysis. The advantage of the proposed approach is in identification of sag, swell and transients so that proper counter measures could be taken such as static transfer switch (STS), Dynamic voltage restorer (DVR). The rapid detection of disturbances with identification of types of events is essential for Power Quality (PQ) enhancement.
5. CONCLUSIONS In this paper we have proposed high performance signal processing techniques and the proposed digital instrument based on multiple DSP that help to speed up measurement and algorithm execution. The obtained results appear to confirm the effectiveness of our implementations and suggest continuing in the experimental investigation.
6. ACKNOWLEDGEMENTS The author is very much grateful to the Director-ERDA ”Electrical Research and Development Association” for providing financial support for the research work done in this field.
7. REFERENCES [1] C.J.Melhorn,M.F.McGranaghan,”interpretation and analysis of power quality measurements ”,IEEE Trans Industry Applications Vol 31,no 6,Nov-Dec. 1995,pp 13631370. [2]Sezi, T., "A New Method for Measuring Power System Frequency". IEEE Transmission and Distribution Conference. Vol. 1, p 400-405. 11-16 April 1999. [3] Suraj Pardeshi, M. Ramamoorty, R.B. Kelkar, “On line power system frequency measurement under non-sinusoidal conditions” at National Power Systems Conference,NPSC2007 at IIT Roorkee.
287
[4]Adly A.Girgis, W.Bin Chang, Elham B. Makram, "A Digital Recursive Measurement Scheme for On-Line Tracking of Power System Harmonics” IEEE Trans. on Power Delivery, Vol. 6, No.3, July, 1991, pp. 11531160. [5] Suraj Pardeshi,M. Ramamoorty,R.B. Kelkar, “On line tracking of power system harmonic using Kalman filter” at Recent Advancements and application of computer in electrical engineering, organized by IEEE at Bikanear Engg.. College. [6]R.Grover Brown, An Introduction to Random Signal Analysis and Kalman Filtering, John Wiley & Sons,1983 [7] IEC 61000-4-15. Electromagnetic compatibility (EMC) -Pan 4 Testing and measurement techniques Section 15: Flicker meter - Functional and design specification. [8] A.M. Gauda, M.R.Sultani, A.Y. Chikhani “Power Quality Detection and Classification Using WaveletMultiresolution Signal Decomposition”IEEE transaction on Power delivery Vol 14,No 4 Oct 1999.