On Modeling the Packet Error Statistics in Bursty Channels∗ Changli Jiao Department of Electrical and Computer Engineering Wayne State University Detroit, MI 48202 Email:
[email protected]
Loren Schwiebert Department of Computer Science Wayne State University Detroit, MI 48202 Email:
[email protected]
Bin Xu† Department of Mathematics Wayne State University Detroit, MI 48202 Email:
[email protected] Abstract Wireless channels usually face bursty errors, i.e., errors are prone to occur in clusters. These bit errors can be modeled using the Gilbert-Elliott model. When data packets are transferred over channels with bursty errors, packet error statistics are more important than bit error statistics to analyze the communication performance. This has been modeled as a discrete time Markov chain (DTMC) in previous work. However, whether this Markov chain is time-homogeneous has never been addressed. In this paper, we prove that the packet errors can be modeled only as a Markov chain without constant transition probabilities. Thus finding a constant transition matrix and then discussing performance is not accurate. Instead, a gap model is adopted and the packet error/error-free length distributions are thus analyzed.
1
Introduction
More and more modern communication applications are using wireless channels since mobility provides a lot of convenience to communication end users. However, wireless links usually have to face many more errors than their wired counterparts. This is basically the direct result of the wireless channel characteristics such as multi-path, transmission interference, and signal fading. The Gilbert-Elliott model [5] [2] is a well-known model for the bit errors in wireless channels. For mobile radio channels, especially those used for typical transmissions from a base station to mobile users in an urban environment, Rayleigh fading is the widely accepted model. And the Gilbert-Elliott model ∗ This material is based upon work supported by the National Science Foundation under Grant No. 0086020. † Dr. Xu is now with Gedas USA, 3499 Hamlin Road West, Rochester Hills, MI 48309.
has been proved to model this kind of fading channel with sufficient accuracy [14] [17]. In order to perform wireless data communication, people need to transfer packets over the channel. Each packet is composed of a block of consecutive bits. Considering packet transmission without error correction technologies such as Forward Error Correction (FEC) and interleaving, the packet is correct only when all the continuous bits are transmitted correctly. Knowledge of the packet error statistics is more important to discuss the communication performance. Even though the common model of the bit level error statistics is the Gilbert-Elliott model, the models for packet level statistics differ a lot as shown in previous work [16] [11] [7]. Theoretically, a Markov chain has been proved to be a proper model for packet level statistics [16]. However, real world tracing shows it should be modeled as a modified Markov chain [11], or not a Markov chain but a non-stationary stochastic process [7]. This forced us to question why the theoretic result is so different from the trace results. In this paper, we present our work on the packet level statistics and compare it with previous research results. In Section 2, both the mathematical background and the previous work on bit and packet level statistics are reviewed. In Section 3, the packet level statistics are proved to be a time-inhomogeneous Markov chain. The stationarity of packet level statistics is discussed as well. After pointing out a time-homogeneous Markov chain is not appropriate, a gap model is given in Section 4 as the model to discuss the statistics in this field. One application of using this model is also given in Section 4.
2
Related Work
2.1 2.1.1
Mathematical Preliminaries Stationarity
A discrete stochastic process is a set of values observed at discrete times. Each value is a probability variable itself. Define the variable at time t as X(t). A stochastic process can be either stationary or nonstationary. There are two types of stationarity. A stochastic process is said to be strictly stationary if the joint distribution of X(t1 ), X(t2 ), . . . , X(tn ) is the same as the joint distribution of X(t1 + τ ), X(t2 + τ ), . . . , X(tn + τ ) for all t1 , t2 , . . . , tn , τ . In a less restricted way, a process is called second-order stationary (or weakly stationary) if its mean is constant and its autocovariance function depends only on the lag, so that E[X(t)] = µ and Cov[X(t), X(t + τ )] = γ(τ ). Considering both the first and second moment, second-order stationarity makes no assumptions about higher moments. This relaxed restriction makes second-order stationarity used more often when analyzing real world stochastic processes. Like many other publications [12] [6] [3], stationarity will be used to refer to second-order stationary in this paper if no other comments are made.
2.1.2
Markov Chain
A Markov chain [3] [6] [12] is a special discrete time stochastic process. It has the property that the state at the current time is decided by only the immediately preceding one, and is not influenced by the state at any previous time. In formal terms, a process is said to be Markovian if P (X(ti ) = xi |X(t1 ) = x1 , . . . , X(ti−2 ) = xi−2 , X(ti−1 ) = xi−1 ) = P (X(ti ) = xi |X(ti−1 ) = xi−1 ) for all time points ti and all states x1 , . . . , xi−2 , xi−1 , xi . This conditional probability is called the transition probability from xi−1 to xi at time ti−1 . If the transition probabilities do not change with time t, the Markov chain is described as having constant (stationary) transition probabilities or called a timehomogeneous Markov chain. Otherwise, the Markov chain is usually called a general Markov chain. An n-th order Markov chain is actually a semi-Markov chain where the current state depends only on the previous n states. Formally, a stochastic process is an n-th order Markov chain if and only if P (X(ti ) = xi |X(t1 ) = x1 , . . . , X(ti−n ) = xi−n , . . . , X(ti−1 ) = xi−1 ) = P (X(ti ) = xi |X(ti−n ) = xi−n , . . . , X(ti−1 ) = xi−1 ) for all ti and all states x1 , . . . , xi−n , . . . , xi−1 , xi .
2.1.3 Runs Test When we need to analyze a random process and we do not have much knowledge about the underlying mathematical model, some statistical procedures assume a specific distribution function, e.g., a Gaussian distribution. This probably can be used with reasonable accuracy for many random variables that do not fit this particular distribution. However, there is no clear measure as to how much a random variable may deviate before this distribution is no longer valid. This problem can often be avoided by using distribution-free (nonparametric) procedures. The Runs test [1] is one of these procedures. Consider a sequence of N observed values of a random variable, where each observation is classified into one of two mutually exclusive categories. A run is defined as a sequence of identical observations that is followed and preceded by a different observation or no observation at all. The number of runs that occur in a sequence of observations gives an indication as to whether or not the results are independent random observations of the same random variable. 2.1.4 Average Mutual Information Average mutual information is calculated based on mutual information [4]. Let ak and bj denote two events belonging to two different event spaces. Mutual informaP (ak |bj ) tion, IX|Y (ak ; bj ), is defined as log X|Y PX (ak ) , which is the information provided about the event X = ak by the occurrence of the event Y = bj . It actually uses the logistical value of the ratio of a posteriori to a priori probability to evaluate the relationship. Average X mutual information, IX|Y (X; Y ), is defined as IX|Y (a; b). a∈X,b∈Y
IX|Y (ak ; bj ) is usually denoted simply as I(ak ; bj ) and IX|Y (X; Y ) as I(X; Y ).
2.2 Previous Work on Wireless Channel Error Models 2.2.1 Bit Level Model A Markov chain was first used to model bit errors in [5]. Gilbert modeled the channel as having two states, Good state and Bad state. When the channel is in the Good state, all the bits are transferred correctly; the channel is equal to the perfect channel. When the channel is in the Bad state, the channel is a binary symmetric channel. The bits transmitted in this state will suffer a specific bit error rate. The Gilbert model is modified by Elliott [2], where the Good state is also modeled as a binary symmetric channel. Under the Gilbert-Elliott model, the wireless channel is then modeled as a discrete time Markov chain (DTMC). The channel can be assumed as having two states. One is the Good state; the other is the Bad state. These two events
are denoted as g and b, respectively. As shown in Figure 1, at any time, the probability of the next channel state is determined by only the current state and has no relationship with any previous state. The value of the transition matrix, Pbg , Pgg , Pgb , and Pbb , can be calculated according to the channel features or from real world tracing results. No matter which state the channel is in, errors occur following an independent and identical distribution (IID) model. This means that the bits sent over the wireless channel are facing a certain bit error rate (BER) to be corrupted, where the value of BER is determined by the channel state. When the channel is in the Good state, the Bit Error Rate, BERg , is low. On the other hand, the BER for the Bad state, BERb , is high.
pgb pgg
g
b
pbb
pbg Figure 1: Markov Model for Wireless Link Some previous work [14] [17] uses the average mutual information relationship to demonstrate that the first order Markov chain is accurate enough to describe the channel fading state. Let Ri , Ri−1 , and Ri−2 denote the random variable of a stochastic process at time i, i − 1, and i − 2. One property of the average mutual information is I(Ri ; Ri−1 Ri−2 ) = I(Ri ; Ri−1 ) + I(Ri ; Ri−2 |Ri−1 ). The meaning of this equation is that the average mutual information among Ri , Ri−1 , and Ri−2 equals the addition of that between Ri and Ri−1 and the conditional average mutual information between Ri and Ri−2 given Ri−1 . As pointed out in [14], the wireless channel state can be described as a higher order Markov chain [13] [15]. Then, this property, especially the ratio between I(Ri ; Ri−1 ) and I(Ri ; Ri−2 |Ri−1 ), can be used to compare the accuracy of first order and second order Markov models. When I(Ri ;Ri−2 |Ri−1 ) is much less than 1, I(Ri ; Ri−1 ) itself can I(Ri ;Ri−1 ) be used to represent I(Ri ; Ri−1 Ri−2 ). When this point holds, the second order Markov chain model can be simplified to a first order Markov chain model without much loss in accuracy. Discussing the average mutual information of the signal-to-noise ratio (SNR) at a wireless channel receiver, Wang et al. [14] prove that a wireless channel can be modeled as a first order Markov chain. Zorzi et al. [17] use a similar method and prove the first order Markov chain from the aspect of the received signal power. Note that [17] is discussing the packet level statistics. However, the channel is assumed as changing slowly compared to the trans-
mission period of a packet so that no channel state transition is allowed within any packet. Since this requirement is actually true for a bit level model, we may also treat this work as analyzing bit level statistics. 2.2.2 Packet Level Model Given that the wireless channel can be modeled using the Gilbert-Elliott model, Zorzi et al. use the average mutual information relation again and prove that the proper model for packet level statistics is also a first order Markov chain [16]. When considering the packet level statistics, Ri is used to denote the probability variable of the state of packet i, i.e., Ri can be either packet is correct or packet is in error. There are also papers that analyze the packet error probability based on tracking results [11] [7]. The conclusion in these papers is that the packet level statistics cannot be modeled simply as a Markov chain. In [11], the cumulated distribution function (CDF) is calculated from the tracking results and compared with that of a simple two state Markov chain. Then some modifications on the Markov chain are given to represent the packet level statistics. In [7], the Runs test is conducted on a real world tracking result, which shows that the packet level statistics are not stationary. Some statistical parameters are found to divide the tracking result into two series. One series contains only corrupted packets and the other one contains both corrupted and correct packets, which could actually be modeled as a simple Markov chain. The two series could be simulated with ease and then the packet level situation is simulated by their combination. The difference between the theoretical analysis and the experimental results is quite obvious. Even though the experimental results are produced when error correction is adopted, the difference still inspired us to question why there is such a huge difference. Our research result is shown in the following sections.
3 Analysis of the Packet Error Statistics 3.1 Calculate the Packet Error Probability In order to calculate the packet error probability, we need to define three stochastic processes. The first one, X(i), i = 0, 1, 2, . . ., is the channel status sampled for each bit sent over the channel. The event set for X is {g, b}, where g stands for the Good channel status and b for the Bad one. Note that the bits sent over the channel may or may not belong to the same connection. X is a Markov chain and we have PX (X(i) = g|X(i − 1) = g) PX (X(i) = b|X(i − 1) = g) PX (X(i) = g|X(i − 1) = b) PX (X(i) = b|X(i − 1) = b)
= = = =
pgg pgb pbg pbb
for all i. The second process is the bit error/error-free status observed for each bit sent over the channel, Y (i), i = 0, 1, 2, . . .. The bit status is either 0, which means that the bit is transferred correctly, or 1, bit not correct. We have the following relationship between X and Y :
A simple expression for P (Z(j) = A|X(bj ) = g) is: " [1 0] × "
= 1 − BERg = BERg = 1 − BERb = BERb
Finally, the third process is what we are most interested in, the packet status Z(j), j = 0, 1, 2, . . .. The possible events of Z are error or error-free, denoted by A and B, respectively. Denote the length of packet j as lj and the first bit of the packet as bj , packet j is composed of bits bj , bj +1, . . . , bj +lj −1. A packet is assumed to be correct only when all the bits it contains are transferred correctly. So we have bj +lj −1
P (Z(j) = A) =
Y
P (Y (i) = 0)
i=bj
After defining the three processes, we can then calculate the packet error probability given the channel state when the first bit of a packet is sent. In this paper, we will refer to this channel state as the initial channel state of one packet. Remember the channel state could change at the edge of every bit. After knowing the initial channel state of packet j, the channel states for all other lj − 1 bits can be either Good or Bad. So the total number of channel state series for the packet is 2lj −1 . The probability of each channel state series can be calculated by the property of process X. Considering the error probability of each bit, the total probability theorem shall be used to calculate the packet error/error-free probability. The formula for the packet error/error-free probability given the initial channel state is Good is expressed as follows: P (Z(j) = A|X(b X j ) = g) φ(g, xbj +1 , . . . , xbj +lj −1 ) = i=bj +1,...,bj +lj −1 xi ∈{g,b} where φ(x0 , x1 , . . . , xlj −1 ) lj −1 Y = PY (0|g) PY (0|xi )PX (xi |xi−1 ) i=1 P (Z(j) = B|X(bj ) = g) = 1 − P (Z(j) = A|X(bj ) = g) (1)
#lj −1
# 1 − BERg 1 − BERb
× PY (Y (i) = 0|X(i) = g) PY (Y (i) = 1|X(i) = g) PY (Y (i) = 0|X(i) = b) PY (Y (i) = 1|X(i) = b)
pgg (1 − BERg ) pgb (1 − BERg ) pbg (1 − BERb ) pbb (1 − BERb )
(2) Similarly, the packet error-free probability given a Bad initial channel state can be calculated using the simple expression: " #lj −1 pgg (1 − BERg ) pgb (1 − BERg ) [0 1] × pbg (1 − BERb ) pbb (1 − BERb ) "
# 1 − BERg 1 − BERb
×
(3) For each channel state series, the initial channel state for the following packet can also be analyzed. Having this information, the statistics for the following packet can also be calculated using the same method. For example, the conditional probability that given the initial channel state is Good, packet j is correct and the initial channel state for packet j + 1 is also Good, i.e., P (Z(j) = A, X(bj+1 ) = g|X(bj ) = g), can be calculated using the following expression: " [1 0] ×
pgg (1 − BERg ) pgb (1 − BERg ) pbg (1 − BERb ) pbb (1 − BERb ) #
" ×
#lj −1
pgg (1 − BERg ) pbg (1 − BERb )
(4) Then, combining Expression (4) and Expression (2) or using Expression (4) recursively, we can calculate the probability that a group of packets are transferred without error. For a group of packets with another packet error/error-free status sequence, we can calculate the probability similarly. Thus, knowing the initial channel state of one packet and using this method, we can calculate the probability of this packet as well as the probability of any combination of this packet and its following packets. After finding these values, further statistical analysis results can be calculated.
3.2 Time-inhomogeneous Markov Chain Packet level error statistics have been proved to be approximated by a first order Markov chain in [16] through the relationship between average mutual information. However, this proof might be sufficient only for a generic Markov model, which does not verify that it should
be a Markov chain with constant transition probabilities. From the analysis in Section 3.1, it is clear that the initial channel state actually determines the error probability of one packet. It also determines the probability of the initial channel state for the following packet, from which the probability for that packet can be specified. Since the initial channel state of one packet can decide the error probability of itself as well as the following packet, it actually specifies the transition probability of the packet level statistics, which may not be the same for different initial states. When one packet is specified, its initial channel state is fixed, either Good or Bad. However, in the proof where the average mutual information is used, both initial channel states are combined together through the average mutual information, so the difference among transition probabilities is thus hidden and neglected. 0
10
−1
10
1
0.95
0.9
−2
10
0
100
200
300 400 packet length (bytes)
500
600
700
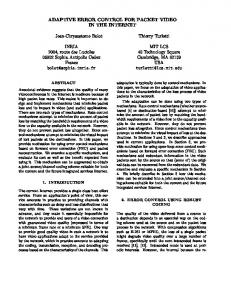
Figure 2: Comparison of Average Mutual Information We calculate and compare the values of the average mutual information, I(Ri ; Ri−1 ), for different initial channel states. Suppose the sender has enough packets and the packets are transmitted on the wireless channel periodically, which means that the time distance between any two adjacent packets is a fixed value. In Figure 2, we plot the average mutual information when the packets are transmitted continuously, i.e., after each packet the following packet will be sent out immediately. The bit level model parameters are set as the car speed model used in [8], i.e., pgg = 0.0000167, pbb = 0.00166, BERg = 0.00001, BERb = 0.01. For all the figures shown in this paper, we use this set of parameters. As shown in Figure 2, the average mutual information for Good and Bad initial channel states and the average situation are quite different. It is true that the bit level statistics will influence the packet level analysis results. So the differences among average mutual information may not ap-
transition probability, from correct to correct
average mutual information between two contenous packets
initial channel state is Good initial channel state is Bad average case
pear under certain circumstances. However, for either the difference in average mutual information or all other results in this paper, we obtained similar results while using almost all possible parameter combinations. And these results hold for bit level parameters used in [8] for common wireless communication environments as well as the Gilbert-Elliott model used in [16]. When the packet is shorter, the average mutual information between the Good and Bad initial channel states is not big. However, the average case has a big difference from these two cases. This actually confirms that using the average case may not be the appropriate way. When one packet is sent, the initial channel state is either Good or Bad. And the probability of the following channel states differs a lot when we consider just the following short range of time. So combining these two cases together does not make much sense, especially when the packet length is not big enough, i.e., not approaching infinity. On the other hand, packets with too many bits are prone to be corrupted and are not realistic. The difference in average mutual information makes us question whether this process is a Markov chain with constant transition probabilities or not. In order to verify this, we calculate the transition matrix of the packet level stochastic process when the bit level errors follow a Gilbert-Elliott model.
0.85
0.8
0.75
0.7
0.65
initial channel state is Good initial channel state is Bad average case
0.6
0.55
0.5
0
100
200
300 400 packet length (bytes)
500
600
700
Figure 3: Comparison of Transition Probability, from Correct Packet to Another Correct Packet In Figure 3, the transition probabilities of one correct packet given that the previous one is also correct are plotted. The initial channel status of one packet could be either Good or Bad. Transition probabilities for both situations are given. From this figure, it is clear that the transition probabilities are different. This feature can be explained as a property of the Markov chain as follows. If at one time a packet is correct with a Good initial state, the transition
tion for the packet level process. However, we use the Runs test to test the stationarity as in [7]. In real world conditions, it usually can be assumed that any nonstationarity of interest will be revealed by time trends in the mean value of the data. For the packet level error statistics, we can assume that the nonstationarity can be revealed by the run length of erroneous packets. The first stage is to collect packet transmission statuses. We simulate them by using Matlab 5.3 [10]:
0.65
transition probability, from bad to bad
0.6
0.55
0.5
0.45
0.4
• Use the Markov chain model to generate series of the channel states.
initial channel state is Good initial channel state is Bad average case
0.35
0.3
0.25
• Use the IID model to simulate whether every bit transmitted in each state is correct or not. 0
100
200
300 400 packet length (bytes)
500
600
700
Figure 4: Comparison of Transition Probability, from Corrupted Packet to Another Corrupted Packet probabilities are different from the case where the initial state is Bad and the packet is correct. Similarly, Figure 4 demonstrates that the transition probabilities from a corrupted packet to another corrupted one are also different. As shown in Figure 4, when the packet length is around 260 bytes, the transition probabilities from a corrupted packet are the same for different initial channel states. However, the transition probabilities given a correct packet differ a lot with the same packet length. So the transition matrix for the packet error statistics is not constant. The packet level statistics can thus be modeled only as a general Markov chain without a constant transition matrix. According to the definition of a time-homogeneous Markov chain [3] [6] [12], it is a time-inhomogeneous Markov chain. If it is assumed to be time-homogeneous and the transition matrix under the average case is thus used for evaluating communication performance, we may not reach correct conclusions.
3.3
Stationarity of the Packet Error/Error-free Process
In [7], whether or not the packet error statistics is stationary is analyzed and the result actually determines how to simulate this process. So we also want to discuss this issue here. Even though in Section 3.2 we reach the conclusion that the packet level error statistics can be modeled as a time-inhomogeneous Markov chain, the stationarity feature cannot be determined simply from this conclusion. Remember that the property of a Markov chain is the conditional probability given the present state. A Markov chain, with constant transition probabilities or not, cannot be mapped directly to the property of stationarity [6]. Using the calculation method pointed out in Section 3.1, we are able to calculate the mean and the autocovariance func-
• For any packet, whether it is correct or not is determined by all the bits it contains. The packet is correct only when all the bits are transmitted correctly. The uniform random number generator in Matlab 5.3 uses a lagged Fibonacci generator, with a cache of 32 floating point numbers, combined with a shift register random integer generator. Starting with a Good channel state, we simulate 25,000 30-byte packets that are transferred continuously. The same procedure as [7] is followed to test packet error stationarity. The procedure is described as follows: • Divide the sample record into N equal time intervals where the data in each interval may be considered independent. • Count the run lengths in each interval. • Compute a mean value for each interval and align these sample values in a time sequence. • Test the sequence of mean values for the presence of underlying trends or variations other than those due to expected sampling variations. The Runs test result is plotted in Figure 5. Using 0.05% left and right tail cut-offs and comparing with the features a stationary stochastic process should have [1], the packet level error statistics are not stationary.
4 Packet Error Model A better way to discuss packet level error statistics could be adopting the gap model [9]. Under any situation, two consecutive correct packets are separated by an arbitrary number of corrupted packets. The gap model uses the probability for the number of these corrupted packets to describe the block error statistics. The gap model actually describes the property of a stochastic process through analyzing the probability of different lengths of corrupted
the average packet error-free length is much larger than the average packet error length. The second one is that the time-homogeneous Markov chain cannot give a correct image on the consecutive corrupted/correct packets, which in turn will introduce incorrect analysis results on communication performance. Finally, if the distributions of packet error/error-free length are calculated from real world tracking results and a Markov chain model is assumed, the transition probability can be calculated from the best-match geometric distribution. However, this model may not even describe the average packet error/error-free rate successfully. This point has been verified in [7].
250
200
Occurrence
150
100
50
0
10
0
0
2
4
6 Number of Runs
8
10
Gap Model Time−homogeneous Markov Model Simulation Result
12
−1
10
packet runs. In the transport layer protocols, the corrupted packet runs actually determine the flow control. Hence, the gap model is expected to describe the packet flow successfully. In the gap model, P (j) is defined as the expectation that there exist j−1 corrupted packets between two consecutive correct ones. And the expression for P (j) is given as:
1−CDF
Figure 5: Run Test result
−2
10
−3
10
P (j) = P (Zi+1 = B, . . . , Zi+j−1 = B, Zi+j = A|Zi = A),
−4
10
0
5
10
15
20 25 packet error length (pkts)
30
35
40
45
Figure 6: Distribution of Packet Error Length 0
10
−1
10
−2
10
−3
10 1−CDF
where j = 1, 2, 3, . . .. From the formulas given in Section 3.1, it is easy to calculate the value of P (j). After finding the probabilities in the gap model, we can further analyze the communication performance. One application of the gap model is to calculate the distribution of error/error-free packet length, which was obtained from tracking results in both [11] and [7]. The CDF functions are plotted in Figure 6 and Figure 7, respectively, for a packet length of 30 bytes. In order to compare the importance of using an appropriate packet error model, we also give the distributions when the timehomogeneous Markov chain is adopted. The results show a big difference from those when the gap model is used. We also use the simulation results described in Section 3.3 to simulate the packet status and plot the distribution of error/error-free packet length in Figure 6 and Figure 7, respectively. It is clear that only the gap model matches the simulation results. Remember that we simulated 25,000 packets and the CDF functions are plotted by analyzing these packets. The match is expected to be even better if we do longer simulations. There are several features that can be observed from Figure 6 and Figure 7. One feature noticed from the figures is that the distribution of packet error-free length is quite different from that of the packet error length. And
−4
10
−5
10
Gap Model Time−homogeneous Markov Model Simulation Result
−6
10
−7
10
0
10
1
10
2
10 packet error−free length (pkts)
3
10
Figure 7: Distribution of Packet Error-free Length
5 Conclusion So far, we have reached the conclusion that the packet error statistics can be modeled only as a time-
inhomogeneous Markov chain and it is not stationary. Thus, treating the packet error process as a Markov chain with a constant transition matrix and analyzing connection performance is not proper. The gap model is adopted to model this process and one application is given as an example. Future work includes using the gap model to compare communication performance with different packet lengths and with different error recovery mechanisms. In addition, the energy issue can also be discussed using this model in some energy-constrained wireless environments, such as wireless sensor networks and mobile ad-hoc networks.
Acknowledgments The authors thank the authors of the referenced work. Their research results inspired our work on modeling packet level errors in wireless channels. We also thank Dr. George G. Yin, who offered many helpful comments on the mathematical models and analysis in early drafts of this paper.
References [1] J. S. Bendat and A. G. Piersol. Random Data: Analysis and Measurement Procedures. John Wiley & Sons, Inc. 1986. [2] E. O. Elliott. Estimates of Error Rates for Codes on Burst-error channels. Bell Systems Tech. Journal, 42:1977–1997, Sept. 1963. [3] William Feller. An Introduction to Probability Theory and Its Applications. John Wiley & Sons, Inc. 1957. [4] R. G. Gallager. Information Theory and Reliable Communication. New York, Wiely, 1968. [5] E. N. Gilbert. Capacity of a Burst-noise Channel. Bell Systems Tech. Journal, 39:1253–1266, Sept. 1960. [6] S. Karlin and M. T. Taylor. A First Course in Stochastic Processes. Academic Press, New York, 1975. [7] Almudena Konrad, Ben Y. Zhao, Anthony D. Joseph, and Reiner Ludwig. A Markov-Based Channel Model Algorithm for Wireless Networks. In Proceedings of Fourth ACM International Workshop on Modeling, Analysis and Simulation of Wireless and Mobile Systems, July 2001. [8] Paul Lettieri, Christina Fragouli, and Mani B. Srivastava. Low Power Error Control for Wireless Links. In Third ACM/IEEE International Conference on Mobile Computing and Networking 1997 (MobiCom’97), September 1997. [9] Deng-Lin Lu and Jin-Fu Chang. Performance of ARQ Protocols in Nonindependent Channel Errors. IEEE Transactions on Communications, COM-41(5):721–730, 1993. [10] MATLAB. http://www.mathworks.com. [11] Giao T. Nguyen, Randy H. Katz, Brian Noble, and Mahadev Satyanarayanan. A Trace-Based Approach for Modeling Wireless Channel Behavior. In Proceedings of the Winter Simulation Conference, pages 596–604, Coronado, CA, December 1996. [12] S. Ross. Stochastic Processes. John Wiley & Sons, Inc., 1983. [13] F. Swarts and H.C. Ferreira. Markov Characterization of Digital Fading Mobile VHF Channels. IEEE Transactions on Vehicular Technology, 43(4):977–985, 1994. [14] H. Wang and P. Chang. On verifying the first-order Markovian assumption for a Rayleigh fading channel model. IEEE Trans. on Veh. Tech., 45(2):353–357, 1996.
[15] H. Wang and N. Moayeri. Finite State Markov Channel - a Useful Model for Radio Communication Channels. IEEE Trans. on Veh. Tech., 44(1):163–171, 1995. [16] M. Zorzi and R. Rao. On the Statistics of Block Errors in Bursty Channels. IEEE Transactions on Communications, COM45(6):660–667, 1997. [17] M. Zorzi, R. Rao, and L. Milstein. On the accuracy of a first-order Markov Model for data transmission on fading channels. In IEEE ICUPC’95, pages 211–215, November 1995.