brackets on the right hand side of Equation 2 attains its minimum value, is referred ... Observation 2: The PSD measure leads to an unsatis- factory clustering result ..... (http://www.ics.uci.edu/mlearn/MLRepository.html). The de- scription of the ...
On Some Symmetry Based Validity Indices Sriparna Saha, Student Member, IEEE and Sanghamitra Bandyopadhyay, Senior Member, IEEE Machine Intelligence Unit, Indian Statistical Institute, Kolkata, India-700108 Email: {sriparna r, sanghami}@isical.ac.in
Abstract—Identification of the correct number of clusters and the corresponding partitioning are two important considerations in clustering. In this paper, a newly developed point symmetry based distance is used to propose symmetry based versions of six cluster validity indices namely, DB-index, Dunn-index, Generalized Dunn-index, PS-index, I-index and XB-index. These indices provide measures of “symmetricity” of the different partitionings of a data set. A Kd-tree-based data structure is used to reduce the complexity of computing the symmetry distance. A newly developed genetic point symmetry based clustering technique, GAPS-clustering is used as the underlying partitioning √ algorithm. The number of clusters are varied from 2 to n where n is the total number of data points present in the data set and the values of all the validity indices are √ noted down. The optimum value of a validity index over these n − 1 partitions corresponds to the appropriate partitioning and the number of partitions as indicated by the validity index. Results on five artificially generated and four real-life data sets show that symmetry distance based I-index performs the best compared to all the other five indices. Index Terms—Unsupervised classification, cluster validity index, symmetry property, point symmetry based distance, Kdtree
I. I NTRODUCTION Clustering [1] is a core problem in data-mining with innumerable applications spanning many fields. In order to mathematically identify clusters in a data set, it is usually necessary to first define a measure of similarity or proximity which will establish a rule for assigning patterns to the domain of a particular cluster centroid. The measure of similarity is usually data dependent. It may be noted that one of the basic feature of shapes and objects is symmetry. As symmetry is so common in the natural world, it can be assumed that some kind of symmetry exists in the clusters also. Based on this, Su and Chou have proposed a new type of non-metric distance, based on point symmetry. This work is extended in [2] in order to overcome some of the limitations existing in [3]. It has been shown in [4] that the PS distance proposed in [2] has some serious drawbacks. In order to overcome these limitations, a new point symmetry based distance dps (PS-distance) is developed in [4]. For reducing the complexity of computing the PS-distance, use of Kdtree [5] is also proposed there. This proposed distance is then used to develop a genetic algorithm based clustering technique, GAPS [4]. The two fundamental questions that need to be addressed in any typical clustering scenario are: (i) how many clusters are actually present in the data, and (ii) how real or good the clustering itself. That is, whatever may be the
clustering technique, one has to determine the number of clusters and also the validity of the clusters formed [6]. The measure of validity of clusters should be such that it will be able to impose an ordering of the clusters in terms of its goodness. In other words, if U1 , U2 , . . . , Um be the m partitions of X, and the corresponding values of a validity measure be V1 , V2 , . . . Vm , then Vk1 ≥ Vk2 ≥ . . . Vkm , ∀ki ∈ 1, 2, . . . , m, i = 1, 2, . . . , m will indicate that Uk1 ↑ . . . ↑ Ukm . Here ‘Ui ↑ Uj ’ indicates that partition Ui is a better clustering than Uj . Note that a validity measure may also define a decreasing sequence instead of an increasing sequence of Vk1 , . . . , Vkm . Several cluster validity indices have been proposed in the literature. These are DaviesBouldin (DB) index [7], Dunn’s index [8], Xie-Beni (XB) index [9], I-index [10], CS-index [11], etc., to name just a few. Some of these indices have been found to be able to detect the correct partitioning for a given number of clusters, while some can determine the appropriate number of clusters as well. Milligan and Cooper [12] have provided a comparison of several validity indices for data sets containing distinct non-overlapping clusters while using only hierarchical clustering algorithms. Maulik and Bandyopadhyay [10] evaluated the performance of four validity indices, namely, the Davies-Bouldin index [7], Dunn’s index [8], CalinskiHarabasz index [10], and a recently developed index I, in conjunction with three different algorithms viz. the wellknown K-means [1], single-linkage algorithm [1] and a SAbased clustering method [10]. All the above mentioned indices use the Euclidean distances in their computation. They are therefore able to characterize only convex clusters. It has been shown in [4] that the symmetry based distance is effective not only for convex clusters, but also in cases where the clusters are non-convex, but satisfy the property of point-symmetry. In this article we conjecture that incorporation of the symmetry measure in the above mentioned validity indices will impart the property of characterizing non-convex, symmetric clusters to them. Thus, here we have developed six cluster validity indices using the newly proposed point symmetry based distance rather than the Euclidean distance. These indices follow the definitions of the six well-known existing cluster validity indices, namely, Davies-Bouldin index (DB-index) [7], Dunn index [8], Generalized Dunn’s index [13], PS-index [2], I-index [10], Xie-Beni index (XB index) [9]. The newly proposed point symmetry based distance is substituted in place of Euclidean distance in the definitions of these wellknown validity indices and their performances are evaluated.
697 c 1-4244-1340-0/07$25.00 �2007 IEEE
A newly developed genetic point symmetry based clustering technique, GAPS-clustering [4] is used as the underlying clustering algorithm. The number of clusters is varied from Kmin to Kmax . As a result, total (Kmax − Kmin + 1) par∗ ∗ ∗ , UK . . . UK , with titions will be generated, UK min min +1 max the correspondng validity index values computed as VKmin , VKmin +1 . . . VKmax . Let K ∗ = argopti=Kmin ...Kmax [Vi ]. Therefore, according to index V , K ∗ is the correct number ∗ may of clusters present in the data. The corresponding UK be obtained by using a suitable clustering technique with ∗ ∗ > the number of clusters set to K ∗ . The tuple < UK ∗, K is presented as the solution to the clustering problem. The effectiveness of the newly proposed point symmetry based cluster validity indices namely, Sym-DB index, Sym-Dunn index, Sym-GDunn index, Sym-PS index, Sym-I index and Sym-XB index, are shown in identifying number of clusters from five artificially generated and four real-life data sets of varying complexities. Experimental results show that the Sym-I index performs the best compared to all the other five indices.
d1 x 1 c2
Motivated by the property of point symmetry that clusters often exhibit, a PS-distance was proposed in [3] which was further modified in [2]. The modified distance is defined as follows: Given N patterns, xj , j = 1, . . . N , and a reference vector c (e.g., a cluster centroid), the “point symmetry distance” between a pattern xj and the reference vector c is defined as
where ds (xj , c) =
� min i=1,...N and
i�=j
�(xj − c) + (xi − c)� �(xj − c)� + �(xi − c)�
(1) �
(2) and de (xj , c) denotes the Euclidean distance between xj and c. The value of xi , say x∗j , for which the quantity within brackets on the right hand side of Equation 2 attains its minimum value, is referred to as the symmetrical point of xj with respect to c. Note that if x∗j is the same as the reflected point of xj with respect to c, then the numerator on the right hand side of Equation 2 will be equal to zero, and hence ds (xj , c) = dc (xj , c) = 0. A. Limitations of the PS-distance It is evident from Equation 1 that the PS-distance measure can be useful to detect clusters which have symmetrical shapes. But it will fail for datasets where clusters themselves are symmetrical with respect to some intermediate point. From equation 1, it can be noted that as de (xj , c) ≈ d (x ,c) de (x∗j , c), dc (xj , c) ≈ symm2 j , where dsymm (xj , c) = ∗ �(xj −c)+(xj −c)�. In effect, if a point xj is almost equally symmetrical with respect to two centroids c1 and c2 , it will be assigned to that cluster with respect to which it is more symmetric irrespective of the Euclidean distance between
698
x c1
x*1
II. T HE E XISTING P OINT S YMMETRY (PS)- BASED D ISTANCE M EASURES [2]
dc (xj , c) = ds (xj , c) × de (xj , c)
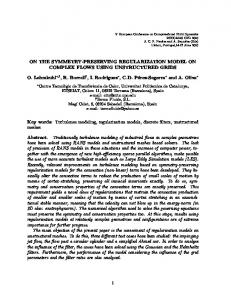
the cluster center and the particular point. This is intuitively unappealing. This is demonstrated in Figure 1. The centres of the three clusters are denoted by c1 , c2 and c3 , respectively. Let us take the point x. The symmetrical point of x with respect to c1 is x1 as it is the first nearest neighbor of the point x∗1 = (2 × c1 − x). Let the Euclidean distance between x∗1 and x1 be d1 . So the symmetrical distance of x with d1 × de (x, c1 ). respect to c1 is dc (x, c1 ) = de (x,c1 )+d e (x1 ,c1 ) Similarly symmetrical point of x with respect to c2 is x2 , and the symmetrical distance of x with respect to c2 becomes d2 × de (x, c2 ). Let d2 < d1 ; dc (x, c2 ) = de (x,c2 )+d e (x2 ,c2 ) Now as de (x, c2 ) ≈ de (x2 , c2 ) and de (x, c1 ) ≈ de (x1 , c2 ), therefore ds (x, c1 ) ≈ d1 /2 and ds (x, c2 ) ≈ d2 /2. Therefore ds (x, c1 ) > ds (x, c2 ) and x is assigned to c2 even though de (x, c2 ) de (x, c1 ). This will happen for the other points also, finally resulting in merging of the three clusters. This is intuitively unappealing. From the above observations, it
c3 x2
x*2 d2
Fig. 1. Example where point symmetry distance proposed by Su and Chou fail
can be concluded that the PS-distance measure [2] has two limitations: Observation 1 : The PS-distance measure lacks the Euclidean distance difference property. Here Euclidean distance difference (EDD) property is defined as follows: Let x be a data point, c1 and c2 be two cluster centers, and θ be a distance measure. Let θ1 = θ(x, c1 ), θ2 = θ(x, c2 ), de1 = de (x, c1 ) and de2 = de (x, c2 ). Then θ is said to satisfy EDD property if for θ1 ≈ θ2 , point x is assigned to c1 if de1 < de2 , otherwise it is assigned to c2 . It is evident from Figure 1 and from the above discussion that in the PS-distance measure defined in Equation 1, there is no impact of the Euclidean distance. (Although a term de (xj , c) is present, its effect gets almost neutralized by the denominator of the other term, ds (xj , c)). It only measures the amount of symmetry of a particular point with respect to a particular cluster center. As a result a point might be assigned to a very far off cluster centre, if it happens to be marginally more symmetric with respect to it. Observation 2: The PSD measure leads to an unsatisfactory clustering result for the case of symmetrical interclusters. If two clusters are symmetrical to each other with respect to a third cluster center, then these clusters are called “symmetrical interclusters”. In Figure 1 the first and the third clusters are “symmetrical interclusters” with respect to the middle one. As explained in
2007 IEEE Congress on Evolutionary Computation (CEC 2007)
the example, the three clusters get merged into one cluster since the PS-distance lacks the EDD property. This shows the limitation of the PS-distance in detecting symmetrical interclusters which is also experimentally demonstrated in this paper. B. A New Definition of the Point Symmetry Distance As discussed in Section 2, both the PS-based distances, ds and dc , will fail when the clusters themselves are symmetrical with respect to some intermediate point. It has been shown, in such cases the points are assigned to the farthest cluster. In order to overcome this limitation, we describe a new PS distance [4], dps (x, c) associated with point x with respect to a center c. The proposed point symmetry distance is defined as follows: Let a point be x. The symmetrical (reflected) point of x with respect to a particular centre c is 2 × c − x . Let us denote this by x∗ . Let knear unique nearest neighbors of x∗ be at Euclidean distances of di , i = 1, 2, . . . knear. Then dps (x, c)
= dsym (x, c) × de (x, c), �knear di i=1 × de (x, c), = knear
(3) (4)
where de (x, c) is the Euclidean distance between the point x and c. It can be seen from Equation 4 that knear cannot be chosen equal to 1, since if x∗ exists in the data set then dps (x, c) = 0 and hence there will be no impact of the Euclidean distance. On the contrary, large values of knear may not be suitable because it may overestimate the amount of symmetry of a point with respect to a particular cluster center. Here knear is chosen equal to 2. Note that dps (x, c), which is a non-metric, is a way of measuring the amount of symmetry between a point and a cluster center, rather than the distance like any Minkowski distance. The basic differences between the PS-distances in [3] and [2], and the proposed dps (x, c) are follows: 1) Instead of computing Euclidean distance between the original reflected point x∗ = 2 × c − x and its first nearest neighbor as in [3] and [2], here the average distance between x∗ and its knear unique nearest neighbors have been taken. Consequently this term will never be equal to 0, and the effect of de (x, c), the Euclidean distance, will always be considered. Note that if only the nearest neighbor of x∗ is considered and this happens to coincide with x∗ , then this term will be 0, making the distance insensitive to de (x, c). But considering knear nearest neighbors will reduce the problems discussed in Figure 1. 2) Considering the knear nearest neighbors in the computation of dps makes the PS-distance more robust and noise resistant. From an intuitive point of view, if this term is less, then the likelihood that x is symmetrical with respect to c increases. This is not the case when only the first nearest neighbor is considered which could mislead the method in noisy situations.
3) In the PS-distances (in Equation 2) the denominator term is used to normalize the point symmetry distance so as to make it insensible to the Euclidean distance. But as shown earlier this will lead to lack of EDD property. As a result, dc can not identify symmetrical interclusters. Unlike this, in dps (Equation 3), no denominator term is incorporated to normalize dsym . Observation: The proposed dps measure will, in general, work well for symmetrical interclusters. Using knear = 2, let the two nearest neighbors of the reflected point of x (in Figure 1) with respect to center c1 are at distances of d1 and d11 respectively. Then dps (x, c1 ) = dsym (x, c1 ) × de1 = d1 +d11 × de1 , where de1 is the Euclidean distance between 2 x and c1 . Let the two nearest neighbors of the reflected point of x with respect to center c2 be at distances of d2 and d12 respectively. Hence, dps (x, c2 ) = dsym (x, c2 ) × d +d1 de2 = 2 2 2 × de2 , where de2 is the Euclidean distance between x and c2 . Now in order to preserve the Euclidean distance difference property (EDD), i.e., to avoid merging of symmetrical interclusters, dps (x, c1 ) should be less than dps (x, c2 ) even when dsym (x, c1 ) ≈ dsym (x, c2 ). Now, dps (x, c1 ) < dps (x, c2 ) d2 + d12 d1 + d11 × de1 < × de2 =⇒ 2 2 1 de1 d2 + d2 =⇒ < . de2 d1 + d11
(5)
From Figure 1, it is evident that, de2 >> de1 , so dde1 θ, point xi is assigned to some cluster m iff de (xi , cm ) ≤ de (xi , cj ), j = 1, 2 . . . K, j = m. In other words, point xi is assigned to that cluster with respect to whose centers its PS-distance is the minimum, provided the amount of symmetricity with respect to that cluster center is less than some threshold θ. Otherwise assignment is done based on the minimum Euclidean distance criterion as normally used in [15] or the K-means algorithm. We also provide a rough guideline of the choice of θ, the threshold value on the PS-distance. It is to be noted that if a point is indeed symmetric with respect to some cluster centre then
2007 IEEE Congress on Evolutionary Computation (CEC 2007)
701
16
16
14
14
12
12
10
10
8
8
6
6
4
4
2
2
2
1.5
1.5
1
1
0.5
0.5
0
0
−0.5
−0.5
0
0
−2 −10
2
−8
−6
−4
−2
0
2
4
6
8
−2 −10
−8
−6
−4
−2
(a)
0
2
4
6
8
−1 −1
−0.5
0
(b)
Fig. 5. Clustered Data1 after application of GAPS (a) for K = 5 (b) for K=6
0.5
1
−1 −1
1.5
−0.5
0
0.5
(a)
1
1.5
(b)
Fig. 7. Clustered Data3 after application of GAPS (a) for K = 3 (b) for K=6 TABLE I D ATA SETS USED
8
7
Name Data1 Data2 Data3 Data4 Data5 Iris Cancer Newthyroid glass
6
5
4
3
2
1
0 −4
Fig. 6.
−3
−2
−1
0
1
2
3
4
5
Clustered Data2 after application of GAPS for K = 2
the symmetrical distance computed in the above way will be small, and can be bounded as follows. Let dmax N N be the maximum nearest neighbor distance in the data set. That is dmax N N = maxi=1,...N dN N (xi ), where dN N (xi ) is the nearest x∗ lies within the max data neighbor distance of xi . Assuming that dmax 3d NN space, it may be noted that d1 ≤ 2 and d2 ≤ N2 N , 2 ≤ dmax resulted in, d1 +d N N . Ideally, a point x is exactly 2 symmetrical with respect to some c if d1 = 0. However considering the uncertainty of the location of a point as the sphere of radius dmax N N around x, we have kept the threshold θ equals to dmax N N . Thus the computation of θ is automatic and does not require user intervention. After the assignments are done, the cluster centres encoded in the chromosome are replaced by the mean points of the respective clusters. Subsequently for each chromosome, clustering metric, M is calculated as defined below: M =0 For k = 1 to K do For all data points xi , i = 1 to n and xi ∈ kth cluster, do M = M + dps (xi , ck ) Then the fitness function of that chromosome, f it, is defined 1 . This fitness function, as the inverse of M , i.e., f it = M f it, will be maximized by using genetic algorithm. Roulette wheel selection is used to implement the proportional selection strategy. The normal single point crossover operation is used here. Crossover probability is selected adaptively as in [4]. Each chromosome undergoes mutation with a probability μm . The mutation probability is also selected adaptively for each chromosome as in [4]. In GAPS, the processes of fitness computation, selection, crossover, and mutation are executed for a maximum number of generations. The best string seen upto the last generation provides the solution to the clustering
702
No of points 850 400 350 300 400 150 683 215 214
dimension 2 2 2 2 3 4 9 5 9
Actual No. Clusters 5 2 3 6 4 3 2 3 6
problem. 22
22
20
20
18
18
16
16
14
14
12
12
10
10
8
8
6
6
4
2
4
2
4
6
8
10
12
14
16
18
20
22
2
2
4
6
8
10
12
(a)
14
16
18
20
(b)
Fig. 8. Clustered Data4 after application of GAPS (a) for K = 6 (b) for K=4
20 15 10 5 0 −5 20 20
10
15 10
0
5 −10
Fig. 9.
0 −5
Clustered Data5 after application of GAPS for K = 4
IV. E XPERIMENTAL R ESULTS The six data sets that are used for the experiments are divided into 2 different groups. The first group consists of five artificially generated 2/3-dimensional data
2007 IEEE Congress on Evolutionary Computation (CEC 2007)
22
TABLE II O PTIMAL VALUES OF THE FIVE SYMMETRY BASED √ VALIDITY INDICES FOR NINE DATA SETS , SEGMENTED USING GAPS CLUSTERING ALGORITHM WHERE K IS VARIED FROM 2 TO n. T HE NUMBER WITHIN BRACKETS IS THE CORRESPONDING CLUSTER NUMBER .
Data Set Data1 Data2 Data3 Data4 Data5 Iris Cancer Newthyroid Glass
Sym-DB Value (K ∗ ) 0.14(5) 0.05(2) 0.04(6) 0.13(6) 0.28(4) 0.18(2) 3.68(2) 5.206076(10) 1.299(5)
Sym-Dunn Value (K ∗ ) 0.577(5) 0.1456(2) 0.565239(3) 2.038660(4) 1.020440(4) 0.502211(8) 0.033323(8) 0.008218(2) 0.044829(8)
Sym-GDunn Value (K ∗ ) 3.4218(5) 17.9135(2) 22.558568(3) 6.079382(6) 2.606002(4) 5.148168(2) 0.147575(2) 0.177528(6) 0.473918(2)
sets. Figures 2(a), 2(b), 3(a), 3(b) and 4 show Data1, Data2, Data3, Data4 and Data5, respectively. The second group consists of four real-life data sets. These are Iris, Cancer, Newthyroid and Glass obtained from (http://www.ics.uci.edu/mlearn/MLRepository.html). The description of the data sets used for the experiment are shown in Table I. Iris data set represents different categories of irises characterized by four feature values. It has three classes Setosa, Versicolor and Virginica. The Wisconsin Breast Cancer data set has two categories in it: malignant and benign. The two classes are known to be linearly separable. The Newthyroid is the Thyroid gland data (‘normal’, ‘hypo’ and ‘hyper’ functioning). Five laboratory tests are used to predict whether a patient’s thyroid belongs to the class euthyroidism, hypothyroidism or hyperthyroidism. The Glass identification data consists of 9 attributes. There are six classes present in the data. The study of classification of types of glass was motivated by criminological investigation. At the scene of the crime, the glass left can be used as evidence, if it is correctly identified. The parameters of the GAPS are as follows: population size=100 and maximum number of generations=30. For GAPS, the crossover and mutation probabilities are chosen adaptively as in [4]. The results reported in the table are the average values obtained over ten runs of the algorithm. √ Here Kmin is kept equal to 2 and Kmax is set equal to n where n is the total number of data points present in the data set. Figures 5(a), 6, 7(a), 8(a) and 9(a) show, respectively, the partitions obtained after application of GAPS-clustering on Data1, Data2, Data3, Data4 and Data5, respectively, for actual number of clusters present in the data sets. Table II shows the optimum values of the newly proposed point symmetry distance based six cluster validity indices, namely, Sym-DB, Sym-Dunn, Sym-GDunn, Sym-PS, Sym-I and Sym√ XB indices, over K = 1 to n number of partitions obtained after application of GAPS-clustering and the indicating partition number for all the nine data sets used here. It can be seen that for Data1, all the indices except Sym-PS is able to find the proper clustering and the proper cluster number. Sym-PS provides K ∗ = 6 as the proper cluster number. The
Sym-PS Value (K ∗ ) 0.082(6) 0.026(2) 0.024(3) 0.056928(4) 0.137344(4) 0.091630(2) 1.840008(2) 2.923031(8) 0.904809(2)
Sym-I Value (K ∗ ) 0.0076(5) 0.049(2) 0.057(3) 0.027737(6) 0.013723(4) 0.049885(3) 0.000522(2) 0.001339(3) 0.006686(6)
Sym-XB Value (K ∗ ) 0.0198(5) 0.000836(2) 0.000855(3) 0.006497(4) 0.024270(4) 0.029(2) 4.88(2) 18.678121(4) 1.12(8)
corresponding segmentation is shown in Figure 5(b). For Data2, GAPS-clustering is able to detect the proper clustering for K = 2 (shown in Figure 6) and all the indices are able to identify this. As like the previous case, for Data3 also GAPS-clustering is able to find the proper partitioning for K = 3 (the corresponding segmentation result is shown in Figure 7(a)) and all the indices except Sym-DB is able to detect this. Optimum value of Sym-DB wrongly indicates six as the proper cluster number. The corresponding partitioning is shown in Figure 7(b). But for Data4, Sym-DB, Sym-GDunn and Sym-I are able to detect the proper clustering (Figure 8(a)) and the proper partition number. Sym-Dunn, Sym-PS and Sym-XB merges two pairs of clusters into two clusters. The corresponding partitioning is shown in Figure 8(b). For Data5, all the indices are able to detect the proper clustering after application of GAPS (the corresponding partitioning is shown in Figure 9). For the four real-life data sets, Iris, Cancer, New-thyroid and Glass, no visualization is possible as these are highdimensional data sets. For these four data sets, the Minkowski Score [16] is calculated after application of GAPS-clustering algorithm. This is a measure of the quality of a solution given the true clustering. Let T be the “true” solution and S the solution we wish to measure. Denote by n11 the number of pairs of elements that are in the same cluster in both S and T. Denote by n01 the number of pairs that are in the same cluster only in S, and by n10 the number of pairs that are in the same cluster in T. Minkowski Score (MS) is then defined as: � n01 + n10 . (8) M S(T, S) = n11 + n10 For MS, the optimum score is 0, with lower scores being “better”. For Iris data set, MS value corresponding to the partitioning obtained by GAPS-clustering for K = 3 is 0.62. As can be seen from Table II, only Sym-I index is able to detect the proper partition number for this data set. Optimum values of Sym-DB, Sym-GDunn, Sym-PS and Sym-XB indices indicate two clusters, which is also often obtained for many other methods for Iris. The performance Sym-Dunn is the worst. For Cancer dataset, MS value corresponding to the
2007 IEEE Congress on Evolutionary Computation (CEC 2007)
703
TABLE III E XECUTION T IME IN S ECONDS BY GAPS WITH AND WITHOUT K D TREE BASED SEARCH
Data set Data3 Data4 Data5
GAPS with Kd tree 77 90 128
GAPS with out Kd tree 5280 3870 6112
partitioning obtained by GAPS-clustering for K = 2 is 0.367056. Sym-DB, Sym-GDunn, Sym-PS, Sym-I and SymXB indices are able to indicate this partitioning. But again for this data set, the performances Sym-Dunn is the worst. For Newthyroid data set, only Sym-I-index is able to detect the proper cluster number (3 in this case) along with GAPSclustering (see Table II). The corresponding MS value is 0.58. No other validity indices are able to detect the proper cluster number along with GAPS-clustering. For Glass data set, again only Sym-I index is able to detect the proper cluster number. The MS score of the corresponding partitioning is 0.7223. No other indices are able to detect the proper partitioning or the proper partition number. From the results on nine data sets, obtained by six newly developed point symmetry distance based cluster validity indices along with the GAPS-clustering technique, it is revealed that Sym-I index is able to detect the proper cluster number in almost all the cases. It may be noted that for real-life data sets having higher number of dimensions, most of the symmetry based cluster validity indices do not perform well. This may be due to the inability of the most of the cluster validity indices to handle higher dimensional data sets. More experiments have to be done in order to find out the proper reason of the inability of the proposed indices for detecting number of clusters from data sets having higher number of dimensions. A. Effectiveness of Using Kd-tree for Nearest Neighbor Search Note that the proposed implementations of GAPS and point symmetry based distance utilize a Kd-tree structure to reduce the time required for identifying the nearest neighbors. In order to demonstrate the time gain obtained, GAPS is also executed without using the Kd-tree data structure. GAPS is implemented in C and executed on a PIV processor, 1.6GHz speed, running Linux. Table III provides the time required for the two cases for three data sets Data3, Data4 and Data5. As is evident, incorporation of Kd-tree significantly reduces the computational burden of the process. V. D ISCUSSION
AND
C ONCLUSION
Identifying the proper number of clusters and the proper partitioning from a data set are two crucial issues in unsupervised classification. Six newly proposed point symmetry distance based cluster validity indices which mimic the existing six cluster validity indices are proposed in this article. These newly developed indices exploit the property of point based symmetry to indicate both the appropriate number of clusters as well as the appropriate partitioning. Here point symmetry based distance is used in place of
704
Euclidean distance in the definitions of the well-known six cluster validity indices, namely, DB-index, Dunn-index, Generalized Dunn’s index, PS-index, I-index and XB-index. The performance of these six newly developed point symmetry based indices, named as Sym-DB index, Sym-Dunn index, Sym-GDunn index, Sym-PS index, Sym-I index and Sym-XB index, respectively, are evaluated on five artificially generated and four real-life data sets. Results show that Sym-I index is more effective than the other five in finding the proper cluster number and the proper partitioning from datasets with different shapes and convexity as long as the clusters present in them are symmetric in nature. As the point symmetry based distance computation is a time consuming process, Kd-tree based nearest neighbor search is used to reduce its time complexity. Future work includes incorporation of the newly developed point symmetry based distance in many other existing cluster validity indices. Performance of these symmetry based validity indices need to be checked along with many other existing clustering algorithms on many other real-world data sets. R EFERENCES [1] B. S. Everitt, S. Landau, and M. Leese, Cluster Analysis. London: Arnold, 2001. [2] C. H. Chou, M. C. Su, and E. Lai, “Symmetry as a new measure for cluster validity,” in 2nd WSEAS Int. Conf. on Scientific Computation and Soft Computing, Crete, Greece, 2002, pp. 209–213. [3] M.-C. Su and C.-H. Chou, “A modified version of the k-means algorithm with a distance based on cluster symmetry,” IEEE Transactions Pattern Analysis and Machine Intelligence, vol. 23, no. 6, pp. 674–680, 2001. [4] S. Bandyopadhyay and S. Saha, “GAPS: A clustering method using a new point symmetry based distance measure,” Pattern Recog., Accepted (March, 2007), URL: http://dx.doi.org/10.1016/j.patcog.2007.03.026. [5] M. R. Anderberg, Computational Geometry: Algorithms and Applications. Springer, 2000. [6] R. C. Dubes and A. K. Jain, “Clustering techniques : The user’s dilemma,” Pattern Recognition, vol. 8, pp. 247–260, 1976. [7] D. L. Davies and D. W. Bouldin, “A cluster separation measure,” IEEE Transactions Patt. Anal. Mach. Intell., vol. 1, pp. 224–227, 1979. [8] J. C. Dunn, “A fuzzy relative of the ISODATA process and its use in detecting compact well-separated clusters,” J. Cyberns., vol. 3, pp. 32–57, 1973. [9] X. L. Xie and G. Beni, “A validity measure for fuzzy clustering,” IEEE Transactions on Pattern Analysis and Machine Intelligence, vol. 13, pp. 841–847, 1991. [10] U. Maulik and S. Bandyopadhyay, “Performance evaluation of some clustering algorithms and validity indices,” IEEE Transactions on Pattern Analysis and Machine Intelligence, vol. 24, no. 12, pp. 1650– 1654, 2002. [11] C. H. Chou, M. C. Su, and E. Lai, “A new cluster validity measure and its application to image compression,” Pattern Analysis and Applications, vol. 7, pp. 205–220, 2004. [12] G. W. Milligan and C. Cooper, “An examination of procedures for determining the number of clusters in a data set,” Psychometrika, vol. 50, no. 2, pp. 159–179, 1985. [13] J. C. Bezdek and N. R. Pal, “Some new indexes of cluster validity,” IEEE Transactions Systs., Man Cyberns., vol. 28, pp. 301–315, 1998. [14] D. M. Mount and S. Arya, “ANN: A library for approximate nearest neighbor searching,” 2005, http://www.cs.umd.edu/∼mount/ANN. [15] U. Maulik and S. Bandyopadhyay, “Genetic algorithm based clustering technique,” Pattern Recog., vol. 33, pp. 1455–1465, 2000. [16] A. Ben-Hur and I. Guyon, Detecting Stable Clusters using Principal Component Analysis in Methods in Molecular Biology, M. Brownstein and A. Kohodursky, Eds. Humana press, 2003.
2007 IEEE Congress on Evolutionary Computation (CEC 2007)