PHYSICS OF PLASMAS 17, 013702 共2010兲
On the influence of wakefields on three-dimensional particle arrangements M. Kroll,a兲 J. Schablinski, D. Block, and A. Piel IEAP, Christian-Albrechts-Universiät, D-24098 Kiel, Germany
共Received 25 November 2009; accepted 3 December 2009; published online 8 January 2010兲 The role of wakefields on the three-dimensional 共3D兲 particle arrangement in finite dust clouds at low neutral gas pressures is investigated experimentally. Using a novel stereoscopic digital in-line holography approach for the instantaneous measurement of the 3D particle positions, the structural properties of finite dust clouds are studied. The competition of a nested shell structure 共known from Yukawa balls兲 and vertical particle chains 共known for particle clouds confined in the plasma sheath兲 results in a markedly different particle arrangement. With experiments studying the dynamical response in a two-particle system for identical plasma and confinement conditions, we show that the presence of an ion focus in the wake of the particle is responsible for the observed structural differences. © 2010 American Institute of Physics. 关doi:10.1063/1.3276741兴 I. INTRODUCTION
The discovery of spherical finite three-dimensional 共3D兲 dust clouds1,2 in a laboratory plasma has stimulated vivid research activities to explore their structural and dynamical properties. Especially Yukawa balls1 turned out to allow for a detailed comparison of experiment and theory.3 It was observed that Yukawa balls feature a void-free structure of nested shells with a hexagonal order of the particles within shells.1,4,5 Hence, Yukawa balls turned out to be a close relative of laser cooled ions in traps6,7 except for the fact that the Coulomb interaction of the particles is shielded by the ambient plasma. As a result the shell population and finally the radial density profile of both systems differ.8–10 With the recent development of true 3D diagnostics,2,11–13 which allow the instantaneous measurement of all 3D particle positions with sufficient temporal and spatial resolution, the dynamical properties of Yukawa balls including normal modes,14 phase transition, and wave propagation are now accessible. However, the excitation and observation of dynamical processes is a sophisticated task. Typically Yukawa balls are confined at neutral gas pressures of p ⬎ 20 Pa.1,15 Thus, the strong Epstein friction with the neutral gas results in quite high damping rates and therefore the excitation and analysis of dynamical processes are problematic. Normal modes, for example, are subject of strong damping and the resulting broad mode spectra14 are difficult to compare to theoretical predictions.16,17 The only solution to this problem is experiments at low neutral gas pressure. For p ⬍ 5 Pa the damping rates are moderate and dynamical process can be observed and excited. Unfortunately, the entire discharge conditions change if the neutral gas pressure is changed and the necessary particle confinement15 is generally not achieved. The thermophoretic and the electrostatic forces no longer compensate gravity for massive particles with a radius of a few micrometers. However, if large hollow particles are used, a confinement should be feasible due to the larger charge-to-mass ratio. For such particles the gravitational force is almost a兲
Electronic mail:
[email protected].
1070-664X/2010/17共1兲/013702/10/$30.00
identical to that acting on small, massive particles, but thermophoresis and electrostatic forces are stronger. First experiments have shown that a confinement of hollow glass spheres is generally feasible,13 but the structural properties of these dust clouds were not investigated in detail. Especially, whether the particles still form Yukawa balls is unknown. Two simple considerations show that the question is not easily answered. On the one hand, a larger particle should carry a higher charge due to its larger radius. This should result in a stronger coupling of the particles, which will lead to highly ordered crystalline structures. On the other hand, the increasing charge on the particles enhances the deflection of ions streaming downward to the electrode and a wakefield and ion focus might establish behind each particle. In addition, this process should be supported by the larger mean free path at low gas pressure. The resulting anisotropy in the particle interaction potential should affect the structural properties of the dust cloud. From the plasma sheath it is well known that a strong ion focus leads to the formation of vertical particle chains which are typical for plasma crystals trapped in the plasma sheath. Several results show that the structure of plasma crystals in the plasma sheath is strongly influenced by the strength of the ion focus and the confinement potential. Plasma crystals with simple-hexagonal order18 as well as pure bcc or fcc order19 or a mixture of all of them20,21 have been reported. If one compares these experiments, it turns out that small particles and/or high gas pressure allow to form bcc/fcc order while large particles and low gas pressure cause the formation of chains. This observation is consistent with the above mentioned processes, i.e., that an ion focus can be avoided with small particles or frequent collisions of the ions with the neutral gas. Unfortunately this simple picture is modified by simulations by Lampe et al.22 They showed that an external confinement can shift neighboring chains by half an interparticle distance in vertical direction. This might lead to fcc-/bcc-like particle arrangements in extended dust clouds. An influence of the confinement potential on two-particle systems has been studied experimentally23–26 and the results basically agree with the simulations of Lampe et al.22 However, for
17, 013702-1
© 2010 American Institute of Physics
Phys. Plasmas 17, 013702 共2010兲
extended dust clouds, this effect has not yet been confirmed experimentally. Therefore, it is not straightforward to exclude the existence of an ion focus and rely on an isotropic interaction potential if particles in neighboring planes are not aligned. Thus, the experiments presented in this paper aim at a characterization of the structural properties of small dust clouds consisting of large particles. The question of whether these dust clouds are Yukawa balls is closely linked to the quest to determine to what extent confinement and ion focus are responsible for the observed particle arrangement. Thus it tackles the question of whether the simulation results of Lampe et al.22 are relevant for our experiments or not. In Sec. II the experimental setup for the confinement and diagnostic of dust clouds is presented. Here, especially the diagnostic is of interest. We will introduce a new stereoscopic in-line holography 共SDIH兲 setup, which is a significant improvement of our earlier digital in-line holography 共DIH兲 setup.13 The numerical reconstruction of the holograms and subsequent particle tracking are briefly described in Sec. III. Section IV deals with the confinement of dust clouds at low neutral gas pressures and describes their structural properties. In a second set of experiments 共Sec. V兲, we investigated the particle interaction for our discharge conditions and show whether an ion focus is present or not in order to explain the observed particle arrangement in the first experiment. II. EXPERIMENTAL SETUP
The experiments are performed in a capacitively coupled rf discharge at 13.56 MHz in argon gas. The chamber contains of a powered circular electrode that is surrounded by a grounded vacuum vessel with four windows for side-on observation. The electrode has a diameter of 7 cm and is heated 共T = 40 ° C兲 to establish a temperature gradient 共ⵜT ⬃ 2 ° C / cm兲 between the electrode and the vacuum vessel, which is at room temperature. For horizontal confinement, a glass box27 of 25 mm side length is used that is open at the bottom and top. Our experiments are performed with hollow glass microspheres of 共19⫾ 2兲 m diameter. Compared to solid melamine formaldehyde particles these particles have two advantages. First, due to their better chargeto-mass ratio it is possible to perform experiments at different plasma conditions. Typical discharge parameters are rf amplitudes of 共70– 120兲Vp.p. and neutral gas pressures of just pAr = 0.5– 6 Pa. Thus, the particle motion is only weakly damped and allows us to access very different coupling regimes 共solid, liquid, and gaseous states兲. Second, the particles are large enough to give an acceptable ratio of object wave and reference wave for the holographic recording. In our case, particles with a diameter ⱖ10 m are detectable. Using bigger particles provides a higher intensity of the object wave and thus increases the contrast of the hologram. The SDIH system is an improvement of our DIH setup.13 It consists of two identical in-line setups with perpendicular orientation of their optical axes 共Fig. 1兲. The coherent light source is a 250 mW Nd:YAG 共yttrium aluminum garnet兲 laser at = 532 nm that is split into two beams of equal
Cam B
Kroll et al.
laser
013702-2
NDF M
Cam A
x
BE M
BS
M
y
FIG. 1. Schematic setup of SDIH. A laser beam 共532 nm兲 is split in two beams of equal intensity 共BS兲. After expansion of each beam by a factor of 30 共BE兲, the beams are deflected by mirrors 共m兲 to illuminate the object. To avoid saturation of the CMOS sensors, a NDF is mounted in front of each camera.
intensity. Behind the beam splitter each beam is expanded to 30 mm diameter. Thus, it illuminates the whole confinement region. Each of the in-line setups is equipped with a Photon Focus MV-D1024E camera 共cameras A and B兲. These cameras feature a 10.9⫻ 10.9 mm2 complementary metal oxide semiconductor 共CMOS兲 sensor with 1 Mpixel, 12 bit resolution, and pixel size of 10.6 m. Both cameras are operated synchronously at frame rates up to 150 fps and with an exposure time of less than 100 s. To avoid saturation of the CMOS sensor, a neutral density filter 共NDF兲 is mounted in front of each camera. All optical components are mounted on an air-damped optical table with a large central bore of 50 cm in diameter, in which the plasma chamber is placed. This provides an optimized vibrational decoupling of the noisy vacuum system from the optical setup. A three-axis translation stage is used to position the entire chamber with respect to the optical setup. This defines the following coordinate systems for camera i 共i = A , B兲: xi 共zi兲 denotes the horizontal 共vertical兲 axis on the CMOS sensor and its origin is set to the lower left corner of the image. y i is along the optical axis and points from the CMOS sensor toward the dust cloud. III. NUMERICAL RECONSTRUCTION AND PARTICLE TRACKING
The principle of the holographic recording process uses the interference of an object wave and a reference wave. In the following, we will describe the recording and reconstruction process for a single DIH setup. In our optical setup 共Fig. 1兲, the spherical particles are illuminated by the plane wave of the expanded laser beam. A part of the light is scattered by the particles and forms the spherical object wave O. The unscattered part serves as a reference wave R, see Fig. 2共a兲.
Phys. Plasmas 17, 013702 共2010兲
On the influence of wakefields…
recording medium
a)
b) y
a) d
b)
B
C I(d)
013702-3
Δr
d
A
z´
z
x,z
c) x
x´
x
FIG. 3. Principle of the particle tracking. 共a兲 A particle detection in each reconstruction plane yields the x and z positions and the intensity of the particle image in these planes. The y position is given by the maximum of a quadratic fit of the particle image intensity. 共b兲 A and B mark the particle positions obtained by the corresponding camera. The final 3D particle position 共c兲 is determined by the combination of the results of both cameras. The dashed lines denote the optical axes of the cameras.
d0 d0+ N!Δ ... d0
g共x,z,x⬘,z⬘兲 =
reconstruction planes
hologram plane
FIG. 2. 共a兲 Recording of the hologram. Part of the laser light is scattered by the particles and forms the spherical object wave. The resulting interference pattern is recorded by the sensor. 共b兲 The typical hologram of a point-shaped object is a FZP, consisting of a concentric set of dark and bright rings. The depth information is encoded in the ring spacing. 共c兲 Numerical reconstruction of the hologram. Solving Eq. 共1兲, the complex wave field is computed for planes perpendicular to the optical axis. The distance of the plane closest to the hologram is y = d0.
Since R and O have a fixed phase relationship, their interference pattern is detectable with the CMOS camera. The spatial intensity distribution on the sensor is given by I共x , z兲 = 兩O + R兩2. The typical hologram of a point-shaped object, which is a reasonable approximation for a spherical dust particle, is shown in Fig. 2共b兲. It is a Fresnel zone pattern 共FZP兲 consisting of a concentric set of dark and bright rings. To receive the entire 3D particle information, which is encoded in the two-dimensional hologram, it is necessary to reconstruct the hologram by illuminating the hologram again with the reference wave. In digital holography, this is done numerically solving the Fresnel–Kirchhoff integral,
冕冕 ⬁
⬁
−⬁
−⬁
h共x⬘,z⬘兲Rⴱ
exp共− 2i/兲 dx⬘dz⬘ 共1兲
= 冑共x⬘ − x兲2 + 共z⬘ − z兲2 + d2 .
共2兲
U共x,z兲 =
i
with
The reconstructed complex wave field U共x , z兲 is formed by superposition of all secondary waves, which are radiated by the illuminated hologram h共x⬘ , z⬘兲, see coordinate system defined in Fig. 2共c兲. Therefore, Eq. 共1兲 can be understood as the mathematical formulation of Huygens’ principle. Rⴱ is the complex conjugate of R. We solve the Fresnel–Kirchhoff integral using a standard convolution approach,28 U共x,z兲 = I−1兵I共hRⴱ兲I共g兲其,
共3兲
where I denotes the Fourier transform. The convolution kernel is
i exp共− 2i/兲 .
共4兲
A detailed description of this technique was given in Ref. 29. The basic reconstruction scheme for an extended object is shown in Fig. 2共c兲. The solution of Eq. 共3兲 is the complex wave field at a certain distance d from the hologram plane. Thus, to reconstruct a 3D object, it is necessary to solve Eq. 共3兲 for consecutive values of d. To get an image of the reconstructed object in that plane, the absolute value of the complex wave field is squared. The determination of the 3D particle coordinates is divided into two steps. First, a particle detection30,31 is performed in each plane. This gives intensity, size of the particle image, and the x and z positions in every plane, see Fig. 3共a兲. For holography the difficult task is the accurate determination of the position along the optical axis. There are different methods to obtain the depth information. In our previous work13 we have shown that a single DIH setup is able to determine 3D particle position with good accuracy using the complex amplitude technique.32 None the less, to reach a high spatial resolution the interplane distance has to be in the range of the pixel size of the sensor. Considering the dimensions of our particle clouds and an interplane distance of 10 m, typically 1000 planes have to be calculated for each hologram which requires notable computational efforts especially if holographic movies are considered. However, to extract the x and z positions with high accuracy and to obtain just a good estimate for the y position, it is possible to choose the interplane distance at least a factor of 10 larger. Thus, we have extended our single DIH system by a second orthogonal in-line setup which is synchronously operated. This way each DIH setup 共i = A , B兲 gives us a set of xi, y i, and zi coordinates where the y position is less accurate but due to the orthogonal setup, this inaccuracy cancels because xA = −y B and xB = y A. Thus, the second step of our reconstruction requires a transformation of both coordinate sets to a common coordinate system where x = xA = −y B + ⌬x, y = y A = xB + ⌬y and z = zA + ⌬z. Here ⌬x, ⌬y, and ⌬z are the offsets of both optical axes. In addition we defined ⌬z = 0 at the electrode. The final allocation of a particle is illustrated in Fig. 3共b兲. The particle position received from camera A 共camera B兲 is marked with
Phys. Plasmas 17, 013702 共2010兲
Kroll et al.
A 共B兲. The dotted lines are the optical axis of the corresponding cameras. The final particle position C is given by pairs of positions A and B with a vertical displacement less than 20 m and a radial displacement less than 200 m. Although we have to record and reconstruct twice the number of holograms, this setup allows to reduce the time needed for reconstruction by typically 80% compared to a single DIH setup. As an additional benefit, the spatial resolution in all direction is less than the pixel size.
15
z position (mm)
013702-4
a)
14 13 12
IV. 3D CLUSTER
11
2
y position (mm)
Although our setup is similar to those used for Yukawa balls,1,11,12,27 our particles are larger and trapped at different plasma conditions 共neutral gas pressure of just 3 Pa and a rf amplitude of only 75 Vp.p.兲. Thus, three aspects are of interest: First, is it possible to trap strongly coupled particle clouds? Second, how do the particles arrange? Do they show the typical structure of Yukawa balls? Third, if not, how can this be explained? For this purpose we have confined 150 particles inside the glass box and the electrode was heated up to T = 40 ° C. To investigate the structure of the dust clouds we use the SDIH setup described in Sec. II. Figure 4共a兲 shows a side view of the cloud. All particle positions are projected into the x-z plane. x = y = 0 corresponds to the center of mass. As mentioned before, the z positions are with respect to the lower electrode. Thus, the cluster is confined in the upper half of the glass box. This is comparable to previous experiment with Yukawa balls.1,11,12,27 The root-mean-square displacement of the particles is about 35 m from their equilibrium positions. In terms of the interparticle distance this is less than 5%. According to the Lindemann criterion,33 this cluster is in a solid state that is again comparable to Yukawa balls. Thus, it is possible to confine larger particles at lower neutral gas pressures into finite dust clouds. However, concerning the structure, there is a notable difference compared to Yukawa balls. While the side view 关Fig. 4共a兲兴 does not show any signs of a highly ordered particle arrangement, the situation differs if the cloud is viewed from the top 关Fig. 4共b兲兴. The particles seem to form chains that point away from the position xc ⬇ 0.5 mm and y c ⬇ 1 mm. A closer inspection yields that these particle chains consist of particles at different heights. For all chains with a notable length the uppermost particle is closest to the position 共xc , y c兲 and the distance of the particles from 共xc , y c兲 increases with decreasing levitation height. Thus, the particles form almost vertical chains. At closer inspection, these chains are visible in Fig. 4共b兲 as well, i.e., at least a tendency to find particles on top of each other. Such a chain formation is well known from plasma crystals trapped in the plasma sheath.19–22 In this region, there is a steady flow of positive ions downward to the electrode. These ions are focused directly downstream of a negatively charged particle and form a positive space charge which can attract another negatively charged particle. Because of this ion focus, the shielded interaction between the particles is not the isotropic Debye potential, but rather takes the form of a wakefield24,26,34,35 and the particles typically align into vertical chains that show hexagonal order in the horizontal
-2
-1 0 1 x position (mm)
2
-2
-1 0 1 x position (mm)
2
b)
1 0 -1 -2
FIG. 4. 共a兲 Side view of the particle cloud. All particle positions are projected into the xz plane. The dust cloud is confined in the upper half of the glass box. At first glance, signatures of a highly ordered particle arrangement are not visible. 共b兲 Top view of the particle cloud. The particles seem to be aligned into vertical chains.
plane. These crystals feature a simple-hexagonal structure with distinctive planes stacked on the other. Typically, the interparticle distance in horizontal direction is ah ⬇ 1.4av, where av is the vertical distance between the planes.20 Looking at Fig. 4共a兲, the formation of distinctive horizontal planes cannot be confirmed for our particle cloud. For a further structure analysis, the particles were allocated into chains. By doing so, 25 chains with an average length of six particles could be identified. The chains have an average vertical distance of neighboring particles of about av共665⫾ 45兲 m. The mean horizontal separation between the chains is about ah ⬇ 共1.18⫾ 0.1兲av. These typical values can be also seen in the pair correlation function g共r兲 in Fig. 5共a兲. The pair correlation functions show several peaks and a fast decay for increasing radial distance. The decay is caused by the finite size of the cloud and the related missing correlations near the surface. The dominant peak corresponds roughly with the horizontal distance between the chains,
013702-5
1
Phys. Plasmas 17, 013702 共2010兲
On the influence of wakefields…
a)
15
ah
0.8
14.5
av
0.6
g(r)
14
0.4
13.5
φ
0 0
1
2
3
4
5
r (mm) 7
b)
y position (mm)
6 5
z position (mm)
0.2
13 12.5 12 11.5
4
11
3
10.5 2
16
1
2
3 4 5 x position (mm)
6
10
c)
z position (mm)
15
1
2
3 4 5 chain number
6
7
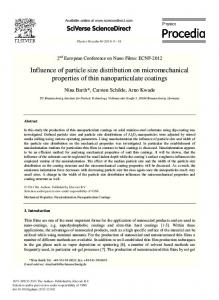
FIG. 6. Comparison of the z positions of neighboring chains. Chain 1 denotes a chain in the center of the cluster. The z positions of its particles are marked by circles. Surrounding chains 共2–7兲 are marked by dots and boxes. Two different types of chains can be distinguished; chains with particles located at nearly the same z position as chain 1 are marked by boxes. Chains which are displaced in height by half an interparticle distance are marked with dots.
14 13 12 11 10 0
0.5
1 1.5 radius (mm)
2
FIG. 5. 共a兲 Pair correlation function of the particle cloud shows distinctive peaks which suggest a nearest neighbor order. 共b兲 Midplane of the cluster. Markers correspond to different types of chains. A regular structure cannot be identified. Both types of chains seem to be randomly distributed. 共c兲 Radial distribution of the particles with respect to the z position. At least the first two outer shells are visible.
whereas the peak in its left shoulder matches the vertical distance between the particles. The remaining peaks correspond to second order neighbors. Although the pair correlation function shows well-defined interparticle distances within the cloud, no preferential levitation heights are visible
in Fig. 4共a兲. Thus, the observed structure differs notably with respect to those observed in the plasma sheath and in Yukawa balls. To analyze the orientation of neighboring chains with respect to each other, the z positions of particles belonging to these chains are compared in Fig. 6. Here, chain 1 denotes a chain that is located in the center of the cluster. The z positions of its particles are marked by circles. The z positions of the surrounding chains 共2–7兲 are marked by dots and boxes. The numbering of the chains is arbitrary. For a better comparison with the other chains, the z positions of chain 1 are also indicated by dashed lines. First, Fig. 6 clearly shows that all chains have nearly the same vertical distance of neighboring particles. Second, two types of chains can be distinguished. The first ones are plotted with dots 共chain= 2 – 4兲. The particles of these chains are located at interplane positions with respect to the vertical particle positions of chain 1. The displacement is about half the interparticle distance of
013702-6
Phys. Plasmas 17, 013702 共2010兲
Kroll et al.
neighboring particles 共zj − zj+1兲 / 2 and is found for every particle of these chains. Considering the horizontal distance between neighboring chains, these particles are oriented at an angle of ⬇ 65° with respect to the vertical axis of chain 1 共see Fig. 6兲. The particle heights of the second type of chains are marked with boxes 共chain= 5 – 7兲 in Fig. 6. Compared to chain 1, the particles of these chains are located near the same vertical positions. These results clearly show that the vertical displacement of chains occurs. Nevertheless, the existence of an ion focus has to be verified as well to show that this displacement corresponds to those reported by Lampe et al.22 However, it is instructive to study some other structural properties of the dust cloud first. Figure 5共a兲 shows a cross section of the cluster around the midplane. The two different markers correspond to the type of chain. For a crystalline structure with a simple-hexagonal order,20,21 where the particles of neighboring chains form horizontal planes, only one marker type would appear. A crystal which features a fcc or bcc structure to minimize the potential energy19–22 would show both marker types, but the markers would alternate on neighboring positions, i.e., a marker of one type would be surrounded by the other one. In our case both types of chains are randomly distributed within the cluster. Each chain is surrounded by displaced chains and chains with equal vertical particle positions. Thus, there are no regions with uniform fcc, bcc, or simple-hexagonal structure. This is attributed to the finite size of the cluster. It is the external confinement that has a notable influence on the structural properties of the cluster. First, the vertical and horizontal dimensions of the cluster are almost equal and the cluster has a well-defined outer boundary in radial direction 关see Fig. 5共b兲兴. Second, the inspection of the radial distribution of the particles with respect to the z position 关Fig. 5共c兲兴 shows a shell structure. At least the outer shell is clearly formed 共see radial distances r ⱖ 1.5 mm兲. In contrast to Yukawa balls, inner shells are not clearly detectable. Although a notable concentration of particles is seen around r = 1.3 mm and r = 0.5 mm, a number of particles are found in between these radial positions. A close inspection of Fig. 5共b兲 reveals that this deviation from a pronounced shell structure is related to vertically shifted chains 关see, e.g., chains at 共x , y兲 = 共3.5, 3.2兲 mm, 共x , y兲 = 共2.8, 3.8兲 mm, and 共x , y兲 = 共4.2, 4.1兲 mm兴. Therefore, beside the formation of vertical chains, the cluster shows also structural properties 共shell formation兲 which are known from Yukawa balls. We attribute this shell formation to the finite size and the external confinement because the occurrence of shells has only been observed for finite systems so far.1,16,36 The vanishing of a pronounced shell structure due to a different principle of arrangement is an interesting observation because it allows for a different interpretation of previous results on Yukawa balls. Arp et al.1 found for large Yukawa balls 共N ⬎ 2800兲 that only the first two outer shells are clearly detectable while toward the center of the cloud the density modulation decreased rapidly and finally vanished. Lacking a powerful 3D diagnostic they concluded that this lack of radial order is induced by particle motion, i.e., the fact that the center of the dust cloud is in a liquid state.
a)
b)
c)
d)
FIG. 7. Schematic sketch of the experimental procedure. 共a兲 Two particles are trapped inside the glass box and align vertically. 共b兲 The lower particle is removed by a laser pulse from its equilibrium position. 共c兲 The laser is switched off before the lower particle reaches its position of maximum height. 共d兲 The relaxation of the system is observed and analyzed.
However, this interpretation is not that clear in view of the results presented here. The lack of a shell-like structure might indicate a change in the structural properties toward fcc or bcc order as well. Thus, the structural analysis of the cluster reveals that it is possible to confine finite spherical dust clouds in a solid state even at low neutral gas pressures. The crystalline structure of these clusters is rather complex. There is a competition of order between a shell-ordered structure and a chain dominated volume order. The formation of chains inside the cluster suggests that the structural difference to earlier observations of Yukawa balls is mainly caused by the focus of ions streaming downward toward the lower electrode. So far, an ion focus and the related wakefield was negligible in case of Yukawa balls because they were confined at different conditions. First, the use of smaller particles of 3.4 m diameter with less charge on the surface reduces the strength of the ion focus. Second, these systems were trapped at neutral gas pressures which are at least one magnitude higher compared to our experiments. In this plasma regime, the ion motion is significantly distorted by frequent collisions, which also destroys an ion focus.37 Thus, it is essential to answer the question of whether an ion focus exists for our conditions in order to make a final statement on the structure. V. ION FOCUS
To confirm the presence of an ion focus for our conditions, we performed a separate series of experiments, which allow us to investigate the interaction between two particles without changing the confinement forces and without any unknown forces acting on the particles. Thus, it partly resembles previous experiments which focused on strength and topology of the wake potential.24–26,38 Our experimental procedure is illustrated in Fig. 7. Two vertically aligned particles are trapped inside the glass box, Fig. 7共a兲. Here, the experimental conditions are identical to those described in Sec. IV. This includes the dimensions of the glass box, the size of the particles, the neutral gas pressure, and the rf amplitude. The only difference is the reduced number of particles. With a laser pulse of about 500 ms length provided by a 20 mW HeNe laser, the lower particle is kicked sideward. Once the particle has left its equilibrium position below the other particle, the laser is switched off. The accelerated particle moves upward and pushes the upper particle sideward, Fig. 7共b兲 and 7共c兲. As soon as the lower particle reaches a maximum value of z, we know for sure that the manipulation laser is off. Thus, the particles are just
013702-7
x position (mm)
a)
Phys. Plasmas 17, 013702 共2010兲
On the influence of wakefields…
1
0.5 0 -0.5 -1
y position (mm)
b)
1
0.5 0 -0.5 -1
z position (mm)
c)
15
14.5 14 13.5 0
1
2
3 time (s)
4
5
6
FIG. 8. x, y, and z positions of both particles vs time. The positions of the upper particle are marked by the solid line and those of the lower one by the dashed line. After the lower particle is lifted by a laser pulse it remains in a metastable position 共t = 1 – 4.8 s兲 until the distance between the particles reaches a critical value. Then a sudden transition of the particles into their inertial positions occurs.
subject to their interaction, the external confinement potential, and the friction with the neutral gas. Thus the laser has transferred kinetic energy into the system and now the relaxation of the system can be observed and analyzed, Fig. 7共d兲. The x, y, and z positions versus time of both particles are shown in Figs. 8共a兲–8共c兲. The positions of the upper particle are plotted by the solid line and those of the lower by the
dashed line. The x and y positions are given with respect to the center of mass at t = 0 s. Since the x and y positions are identical for both particles, they are perfectly aligned at the beginning. This is the first indication for a wake field potential and a related ion focus.24,25,38 As mentioned before, the z positions give the distance to the lower electrode. Thus, compared to the particle cloud shown in Fig. 4共a兲, these two particles are levitated at a height that corresponds to the center of the cloud presented in Sec. IV. Although the vertical separation of the particles 共av = 1.1 mm兲 is slightly larger here, the experiments are performed at identical plasma parameter. The slight increase in the interparticle distance is related to significantly reduced number of particle in the trap. Please note that this increase is typical for a screened Coulomb interaction.8,9 In the first phase of the experiment 共t ⬍ 1 s兲, the lower particle is lifted by the laser pulse and pushes the upper one sideward, see Figs. 8共a兲–8共c兲. While the upper particle shows a damped oscillation around its new position, the lower particle moves downward into its new equilibrium position and the particles are nearly horizontally aligned. In the second phase 共t = 1 – 4.8 s兲 all oscillations have decayed and both particle show only small thermal motion. It is interesting to notice that the lower particle, after it is lifted, does not immediately return to its initial position. Although the discharge conditions and hence the strength of the vertical confinement force remains constant, both stable vertical and horizontal particle arrangements are found. Such bistable particle arrangements were predicted by Lampe et al.22 at an intermediate range of the vertical confinement potential. Taking a closer look at Fig. 8共c兲, we find that the horizontal arrangement is only metastable. The lower particle starts to subside. This drift of the particle is very slow. The vertical distance between the particles increases and the horizontal distance decreases. In the third phase 共t ⬎ 4.8 s兲, the lower particle suddenly leaves the metastable position and after some damped oscillations, both particles return to their initial positions at t = 0 s. A detailed analysis of the transition between the second and third phases, which is gray shaded in Fig. 8, is shown in Figs. 9共a兲 and 9共b兲. The absolute distance between the particles for 4 s ⬍ t ⬍ 6 s is plotted in Fig. 9共a兲. The curve shows a decrease in the distance between the particles until t = 4.8 s. Then, the distance suddenly increases again. At this point, the transition from the horizontal to the vertical alignment takes place. This sudden transition is well known from previous works. Steinberg et al.23 induced a transition from a vertical to a horizontal alignment and backward by varying the rf amplitude or the neutral gas pressure and thus the strength of the vertical confinement force. Beside the sudden transition, they also found that the transition shows a hysteresis with respect to rf amplitude and neutral gas pressure. They related this behavior to a symmetry breaking of the interparticle potential, i.e., the presence of an ion focus. To obtain the exact transition point in our experiments, the absolute acceleration of the lower particle is calculated; see Fig. 9共b兲. Because only the relative motion of the particles is of interest, the coordinates of the lower particles are transformed into the reference system of the upper particle for this
1.2 1.1 1 0.9 0.8
2
0
-0.2 -0.4 -0.6 -0.8 -1
0.7
1.5
|a| (m/s )
a)
a)
-1.2
b)
b)
1
0.5
0 4
4.5
5 time (s)
5.5
6
FIG. 9. 共a兲 Absolute distance between the particles for t = 4 – 6 s. Until t ⬇ 4.8 s a slow decay of the distance is visible. Then the distance increases suddenly which indicates a transition to the vertical alignment. 共b兲 Absolute acceleration of the lower particle in the reference system of the upper one. The start of the transition is marked by the dashed line. Here, the acceleration exceeds a value which is typical for thermal fluctuations.
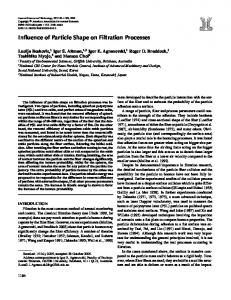
purpose. The transition starts as soon as the absolute acceleration exceeds those related to thermal motion. This point is marked by the dashed line in Fig. 9 and leads to a critical distance about ac = 780 m in Fig. 9共a兲. For statistical reasons, the experiment was repeated several times but each time the lower particle moves in a different direction, which allows us to analyze the symmetry of the observed process. It is found that the particle motion is qualitatively the same and fully independent in which direction the lower particle leaves its initial position due to the laser pulse. Thus for simplicity, Fig. 10共a兲 shows the trajectory of the lower particle during the transition for every experimental cycle projected into the r-z plane in cylindrical coordinates. As mentioned before, the coordinates of the lower particle were transformed into the reference system of the upper particle; therefore the upper particle is located at r = z = 0 and marked by a circle. The measured positions along each trajectory of the lower particle are marked by dots, the lines between the dots are a spline fits to illustrate the motion of the particle. The velocity of the lower particle is given by the dot spacing. For all experimental cycles, a slow particle drift 共narrow dot spacing兲 is observed until it falls below a critical
vertical distance (mm)
1.3
Phys. Plasmas 17, 013702 共2010兲
Kroll et al.
z position (mm)
absolute distance (mm)
013702-8
-0.5
0 0.5 radial position (mm)
0
P1
-0.2 -0.4
P3
-0.6
T
-0.8 -1 P2 0
0.2 0.4 0.6 0.8 radius (mm)
1
FIG. 10. 共a兲 Trajectories of the lower particle during the transition from the horizontal to the vertical alignment. Each trajectory corresponds to an experimental cycle. The 3D trajectories are projected into the xz plane. All particle positions 共dots兲 are with respect to the upper particle which is marked by a cycle. The velocity of the lower particle is encoded by the spacing between the dots. Below a critical distance between the particles, a sudden transition occurs. All trajectories cross exactly below the upper particle. 共b兲 P1 and P2 are the initial position of the particles. P3 denotes the metastable position of the lower particle. The sudden transition starts at T. The deviation for all experimental cycles corresponds to the marker size.
distance to the upper particle. At this point the lower particle is strongly accelerated and it returns to its initial position. In Fig. 10共a兲 this position is found at the intersection of all trajectories 共r = 0 , z = −1 mm兲. The fact that the particle passes this position is related to its high kinetic energy at this point. However, after some oscillations 共see Fig. 8兲 it comes to rest at exactly this position. The quantitative analysis of these repeated transitions is shown in Fig. 10共b兲. Here P1 and P2 are the initial positions of both particles. P3 is the metastable position of the lower particle. For each experimental cycle the metastable position and the point where the transition starts were determined. First, for the metastable position, = 67°, which is in remarkable agreement with the results obtained for the shifted chains discussed in Sec. IV. Second, in all experiments the
013702-9
Phys. Plasmas 17, 013702 共2010兲
On the influence of wakefields…
transition starts at the same point. In Fig. 10共b兲 this point is marked with T. The error bars are just 30 m in each direction and correspond to the marker size. Thus the transition exactly takes place when both particles have a minimum distance ac of just 785 m which corresponds to an angle = 50°. Similar experiments were performed by Samarian et al.26 They started with a configuration of two particles in a strong vertical confinement. Thus the particles were not aligned vertically but initially had almost the same height. Using a laser the lower particle was pushed toward the other one. Below a critical distance, this particle jumped to the position directly below the other one. The critical distance was determined to be ac ⬇ 0.75De in their experiments. To compare our value with the results of Samarian et al.,26 we have to determine the Debye length. Simulations by Lampe et al.22 showed that two vertically aligned particles in an external confinement potential will have a vertical distance of about 1.1De. According to this result, it is possible to estimate the electron Debye length for our case. With a vertical separation of about 1.1 mm we find De ⬃ 1 mm. Thus, in our case ac = 0.785De. This is in excellent agreement with the results of Samarian et al.26 Finally, Samarian could clearly relate his observations with the existence of an ion focus below the upper particle. Therefore, our experiments unambiguously show the existence of an ion focus underneath the particles for our experimental conditions. VI. SUMMARY AND CONCLUSIONS
To summarize, we have introduced an improved DIH setup. The stereoscopic approach of our SDIH setup allows the instantaneous measurement of all 3D particle positions with sufficient temporal and subpixel spatial resolution in all directions and reduces significantly the required computing time. Thus, we were able to investigate dynamical processes with high accuracy in 3D. Further, our experiments have shown that the use of larger hollow glass spheres allows to confine finite spherical dust clouds in a solid phase even at low neutral gas pressures. At these discharge conditions, the damping of the system due to the Epstein friction with the neutral gas is significantly reduced. The analysis of the structure in Sec. IV has shown that the crystalline structure of our dust cloud differs from previous observations of Yukawa balls. The structure we found is rather complex and caused by a competition of order between a shell-ordered structure and a chain dominated volume order. A typical signature is neighboring chains that are displaced in height by half an interparticle distance, as predicted in Ref. 22. In addition, the formation of distinct shells at the outside of the dust clouds is found. The combination of both blurs a clear shell structure toward the center of the dust cloud. The formation of particle chains is attributed to the presence of an ion focus and the related wakefield potential between the particles. To corroborate the presence of an ion focus for our conditions, a dedicated experiment with a twoparticle system has been performed. The excitation and relaxation of this system was studied at identical plasma con-
ditions and allowed us to investigate the interaction potential between two particles. Several observations reported in Sec. V confirm the presence of an ion focus. First, the particles are perfectly aligned at their initial positions and return to this position after relaxation. Further, for any of the excitations in arbitrary direction, the lower particle behaves in an exactly similar way. The lower particle passes a metastable position, then crosses a spot exactly underneath the upper particle and finally comes to rest below the upper particle after a few oscillations. This behavior can be only explained by means of an attractive force acting between the particles due to a wake potential. Second, the transition from the metastable position to the vertically aligned chain configuration occurs suddenly and is related to a well-defined position. This observation is consistent with several other experiments on two-particle systems, and each of them required the existence of an ion focus for explanation.23,26 The combination of both experiments, structure analysis of the dust cloud and two-particle excitation experiments, clearly shows that the observed chain structure and the vertical displacement of neighboring chains are observed for a situation where the particle interaction cannot be described by an isotropic Yukawa potential. Thus, the term Yukawa ball should only refer to dust clouds that are confined at the experimental conditions described by Arp et al.1 and it is not applicable to our confined dust cloud. The experiments demonstrate the existence of an ion focus. Hence, shifted chains, which might easily be confused with fcc or bcc structure in extended systems, do not indicate an isotropic particle interaction potential. Therefore, our observation perfectly matches earlier predictions of Lampe et al.22 Finally, an additional conclusion can be drawn. Our experimental conditions lead to an intermediate range of the vertical confinement force, whereby bistable particle arrangements occur. Since the experimental conditions remain constant, we assume that the drift, and thus the metastability, is caused by a slow discharging of the lower particle. This discharging could result from an enhanced ion flux due to the deflected ion in the wake of the upper particle. A first analysis indicates that the sudden transition occurs as soon as the lower particle enters the cone-shaped wake of the upper particle. However, further investigations are necessary to confirm this mechanism.
ACKNOWLEDGMENTS
Financial support by the Deutsche Forschungsgemeinschaft via SFB-TR24 Grant No. A3 is gratefully acknowledged. We thank M. Lampe for stimulating discussions. 1
O. Arp, D. Block, A. Piel, and A. Melzer, Phys. Rev. Lett. 93, 165004 共2004兲. 2 B. M. Annaratone, T. Antonova, D. D. Goldbeck, H. M. Thomas, and G. E. Morfill, Plasma Phys. Controlled Fusion 46, B495 共2004兲. 3 H. Baumgartner, D. Block, and M. Bonitz, Contrib. Plasma Phys. 49, 281 共2009兲. 4 O. Arp, Ph.D. thesis, Universität Kiel, 2006. 5 H. Baumgartner, H. Kählert, V. Golobnychiy, C. Henning, S. Käding, A. Melzer, and M. Bonitz, Contrib. Plasma Phys. 47, 281 共2007兲. 6 D. Dubin and T. O’Neil, Rev. Mod. Phys. 71, 87 共1999兲.
013702-10 7
Phys. Plasmas 17, 013702 共2010兲
Kroll et al.
A. Mortensen, E. Nielsen, T. Matthey, and M. Drewsen, Phys. Rev. Lett. 96, 103001 共2006兲. 8 M. Bonitz, D. Block, O. Arp, V. Golubnychiy, H. Baumgartner, P. Ludwig, A. Piel, and A. Filinov, Phys. Rev. Lett. 96, 075001 共2006兲. 9 C. Henning, H. Baumgartner, A. Piel, P. Ludwig, V. Golubnichiy, M. Bonitz, and D. Block, Phys. Rev. E 74, 056403 共2006兲. 10 C. Henning, P. Ludwig, A. Filinov, A. Piel, and M. Bonitz, Phys. Rev. E 76, 036404 共2007兲. 11 S. Käding and A. Melzer, Phys. Plasmas 13, 090701 共2006兲. 12 S. Käding, Y. Ivanov, and A. Melzer, IEEE Trans. Plasma Sci. 35, 328 共2007兲. 13 M. Kroll, S. Harms, D. Block, and A. Piel, Phys. Plasmas 15, 063703 共2008兲. 14 Y. Ivanov and A. Melzer, Phys. Rev. E 79, 036402 共2009兲. 15 O. Arp, D. Block, M. Bonitz, H. Fehske, V. Golubnychiy, S. Kosse, P. Ludwig, A. Melzer, and A. Piel, J. Phys.: Conf. Ser. 11, 234 共2005兲. 16 C. Henning, K. Fujioka, P. Ludwig, A. Piel, A. Melzer, and M. Bonitz, Phys. Rev. Lett. 101, 045002 共2008兲. 17 C. Henning, H. Kählert, P. Ludwig, A. Melzer, and M. Bonitz, J. Phys. A 42, 214023 共2009兲. 18 K. Takahashi, T. Oishi, K. Shimomai, Y. Hayashi, and S. Nishino, Phys. Rev. E 58, 7805 共1998兲. 19 Y. Hayashi, Phys. Rev. Lett. 83, 4764 共1999兲. 20 M. Zuzic, A. V. Ivlev, J. Goree, G. E. Morfill, H. M. Thomas, H. Rothermel, U. Konopka, R. Sutterlin, and D. D. Goldbeck, Phys. Rev. Lett. 85, 4064 共2000兲.
J. B. Pieper, J. Goree, and R. A. Quinn, Phys. Rev. E 54, 5636 共1996兲. M. Lampe, G. Joyce, and G. Ganguli, IEEE Trans. Plasma Sci. 33, 57 共2005兲. 23 V. Steinberg, R. Sütterlin, and G. Morfill, Phys. Rev. Lett. 86, 4540 共2001兲. 24 G. A. Hebner and M. E. Riley, Phys. Rev. E 68, 046401 共2003兲. 25 G. A. Hebner and M. E. Riley, Phys. Rev. E 69, 026405 共2004兲. 26 A. A. Samarian, S. V. Vladimirov, and B. W. James, JETP Lett. 82, 758 共2005兲. 27 O. Arp, D. Block, M. Klindworth, and A. Piel, Phys. Plasmas 12, 122102 共2005兲. 28 T. H. Demetrakopoulos and R. Mittra, Appl. Opt. 13, 665 共1974兲. 29 U. Schnars and W. Jueptner, Digital Holography 共Springer, New York, 2005兲. 30 Y. Ivanov and A. Melzer, Rev. Sci. Instrum. 78, 033506 共2007兲. 31 Y. Feng, J. Goree, and B. Liu, Rev. Sci. Instrum. 78, 053704 共2007兲. 32 G. Pan and H. Meng, Appl. Opt. 42, 827 共2003兲. 33 F. Lindemann, Physikalische Zeitschrift 11, 609 共1910兲. 34 S. V. Vladimirov, S. A. Maiorov, and N. F. Cramer, Phys. Rev. E 67, 016407 共2003兲. 35 S. V. Vladimirov and S. A. Maiorov, Phys. Plasmas 10, 3867 共2003兲. 36 R. W. Hasse and V. V. Avilov, Phys. Rev. A 44, 4506 共1991兲. 37 V. A. Schweigert, I. V. Schweigert, A. Melzer, A. Homann, and A. Piel, Phys. Rev. E 54, 4155 共1996兲. 38 A. Melzer, V. A. Schweigert, and A. Piel, Phys. Rev. Lett. 83, 3194 共1999兲. 21 22