materials Article
On the Injection Molding Processing Parameters of HDPE-TiO2 Nanocomposites Abdel-Hamid I. Mourad 1 , Mohammad Sayem Mozumder 2, *, Anusha Mairpady 2 , Hifsa Pervez 2 and Uma Maheshwara Kannuri 2 1 2
*
Mechanical Engineering Department, College of Engineering, UAE University, Al Ain 15551, UAE;
[email protected] Chemical & Petroleum Engineering Department, College of Engineering, UAE University, Al Ain 15551, UAE;
[email protected] (A.M.);
[email protected] (H.P.);
[email protected] (U.M.K.) Correspondence:
[email protected]; Tel.: +971-3-713-5324; Fax: +971-3-713-4996
Academic Editor: Walter Caseri Received: 24 September 2016; Accepted: 11 November 2016; Published: 20 January 2017
Abstract: In recent years, the development and use of polymeric nanocomposites in creating advanced materials has expanded exponentially. A substantial amount of research has been done in order to design polymeric nanocomposites in a safe and efficient manner. In the present study, the impact of processing parameters, such as, barrel temperature, and residence time on the mechanical and thermal properties of high density polyethylene (HDPE)-TiO2 nanocomposites were investigated. Additionally, scanning electron microscopy and X-ray diffraction spectroscopy were used to analyze the dispersion, location, and phase morphology of TiO2 on the HDPE matrix. Mechanical tests revealed that tensile strength of the fabricated HDPE-TiO2 nanocomposites ranged between 22.53 and 26.30 MPa, while the Young’s modulus showed a consistent increase as the barrel temperature increased from 150 ◦ C to 300 ◦ C. Moreover, the thermal stability decreased as the barrel temperature increased. Keywords: HDPE/TiO2 nanocomposites; injection molding parameters; structural changes; mechanical properties; thermal stability
1. Introduction Polymers have been used as starting materials for several different applications, and polymeric composites have formed a particularly interesting niche in biomedical engineering. Currently there are a variety of metallic and ceramic materials that are being pursued as micro or nanofillers in a polymer matrix [1]. Incorporation of additives into the polymeric matrix are mostly used to enhance the existing properties, however, it can also be considered a cost effective method for value added products [1,2]. New hybrid polymeric materials are being continually developed by the addition of fillers that fine tune the physical, chemical, and mechanical properties of the composites [1,3]. The effect of different nanofillers can be observed from the improved properties of the polymeric nanocomposites, however, fine tuning the process parameters of injection molding itself is also another important factor that must be considered. Polyethylene has been widely studied in combination with metallic nanoparticles for their combined advantage in hard tissue replacement and tissue engineering [3,4]. Specifically, high density polyethylene (HDPE), a thermoplastic material, has shown great promise as a matrix component of bone implants; its structure consists of long chains of carbon and hydrogen atoms bonded together with variable branching throughout which determines its mechanical properties [5]. Given the versatility of HDPE, many research groups have studied the effect of incorporation of fillers into the polymer Materials 2017, 10, 85; doi:10.3390/ma10010085
www.mdpi.com/journal/materials
Materials 2017, 10, 85
2 of 25
matrix, including titanium dioxide, aluminum oxide, hydroxyapatite, and zirconia etc. that resulted in biocomposites with improved physical properties and enhanced cellular responses in bone-like cells [3,6–10]. Metallic fillers such as titanium, zinc, and copper are known to improve the thermal and electrical conductivities of polymer matrices [1,11]. Among them, titanium has been used as implant material since the 20th century, and its alloys have many uses in orthopedic and dental research [9]. The popularity of titanium is attributed to its excellent biocompatibility, corrosion resistance, and high strength; nevertheless, its high modulus of elasticity limits its use as sole material for implants and hence the incorporation of pure titanium or titanium dioxide in polymers has resulted in feasible polymeric composites [9]. A high modulus causes bone resorption, and therefore, minimizing this effect results in successful integration of implants in the body [3,9]. Other types of fillers such as quasi-crystalline (QC), hydroxyapatite, polyimidazole fibers, and aluminum oxide have also been added to HDPE matrix to fabricate specialized composites [1,3,12,13]. Nanocomposites based on polymeric matrix are fabricated by various techniques including injection molding [3,14], compression molding [15,16], in situ polymerization [17,18], sol-gel [19], and sintering [9]. Among them, in situ polymerization involves the dispersion of inorganic nanoparticles in a monomer phase as a first step, followed by bulk phase polymerization [20]. The resulting solution produced polymeric nanocomposites with well-dispersed nanoparticles and good flowing properties [17]. However, a limitation of this technique shows that the mixture consists of unstable nanocomposites that may revert into a different morphology other than the expected [20]. Moreover, this process is not very common in industry and is mainly used for thermosetting polymers. In addition, compression molding is another technique used for fabricating nanocomposites; it involves a mold cavity in which the polymer blend is poured and results in composites of various dimensions. The processing conditions include very high pressure and the fabricated nanocomposites may not always have a uniform consistency [16]. Furthermore, most compression molding techniques require pre-treatment of the nanoparticles with curing. Injection molding offers higher production cycles than compression molding thermoplastics [21]. This technique has become one of the most significant industrialized techniques in the field of polymer composites processing. The process provides high production rates, repeatable high tolerances, and low labor cost, and is anticipated to hold greater potential in the fabrication of uniform, good quality polymer micro- and sub-micrometer structures [22]. Injection molding can be used in a variety of applications in both commercial and research fields. A large number of polymer parts with complex geometry and good dimensional accuracy can be automatically manufactured by injection molding [23]. Liu et al. fabricated Ti-HDPE composites based on a sintering method that was carried out between a temperature of 1000–3000 ◦ C and time ranging between 1 h and 12 h [9]. Sintering, powder compaction and sol-gel are all alternative techniques to produce polymeric composites, however, the operating conditions (temperature, pressure etc.) and time needed are far in excess of those of injection molding [24]. As a polymer matrix, high density polyethylene (HDPE) is well-known for its semi-crystalline structure which is closely bound to the overall macroscopic properties of the polymer such as mechanical and thermal characteristics [25]. In injection molding, HDPE undergoes an isothermal crystallization process which is a complex phenomenon occurring due to the varying shear and temperature gradients that occur while the polymer melts and fills the mold [23]. The various gradients contribute to the formation of different layers with different levels of crystallinity that affect the mechanical properties of the composites. In addition, the residence time (i.e., the time duration that the polymer spends in the barrel) along with barrel temperature, and the crystallization process of the polymer, especially HDPE, become affected [23]. In a study by Bociaga and Palutkiewicz [24], it was found that mold temperature had the greatest impact on the mechanical properties and surface structure. They investigated the effect of different injection molding conditions and concluded that low injection temperature, or barrel temperature, resulted in polymeric molded parts that consisted
Materials 2017, 10, 85
3 of 25
of a solid skin layer and a fine cellular core. Also, low weight HDPE parts were obtained at low injection temperature due to the formation of numerous tiny pores and the resultant high viscosity of the melting plastic, since temperatures used were close to the melting point of HDPE [26]. In his study, Mourad [27] concluded that the modulus of elasticity, yield strength, and tensile toughness decreased with increasing polyethylene (PE) content in the PE/PP blends of different concentrations and different process parameters. In a similar study by Mourad et al. [28] on the thermal characteristics of thermally treated and untreated VLDPE and isotactic PP blends (iPP), it was found through TGA and DSC analysis that addition of VLDPE resulted in a decrease in the melting temperature, heat of fusion, and percent crystallinity of the iPP based blends. Since injection molding is a commonly used technique for mass production in industrial applications, it is imperative to study the different operating conditions so that the process is optimized [29]. Therefore, the aim of the current study was to prepare HDPE-TiO2 nanocomposites with a 5% constant nanofiller concentrations through injection molding. The two main parameters studied were the barrel temperature and the residence time fixed at 250 ◦ C and 50 min respectively when either of the parameter was being studied. The effects of these process parameters were investigated based on the measured mechanical properties (i.e., Young’s modulus, tensile strength, and percent elongation) and thermal properties (e.g., crystallization and degradation temperatures) of the produced composites. Moreover, structural analyses such as X-ray Diffraction (XRD) and Fourier Transform Infrared (FTIR) spectroscopy were also used as tools to differentiate any structural changes of the polymer matrix. The surface morphology and titanium dioxide distribution was studied by means of scanning electron microscopy (SEM) along with energy dispersive spectroscopy (EDS) mapping of different elements along the surface of the injection molded substrates. 2. Materials and Methods Commercially available high-density polyethylene (HDPE) and titanium dioxide (TiO2 ) were supplied by Sigma-Aldrich (Munich, Germany). The supplied HDPE has a transition temperature (softening point) of 123 ◦ C and melt flow index of 2.2 g/10 min and the TiO2 nanoparticles (average particle size ~150 nm) of puriss grade have a melting temperature of >350 ◦ C. 2.1. Synthesis of HDPE-TiO2 Nanocomposites The HDPE nanocomposites having 5% TiO2 were subjected to high shear mixing to ensure even dispersion of TiO2 in the polymer matrix. The homogenous HDPE/TiO2 mixture was then transferred into the hopper of a gas assisted injection molding machine. After waiting for a specific amount of time, the sample was injected into the mold at constant air pressure and the mold temperature was maintained at 100 ◦ C. The extruded pellets were injected and molded into dumbbell shaped nanocomposites. In the present paper, the effects of two operating conditions were analyzed. When studying the effect of barrel temperature (150 ◦ C, 175 ◦ C, 200 ◦ C, 250 ◦ C, and 300 ◦ C) on the nanocomposites properties, residence time was kept constant at 50 min. Similarly, while evaluating the influence of residence time (30, 40, 50, 60, and 70 min) on properties of nanocomposites, the barrel temperature was maintained at 250 ◦ C. 2.2. Characterization 2.2.1. Mechanical Testing Injection molded dumbbell shaped specimens were evaluated for their tensile properties using a 5 kN load cell universal testing machine. A nominal gauge length of 20 mm was used, extended up to fracture with a cross head speed of 5 mm/min to obtain stress-strain curves. From the tensile curve, the tensile strength, elastic moduli, and elongation to break were determined.
Materials 2017, 10, 85
4 of 25
2.2.2. Thermal Analyses (TGA and DSC) To illustrate the thermal stability of the fabricated nanocomposites, thermogravimetric analysis (TGA) and differential scanning calorimetry (DSC) were carried out on the fabricated HDPE-TiO2 nanocomposites. One composite sample of each operating condition (i.e., barrel temperature and residence time) was considered for the thermal analyses, and its melting point, crystallization point, percentage of crystallization, and degradation temperature were determined. TGA was carried out in a TA instrument (Model Q 50, TA Instruments, New Castle, DE, USA) to quantitatively evaluate the weight change observed for 10 mg of the sample as a function of temperature and time. The temperature profile programmed in TGA consisted of heating range 25 ◦ C to 600 ◦ C. The degradation temperature was varied from room temperature to 600 ◦ C under the influence of nitrogen and the heating rate was maintained in the system at 10 ◦ C·min−1 . The crystallization and melting behavior of HDPE-TiO2 nanocomposites were evaluated in a TA instrument (Model Q 200, TA Instruments, New Castle, DE, USA). Throughout the experiment, the system was maintained in a nitrogen environment to avert the oxidation of the sample; a heating rate of 10 ◦ C·min−1 was used. Approximately, 5 mg of the sample was placed in a DSC pan and an empty pan were used as a reference. The DSC instrument was programmed to execute the analysis in three cycles. The first step involved a heating cycle in which the sample was exposed to a temperature from 25 ◦ C to 200 ◦ C. This was followed by a cooling cycle, which involved scanning the DSC pans with decreasing temperature from 200 ◦ C to 25 ◦ C. Finally, the sample was heated up to 200 ◦ C to retrieve the melting DSC curve. After completion of each step, the system was maintained isothermally for 5 min to disregard any thermal history. The rate of crystallization was calculated from the formula given below [30]: ∆Hm × 100%. (1) Xc = ◦ ∆H ( m ) × (ϕ) where, ∆Hm is the heat of fusion and ∆H◦ m is as per literature the extrapolated value of enthalpy corresponding to 100% crystalline polyethylene; ∆H◦ m = 293 J/g, ϕ weight fraction of HDPE [31]. 2.2.3. XRD Analysis The crystal morphology of TiO2 loaded in HDPE was examined in an X-ray diffractometer (X’Pert3 , PANalytical X-ray diffraction system, PANalytical, Denver, CO, USA). The X-ray diffraction pattern was obtained by using CuKα radiation (λ = 1.54 A◦ ), operating at a voltage of 45 kV and under a current of 40 mA. To measure the distances between the atomic planes (i.e., d spacing) using Braggs law the following equation was used [32]: nλ = 2dsinθ
(2)
Crystallite size of the nanocomposites were measured by using the Scherrer equation [33]. Lhkl =
Kλ β cos θ
(3)
where λ (A◦ ) is the wavelength of the X-ray, θ is the angle the between the incident X-ray and the plane perpendicular to the (hkl) plane, K is the crystallite shape factor which is 0.9 here, and β is the width of the diffraction beam at half height. 2.2.4. Scanning Electron Microscopy (SEM) The surface morphology of the nanocomposites was examined by means of SEM (FEI Quanta 50, Hillsboro, OR, USA) using a secondary electron detector (SE), at 30 kV and a working distance of 9.6 mm. Samples were sputter coated with a nano film of Au/Pd using a 108 Auto Sputter Coater
Materials 2017, 10, 85
5 of 25
Materials 2017, 10, 85 5 of of 24 (Cressington Scientific Instruments, Watford, UK). EDS (energy dispersive spectroscopy) mapping the surfaces was supported by Oxford systems, Abingdon, UK. 2.2.5. Fourier Transform Infrared (FTIR) 2.2.5.The Fourier Transform Infrared (FTIR) groups and bonding was analyzed by performing infrared presence of particular functional
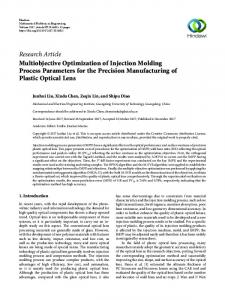
spectroscopy using Fourier transform SHIMADZU (Model: 8400S) in the The presence ofaparticular functionalspectrophotometer groups and bondingbywas analyzed by performing infrared −1. range from 650 cm−1 atoFourier 4000 cmtransform spectroscopy using spectrophotometer by SHIMADZU (Model: 8400S) in the range from 650 cm−1 to 4000 cm−1 . 3. Results and Discussion 3. Results and Discussion 3.1. Surface Morphology and Nanoparticles Dispersion 3.1. Surface Morphology and Nanoparticles Dispersion In this study, TiO2 nanoparticles enriched HDPE nanocomposites were fabricated using injection In this study, TiO2 operating nanoparticles enriched nanocomposites were fabricatedsurface using molding under varying conditions. In HDPE order to analyze the nanocomposites’ injection molding varying operating conditions. In order to analyze thefor nanocomposites’ topography and to under verify the presence of titania particles, SEM images were taken the developed surface topography and to verify the presence of titania particles, SEM images were for the HDPE-TiO2 nanocomposites. Figure 1 is a representative micrograph showing taken the surface developed HDPE-TiO nanocomposites. Figure 1 is a representative micrograph showing the surface 2 morphologies of the composites that were prepared with a consistent TiO2 content of 5 wt % , barrel morphologies of the composites that were with a consistent of 5temperatures wt % , barrel 2 content temperature of 225 °C, and a residence timeprepared of 50 min. Micrographs forTiO different barrel ◦ C, and a residence time of 50 min. Micrographs for different barrel temperatures temperature of 225 (150 °C, 225 °C, 250 °C, and 300 °C) were obtained. The SEM micrographs show some irregularities ◦ ◦ ◦ C) were obtained. The SEM micrographs show some irregularities on (150 225 ◦ C, 250 and 300 molded on theC,surfaces of theC,injection nanocomposites samples and no evidence of agglomeration the surfaces of the injection molded nanocomposites samples and noetevidence of agglomeration at the at the selected magnification were observed. According to Rideal al. [34] temperatures for HDPE selected magnification were observed. According to Rideal et al. [34] temperatures for HDPE at or at or above 300 °C resulted in degradation of the polymer due to the thermal effects on the bonding ◦ above 300 C resulted in degradation due to the thermal effects onmolding the bonding of the of the structure. Moreover, practically of at the highpolymer barrel temperatures in the injection equipment structure. Moreover, practically at high barrel temperatures in the injection molding equipment with with samples containing metal fillers, the samples tend to overheat resulting in a less desirable samples containing metal fillers, the samples tend to overheat resulting in a less desirable surface [35]. surface [35]. A similar result was also confirmed by Tripathi et al. [3] who reported a rougher surface A similar wasadditives also confirmed by Tripathi al. [3] who reported rougherwere surface when two or when tworesult or more were added to theetpolymer matrix whenasamples prepared at 180 ◦ C [3]. more additives were added to the polymer matrix when samples were prepared at 180 °C [3].
Figure 1. Representative secondary electron (SE) scanning electron microscopy (SEM) micrograph of Figure 1. Representative secondary electron (SE) scanning electron microscopy (SEM) micrograph high density polyethylene (HDPE)/TiO2 composites with 5 wt % nano-TiO2 prepared at a barrel of high density polyethylene (HDPE)/TiO2 composites with 5 wt % nano-TiO2 prepared at a barrel temperature of 225 ◦°C for 50 min of residence time. Image taken at 400× magnification and scaled to temperature of 225 C for 50 min of residence time. Image taken at 400× magnification and scaled to 300 micrometers. 300 micrometers.
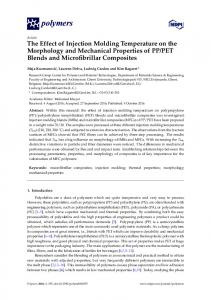
Nanocomposites consisting of 5 wt % TiO2 were developed at a fixed barrel temperature of 250 Nanocomposites consisting of 5 wt % TiO2 were developed at a fixed barrel temperature of 250 ◦ C, °C, with varying residence time of 30 min, 50 min, and 70 min. It was observed that residence time with varying residence time of 30 min, 50 min, and 70 min. It was observed that residence time as an as an independent variable does not affect the surface morphology of the injection molded nanocomposites. Figure 2 is a representative micrograph prepared at 30 min residence time. The surface of the samples is dominated by apparent ridges. In agreement with the observations, Mozumder et al. [36] confirmed the presence of nano-topographies consisting of groves and
Materials 2017, 10, 85
6 of 25
independent variable does not affect the surface morphology of the injection molded nanocomposites. Figure 2 is a representative micrograph prepared at 30 min residence time. The surface of the samples is Materials 2017, 10, 85 6 of 24 dominated by apparent ridges. In agreement with the observations, Mozumder et al. [36] confirmed the presence nano-topographies consisting of surface. groves and numerous all over the polymeric numerousofconcavities all over the polymeric Also, Shi et al. concavities [37] examined polymeric surfaces surface. Also, Shi et al. [37] examined polymeric surfaces by SEM and confirmed the presence of by SEM and confirmed the presence of micro-sized titanium dioxide particles on a smooth polymeric micro-sized titanium on asupported smooth polymeric coating; other studies by the group coating; other studiesdioxide by theparticles group also these observations [38–40]. Ranjusha et al. also [41] supported these observations [38–40]. Ranjusha et al. [41] processed hybrid composites at two processed hybrid composites at two different barrel temperatures (180 °C and 190 °C)different during ◦ C and 190 ◦ C) during injection molding, and their findings concluded that barrel temperatures (180their injection molding, and findings concluded that the temperature had little effect on the overall the temperature hadcomposites little effect[41]. on the overall morphology of the composites [41]. morphology of the
Figure 2. Representative secondary electron (SE) SEM micrograph of HDPE/TiO2 composites with 5 Figure 2. Representative secondary electron (SE) SEM micrograph of HDPE/TiO2 composites with wt % nano-TiO2 prepared at a barrel temperature of 250 °C for 30 min residence time. Image taken at 5 wt % nano-TiO2 prepared at a barrel temperature of 250 ◦ C for 30 min residence time. Image taken at 400× magnification and scaled to 300 micrometers. 400× magnification and scaled to 300 micrometers.
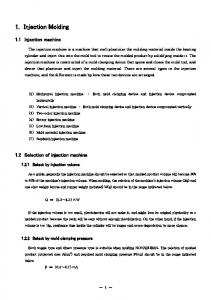
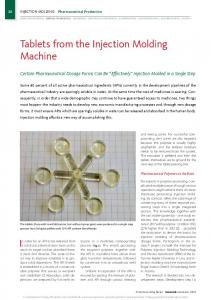
HDPE/TiO2 nanocomposites fabricated through injection molding with 5% titania were HDPE/TiO fabricated through injection with the 5% titania wereand analyzed 2 nanocomposites X-ray analyzed by energy-dispersive spectroscopy (EDS) molding to confirm presence even by energy-dispersive X-ray spectroscopy (EDS) to confirm the presence and even distribution of the distribution of the metal oxide filler. Figure 3 shows the composition analysis of part of the surface metal filler. Figure 3 shows the composition part the surface region of the regionoxide of the composite (fabricated at 250 °C)analysis and it of can beofclearly inferred that thecomposite principal ◦ (fabricated 250 C)isand it can be clearly thatsince the principal component (carbon) found component at (carbon) found abundantly oninferred the surface HDPE is the composite matrix is with the abundantly on the surface since HDPE is the composite matrix with the hydrocarbon chain; titanium hydrocarbon chain; titanium is also present in high composition in the matrix. To further elucidate is present in high composition in the matrix. further finding above, thealso finding above, elemental mapping, also by theTomeans ofelucidate EDS wasthe conducted on the elemental sample in mapping, also by the means of EDS was conducted on the sample in order to show the distribution of order to show the distribution of the different chemical elements present in the composite. the different chemical elements the composite. Figure 4a–d shows that thepresent carbonincontent is much higher than the other elements. Titanium Figure 4a–d shows that the carbon content is much higher than the titania other elements. elemental elemental mapping resulted in a uniformly distributed image with particlesTitanium dispersed all over mapping resulted in a uniformly distributed image with titania particles dispersed all over the the nanocomposite surface. Similar results were achieved by Mozumder et al. [42] in which the nanocomposite surface. Similar results were achieved by Mozumder et al. [42] in which the polymeric polymeric powder coatings (PPC) resulted in an even distribution of micrometer-sized titanium powder coatings (PPC) resulted an even of the micrometer-sized titanium across the across the different surfaces. Also,inWang et al.distribution [9] confirmed presence of titanium through point different surfaces. Also, Wang et al. [9] confirmed the presence of titanium through point EDS analysis, EDS analysis, resulting in the successful incorporation of the filler. Other elements such as oxygen resulting the successful incorporation the filler. Other elements and suchthe as oxygen were also present were alsoinpresent since titanium dioxideofwas the filler component presence of calcium was since titanium dioxide was the filler component and the presence of calcium was observed in significant observed in significant amounts as it is a common additive found in commercial grade metal oxides. amounts as it is a common additive found in commercial grade metal oxides.
Materials 2017, 10, 85
7 of 25
Materials 2017, 10, 85
7 of 24
Materials 2017, 10, 85
7 of 24
Figure 3. Elemental composition analyzed by energy-dispersive X-ray spectroscopy (EDS) on
Figure 3. Elemental composition analyzed by energy-dispersive X-ray spectroscopy (EDS) on HDPE/TiO nanocomposite at 5 wt analyzed % injection under a barrel temperature of 250 °C and Figure 3. 2Elemental composition bymolded energy-dispersive X-ray spectroscopy (EDS) on HDPE/TiO % injection molded under a barrel temperature of 250 ◦ C and 2 nanocomposite residence time of 50 min. atat55wt HDPE/TiO 2 nanocomposite wt % injection molded under a barrel temperature of 250 °C and residence timetime of 50 residence of min. 50 min.
Figure 4. A representative elemental mapping by EDS spectroscopy on injection molded HDPE/TiO2 nanocomposite fabricated under a barrel temperature 250 °C and a residence time of 50 min. Images2 Figure 4. A representative elemental mapping by EDSofspectroscopy on injection molded HDPE/TiO Figure 4. A representative elemental mapping by EDS spectroscopy on injection molded HDPE/TiO2 represent the distribution of thea barrel different chemical of elements on◦ athe nanocomposite (a) nanocomposite fabricated under temperature 250 °C and residence time of 50 surfaces: min. Images nanocomposite fabricated under and a barrel temperature of 250 C and a residence time of 50 min. carbon; (b)the titanium; (c) oxygen; (d) calcium. represent distribution of the different chemical elements on the nanocomposite surfaces: (a)
Images represent the distribution of the different chemical elements on the nanocomposite surfaces: carbon; (b) titanium; (c) oxygen; and (d) calcium. (a) carbon; (b) titanium; (c)mapping oxygen; confirms and (d) calcium. Therefore, elemental the presence of titania nanoparticles in the HDPE matrix with Therefore, a good overall dispersion. Nanocomposite at titania a barrelnanoparticles temperaturein ofthe 150HDPE °C exhibited elemental mapping confirms the prepared presence of matrix with a good overall dispersion. Nanocomposite prepared at a barrel temperature of 150 °C exhibited Therefore, elemental mapping confirms the presence of titania nanoparticles in the HDPE matrix
with a good overall dispersion. Nanocomposite prepared at a barrel temperature of 150 ◦ C exhibited a non-uniform morphology, while composites at higher temperatures consisted of regular ridges and
Materials 2017, 10, 85
8 of 24 25
a non-uniform morphology, while composites at higher temperatures consisted of regular ridges and pores. The surface surface morphologies morphologies of of the the nanocomposites with varying varying residence residence time time showed pores. The nanocomposites with showed little little variation but remained consistent with the general findings. variation but remained consistent with the general findings. Infrared (IR) (IR) analysis analysis is is aa very when analyzing analyzing different different compounds since the the Infrared very useful useful technique technique when compounds since spectra result in molecular fingerprints that enable identification of various organic and inorganic spectra result in molecular fingerprints that enable identification of various organic and inorganic molecules [28,43]. [28,43]. IR IR absorptions absorptions are are useful useful in in determining determining the the presence presence of of different different bond bond stretching stretching molecules pertaining to aa particular bond, the the percent percent transmittance, transmittance, as as well well as as the the intensity intensity of of aa pertaining to particular chemical chemical bond, particular peak [44]. particular peak [44]. FTIR spectra spectra of of all all injection injection molded molded nanocomposites nanocomposites were were recorded recorded by by the the means means of of aa reflective reflective FTIR IR technique that absorbed radiation from the surface of the nanocomposites. Figures 5 and show IR technique that absorbed radiation from the surface of the nanocomposites. Figures 5 and 66 show the spectra of different samples with varying residence time and barrel temperature, respectively. the spectra of different samples with varying residence time and barrel temperature, respectively. HDPE being being an an organic organic compound compound resulted resulted in in characteristic characteristic organic organic peaks were observed the HDPE peaks that that were observed in in the −1 [45], specifically representing the alkyl C–H bond seen in both Figures 5 and 6. range 2850–2950 cm −1 range 2850–2950 cm [45], specifically representing the alkyl C–H bond seen in both Figures 5 and 6.
Figure 5. Fourier transform infrared (FTIR) (FTIR) spectra spectra of of injection injectionmolded moldedHDPE/TiO HDPE/TiO22 nanocomposites ◦ at 55 wt of of 250 °C. C. Residence time waswas varied at 30atmin, 50 min, and wt % %TiO TiO22and anda abarrel barreltemperature temperature 250 Residence time varied 30 min, 50 min, 70 andmin. 70 min.
The most significant significant peak peak was was obtained obtained at at 1430 1430 cm cm−−11 that The most that in in turn turn confirmed confirmed the the presence presence of of titanium dioxide in the polymeric matrix and is characteristic of stretching and vibration of the titanium dioxide in the polymeric matrix and is characteristic of stretching and vibration of the Ti–O–Ti −1 are due to the single bond between the Ti–O–Ti bond [19]. Vibrations in the range ofcm 466–700 −1 are cm bond [19]. Vibrations in the range of 466–700 due to the single bond between the titanium titanium andatom, oxygen atom, Ti–O, and often present in the stretching the titanium dioxide molecule and oxygen Ti–O, and often present in the stretching of the of titanium dioxide molecule [19]. [19]. The presence of titanium dioxide on the surfaces of all the nanocomposites was hence confirmed. The presence of titanium dioxide on the surfaces of all the nanocomposites was hence confirmed. FTIR can also also be be helpful helpful in in detecting detecting any any microstructural microstructuralchanges changesin inaacompound. compound.Peaks Peaksatat1410 1410cm cm−−11 FTIR can −1 occurred due to the symmetric bending of the –CH3 group and the scissoring of a long and cm− 1 occurred due to the symmetric bending of the –CH group and the scissoring of a long and 1375 1375 cm 3 chain alkyl group, respectively [25]. [25]. Also, Also, peak peak at at 1462 1462 cm cm−−11 is chain alkyl group, respectively is attributed attributed to to the the vibrational vibrational changes changes occurring in the C–H bond [46]. occurring in the C–H bond [46]. In to Figure 5, it In reference reference to Figure 5, it can can be be inferred inferred that, that, the the considered considered residence residence time time range range has has no no effect effect on the overall infrared spectra of the nanocomposites, as all the characteristic peaks are well on the overall infrared spectra of the nanocomposites, as all the characteristic peaks are well aligned aligned with each range of of thethe wavenumbers in which 30 with each other. other. In Inaddition, addition,the theintensity intensityvaries variesininthe thelower lower range wavenumbers in which min shows the the highest transmittance followed by 50 and and 70 min withwith values of 85%, 82%,82%, and 30 min shows highest transmittance followed bymin 50 min 70 min values of 85%, 70% respectively. The decrease in transmittance could be explained by the occurrence of any bond and 70% respectively. The decrease in transmittance could be explained by the occurrence of any bond weakening cleavage when prolonged weakening or or cleavage when the the melted melted composite composite mixture mixture remains remains in in the the barrel barrel for for aa prolonged period, nevertheless the spectrum converges along its length [47]. Figure 6 presents a stacked graph
Materials 2017, 10, 85
9 of 25
Materials 10, 85 period, 2017, nevertheless
9 of 24 the spectrum converges along its length [47]. Figure 6 presents a stacked graph of the barrel temperature samples, and although similar to the trend found in the residence time, a wider ◦ C (between of the of barrel temperature samples, at and similar toand the 97%). trend found in the residence time, a range transmittance is observed 150although 68% wider range of transmittance is observed at 150 °C (between 68% and 97%).
Figure HDPE/TiO2 nanocomposites at 5 wt % TiO2 and residence Figure 6. 6. FTIR FTIR spectra spectra of of injection injection molded molded HDPE/TiO 2 nanocomposites at 5 wt % TiO2 and residence ◦ ◦ ◦ C. time of 50 min. Barrel temperature was varied at: (a) 300 °C; (b) 250 °C; and time of 50 min. Barrel temperature was varied at: (a) 300 C; (b) 250 C; and(c) (c) 150 150 °C.
3.2. 3.2. Mechanical Mechanical Characterization Characterization In In the the selection selection of of biomaterials biomaterials based based on on their their optimum optimum functionality, functionality, mechanical mechanical characterization characterization of the nanocomposites is a crucial analysis that serves to quantify some of the important of the nanocomposites is a crucial analysis that serves to quantify some of the important mechanical mechanical characteristics characteristics including including tensile tensile and and yield yield strengths, strengths, modulus modulusof ofelasticity, elasticity, and and percent percent elongation. elongation. For For the the present present work, work, in in order order to to investigate investigate the the effects effects of of barrel barrel temperature temperature on on the the mechanical mechanical properties ofthe theHDPE-TiO HDPE-TiOnanocomposites, 2 nanocomposites, uniaxial tensile testing was conducted. The TiO2 properties of uniaxial tensile testing was conducted. The TiO2 content 2 content of 5 wt % and residence time 50 min were fixedonly so that effect of barrel temperature of 5 wt % and residence time of 50 minofwere fixed so that the only effectthe of barrel temperature (150, 175, (150, 175, 200, 250, and 300 °C) was studied. The tensile strength, elastic modulus percent 200, 250, and 300 ◦ C) was studied. The tensile strength, elastic modulus and percentand elongation elongation werefrom obtained from the stress-strain curves for all the nanocomposites and representative were obtained the stress-strain curves for all the nanocomposites and representative curves are curves are presented in Figure 7. The current experimental data, along with some of the work from presented in Figure 7. The current experimental data, along with some of the work from previous previous literature are reported in Table 1. literature are reported in Table 1.
Materials 2017, 10, 85 Materials 2017, 10, 85
10 of 25 10 of 24
Figure Figure 7. 7. Stress-strain Stress-strain curves curves of of injection injection molded molded nanocomposites nanocomposites with with varying varying barrel barrel temperature temperature ◦ C, 175 ◦ C, 200 ◦ C, 250 ◦ C, and 300 ◦ C, respectively. (BT), nanocomposites BT1–BT5 at 150 (BT), nanocomposites BT1–BT5 at 150 °C, 175 °C, 200 °C, 250 °C, and 300 °C, respectively. Table Mechanical properties properties of of injection injection molded molded high high density Table 1.1. Mechanical density polyethylene polyethylene (HDPE) (HDPE) based based nanocomposites from the current literature. nanocomposites from the current literature.
Current work & Current work & Literatures Literatures Current work 5% TiO2
Current work 5% TiO2 Sotomayor et al. [48] Kumar et al. [49] Sotomayor Pegorettietetal. al. [48] [50] Tripathi et al. [3] Kumar et al. [49] Zhil’tsova et al. [24] Pegoretti et al. [50] Bartczak et al. [51]
Tripathi et al. [3] Zhil’tsova et al. [24] The yieldet strength Bartczak al. [51]
Temperature Temperature (◦ C)
σy σy (MPa)
σu σu (MPa)
Modulus Modulus (MPa)
Elongation Elongation (%)
(MPa) (MPa) (MPa) (%) (°C) 150 21.5 26.3 297.5 579.8 150 21.5 26.3 297.5 579.8 175 21.5 23.6 308.6 498.6 200 21.9 23.8 322.1 481.9 175 21.5 23.6 308.6 498.6 250 19.9 22.7 322.3 673.9 200 21.9 23.8 322.1 481.9 300 20.9 22.5 323.8 819.4 250 19.9 22.7 322.3 673.9 160 23.6 710.0 6.0 300 20.9 22.5 323.8 819.4 165 19.9 592.0 10.2 160 23.6 710.0 180 27.7 -932.0 11736.0 180 -24.2 564.3 855.4 165 19.9 592.0 10.2 190–220 28.0 25.0 1300.0 180 27.7 932.0 1173 190–200 24.9 14.5 756.1 730 180 24.2 564.3 855.4 190–220 28.0 25.0 1300.0 of the nanocomposites, BT1–BT5, 14.5 ranges from756.1 19.94 MPa to 21.85 190–200 24.9 730 MPa.
This narrow range illustrates that the yield strength is not significantly affected by the considered range of barrel tensile strength, or theBT1–BT5, fracture strength, for the nanocomposites Thetemperatures. yield strengthThe of the nanocomposites, ranges from 19.94 MPa to 21.85 was MPa.found This to vary within range from to 26.30 MPa. is Table and Figure 8affected show the in the yield and narrow range the illustrates that 22.53 the yield strength not 1significantly bychange the considered range tensile strengths with theThe barrel temperature, (SE) bars. It can be noted that was at a of barrel temperatures. tensile strength, with or thestandard fractureerror strength, for the nanocomposites ◦ barrel of 150 C, thefrom composite revealed the highest strength and lower valuesin were found temperature to vary within the range 22.53 to 26.30 MPa. Table 1tensile and Figure 8 show the change the found for tensile higher strengths barrel temperatures. This is possibly attributed to the phase of It the specimens yield and with the barrel temperature, with standard error (SE)size bars. can be noted that were injection molded at temperatures [52].revealed A studythe by highest Zhou ettensile al. [53]strength on examining the at a barrel temperature ofhigh 150 °C, the composite and lower effect meltfound temperature alsobarrel supported this trend; talc-reinforced polypropylene molded valuesofwere for higher temperatures. This is possibly attributed to the injection phase size of the composites revealed lower yield strength hightemperatures melt temperatures (barrel tensile specimens that werea injection molded at at high [52]. A studytemperature). by Zhou et The al. [53] on strength nevertheless due to the interfacial binding between the metallic/ceramic filler and examining the effect decreased of melt temperature also supported this trend; talc-reinforced polypropylene polymer [3].composites revealed a lower yield strength at high melt temperatures (barrel injection matrix molded temperature). The tensile strength nevertheless decreased due to the interfacial binding between the metallic/ceramic filler and polymer matrix [3].
Materials 2017, 10, 85 Materials 2017, 10, 85 Materials 2017, 10, 85
11 of 25 11 of 24 11 of 24
Figure 8. Effect of barrel temperature on tensile and yield strengths of the developed HDPE-TiO2
Figure 8. Effect of barrel temperature on tensile and yield strengths of the developed HDPE-TiO2 Figure 8. Effect (SE of barrel temperature on tensile and yield strengths of the developed HDPE-TiO2 nanocomposites bars included). nanocomposites (SE bars included). nanocomposites (SE bars included).
Young’s modulus, which represents the stiffness of the material was calculated from the initial Young’s modulus, which represents the stiffness of was calculated from the initial linear region of the stress-strain curves, the average values of material three samples were considered and are Young’s modulus, which represents the stiffness of the the material was calculated from the initial linear region of the stress-strain curves, the average values of three samples were considered and are shown in Table 1 and presented in Figure 9, with SE bars. The moduli of the nanocomposites were linear region of the stress-strain curves, the average values of three samples were considered and are shown inhave Table 1 and presented Figure with SE bars. The ofof the nanocomposites werewere found variation and were observed toSE increase with barrel temperature; a total increase shown in to Table 1little and presented inin Figure 9,9,with bars. Themoduli moduli the nanocomposites found to have little variation and were observed to increase with barrel temperature; a total increase of 8.81% was shown when and the barrel temperature increasedwith frombarrel 150 °Ctemperature; to 300 °C. Tripathi al. [3] of found to have little variation were observed to increase a totaletincrease of 8.81% wasHDPE showncomposites when the barrel temperature increasedand from 150 °C to 300 °C. Tripathi et al. [3] also studied incorporated with alumina hydroxyapatite that were fabricated ◦ ◦ 8.81% was shown when the barrel temperature increased from 150 C to 300 C. Tripathi et al. [3] also also studied HDPE composites alumina and hydroxyapatite fabricated using injection molding at 180 incorporated °C (see Tablewith 1). The mechanical tests revealedthat thatwere the minimum studied HDPE composites incorporated with alumina and hydroxyapatite that were fabricated using using injection molding at 180 °C (see Table 1). The mechanical tests revealed that the minimum modulus of elasticity◦ occurred with neat HDPE and consistently increased at higher filler injection molding at 180 Coccurred (see Tablewith 1). The mechanical tests revealed that the minimum modulus modulus of elasticity neat HDPE and consistently increased at higher filler of concentrations. elasticity occurred with neat HDPE and consistently increased at higher filler concentrations. concentrations.
Figure 9. Effect of barrel temperature on Young’s modulus of the developed HDPE-TiO2 Figure 9. Effect ofbars barrel temperature on Young’s modulus of the developed HDPE-TiO2 nanocomposites included). Figure 9. Effect (SE of barrel temperature on Young’s modulus of the developed HDPE-TiO2 nanocomposites (SE bars included).
nanocomposites (SE bars included). The percent elongations, representing the ductility of the material were obtained and are The percent elongations, representing the ductility of the material were toobtained and are demonstrated in Figure 10. At 150 °C, the elongation of the composite was found be ≈580%, while The thelower ductility of≈482%. the material were obtained and demonstrated inelongations, Figure 10. At representing 150 had °C, the elongation ofvalue the composite wascould found be ≈580%,by while at 200 percent °C the elongation observed a slightly This betoexplained the are ◦ C,a the at 200 °C of thelaminar observed had slightly value ≈482%. This could befound explained bythis the demonstrated inelongation Figure 10. At 150 of the composite was to be ≈ 580%, presence orientation occurring at elongation low lower temperatures that resulted in higher ductility, ◦ presence orientation occurring atin temperatures that resulted inThis higher ductility, this while at 200 Claminar the elongation observed had alow slightly lower value ≈482%.revealed could bepercent explained result wasofalso observed by Zhang et al. [52] which PP/LLDPE composites higher result was also observed by Zhang et al. [52] in which PP/LLDPE composites revealedin higher percent elongation at of a low melt temperature (barrel temperature). by the presence laminar orientation occurring at low temperatures that resulted higher ductility, elongation at a low melt temperature (barrel temperature). this result was also observed by Zhang et al. [52] in which PP/LLDPE composites revealed higher
percent elongation at a low melt temperature (barrel temperature).
Materials 2017, 10, 85
12 of 25
Materials 2017, 10, 85
12 of 24
Materials 2017, 10, 85
12 of 24
Effect of barrel temperature on percent elongation of the developed HDPE-TiO2 FigureFigure 10. 10. Effect of barrel temperature on percent elongation of the developed HDPE-TiO2 nanocomposites (SE bars included). nanocomposites (SE bars included).
It is evident that HDPE/TiO2 nanocomposites processed at higher barrel temperatures showed
Figure 10. Effect of barrel temperature on percent elongation of the developed HDPE-TiO2
ductility and an increase in the modulus processed of elasticityat when compared the lower barrel Itimproved is evident that HDPE/TiO higher barrel to temperatures showed 2 nanocomposites nanocomposites (SE bars included). temperatures. In agreement with the aforementioned results, Khan et al. [5] modeled the feasibility improved ductility and an increase in the modulus of elasticity when compared to the lower barrel of recycled compared to2 nanocomposites pure, together with the optimization of the injection It is evident that HDPE/TiO processed at higher barrel temperatures showed temperatures. In HDPE agreement with the aforementioned results, Khan et al. [5] modeled themolding feasibility of operating parameters [5]. According to the grey relational analysis performed by their group, barrel improved and to anpure, increase in the modulus elasticity when to the lowera barrel recycled HDPEductility compared together with theofoptimization of compared the injection molding operating temperature of 240 °C was concluded to be the optimum for the processing of neat HDPE [5]; as the temperatures. In agreement with the aforementioned results, Khan et al. [5] modeled the feasibility parameters [5]. According to the grey relational analysis performed by their group, a barrel temperature barrel temperature increased from 200 °C towith 240 °C, aoptimization slight increase strength was HDPE was compared to pure, together of in thetensile injection ◦ recycled of 240of C wasMoreover, concluded to be the optimum for the the processing of Mourad neat HDPE [5]; molding as the observed. the effect of processing conditions was studied by et al. [54,55] diebarrel operating parameters [5]. According◦to the grey◦relational analysis performed by their group, a on barrel temperature was increasedand from 200found C tothat 240theC, a slight increase inand tensile strength was observed. drawn polypropylene, it was compression modulus yield increased temperature of 240 °C was concluded to be the optimum for the processing of neatstrength HDPE [5]; as the Moreover, the effect of processing conditions was studied by Mourad et al. [54,55] on die drawn with a higher processing temperatures. Zhang et al. [52] studied the effect of processing temperature barrel temperature was increased from 200 °C to 240 °C, a slight increase in tensile strength was on PP/LLDPE injection molded bars and observed a trend similar to the present study, that is, at high polypropylene, and it was found that the compression modulus and yield strength increased observed. Moreover, the effect of processing conditions was studied by Mourad et al. [54,55] on die with temperatures, thetemperatures. strength the polymeric was found toeffect be low. a higher processing Zhang et materials al. studied the of processing temperature drawn polypropylene, and of it was found that the[52] compression modulus and yield strength increased on To further study the operating conditions of injection molding, the time was varied with a higher processing temperatures. Zhang et al. [52] studied thetoeffect of processing temperature PP/LLDPE injection molded bars and observed a trend similar theresidence present study, that is, in at high the preparation of the nanocomposites between 30 min and 70 min. A filler concentration of 5 wt % on PP/LLDPE injection molded bars and observed a trend temperatures, the strength of the polymeric materials wassimilar foundtotothe bepresent low. study, that is, at high remained constant as well of as the the polymeric barrel temperature at 250found °C. The nanocomposites were subjected temperatures, the strength materials was to be low. To further study the operating conditions of injection molding, the residence time was varied to tensile testing to evaluate the different parameters important for biomedical applications. The To further study the operating conditions of injection molding, the residence time was varied in in thestress-strain preparation of the nanocomposites between 30 min and 70 min. A filler concentration of curves for the nanocomposites (RT1-RT5) are shown in Figure 11. the preparation of the nanocomposites between 30 min and 70 min. A filler concentration of 5 wt % ◦ 5 wt % remained constant as well as the barrel temperature at 250 C. The nanocomposites were remained constant as well as the barrel temperature at 250 °C. The nanocomposites were subjected subjected to tensile testing to evaluate the different parameters important for biomedical applications. to tensile testing to evaluate the different parameters important for biomedical applications. The The stress-strain curves for the nanocomposites (RT1-RT5) are shown in Figure 11. stress-strain curves for the nanocomposites (RT1-RT5) are shown in Figure 11.
Figure 11. Stress-strain curves of injection molded nanocomposites with varying residence time.
Figure 11. Stress-strain curves of injection molded nanocomposites with varying residence time.
Figure 11. Stress-strain curves of injection molded nanocomposites with varying residence time.
Materials 2017, 10, 85
Materials 2017, 10, 85
13 of 25
13 of 24
In general, the residence time may not result in remarkable differences between the properties
In general, the residence time may not result in remarkable differences between the properties of the composites [14,56]; however, it is still imperative to consider its effect by varying it during the of theprocessing. composites it isyield stillstrength, imperative towith consider its effect bypercent varying it during the The[14,56]; tensile however, strength and along the modulus and elongation processing. The tensile and yield were strength, with the modulus and 258.88 percent elongation are reported in Tablestrength 2. Young’s moduli foundalong to be 243.76 MPa, 244.38 MPa, MPa, 269.67 are reported Table 2. Young’s were found to be 243.76 MPa, 244.38 258.88 MPa, 269.67 MPa, MPa,inand 274.34 MPa formoduli nanocomposites RT1-RT5 respectively. A slowMPa, and consistent increasing and 274.34 MPaobserved for nanocomposites respectively. Awith slowSE and consistent increasing trend was trend was which is betterRT1-RT5 represented in Figure 12 bars. observed which is better represented in Figure 12 with SE bars. Table 2. Summary of the results obtained from the mechanical tests performed on the injectionnanocomposites with obtained varying residence Tablemolded 2. Summary of the results from thetimes. mechanical tests performed on the injection-molded
nanocomposites with varying residence times.Yield Tensile Residence Strength Strength Sample Designation Time (min)Yield Strength Residence Time Tensile Strength (MPa) (MPa) Sample Designation (min) (MPa) (MPa) 1 RT1 30 19.8 22.1 1 RT1 30 19.8 22.1 2 RT2 40 20.2 21.6 2 RT2 40 20.2 21.6 50 22.9 3 3 RT3 RT3 50 20.820.8 22.9 4 4 RT4 RT4 60 22.522.5 23.0 60 23.0 5 5 RT5 RT5 70 22.722.7 24.3 70 24.3
Young’s % Modulus Elongation Young’s Modulus (MPa) % Elongation (MPa) 247.6 650.4 247.6 650.4 248.1 618.2 248.1 618.2 256.4 634.2 256.4 634.2 265.9 601.0 265.9 601.0 269.6 610.7 269.6 610.7
Figure Effect residencetime time on on the the modulus modulus of developed HDPE-TiO 2 Figure 12. 12. Effect of of residence of elasticity elasticityof ofthethe developed HDPE-TiO 2 nanocomposites (SE bars included). nanocomposites (SE bars included).
Figure 13 demonstrates the variation of the yield and tensile strengths with barrel residence time.
Figure 13 slow demonstrates variation of the and strengths withare barrel residence The same increasingthe trends analogous to yield that of thetensile modulus of elasticity observed. The time. yield slow strength of the composites varies with a maximum range of MPa, are showing negligible The same increasing trends analogous to that of the modulus of 2.85 elasticity observed. The yield variation the residence time wasaaltered. strength of thewhen composites varies with maximum range of 2.85 MPa, showing negligible variation The tensile strength demonstrates the same trend modulus and yield strength, with a highest when the residence time was altered. value of 24.25 MPa and a lowest value of 21.60 MPa. The tensile strength demonstrates the same trend modulus and yield strength, with a highest The percent elongation values of the composites vary within a range of 49.4% (see Figure 14) value of 24.25 MPa and a lowest value of 21.60 MPa. with residence time, which is relatively a narrow range. In light of the above results, it can be The percent elongation valuesrange of the vary (seeeffect Figure concluded that the considered of composites residence time (30within min to a70range min) of has49.4% a minor on 14) the with residence time, which is relatively a narrow range. In light of the above results, it can be concluded mechanical performance of HDPE/TiO2 nanocomposites. that the considered range of residence (30 min to 70 min) a minor on the mechanical In a study performed by Bociaga time and Palutkiewicz [26], the has injection timeeffect (residence time) had performance HDPE/TiO negligibleofeffect on the mechanical properties of injection molded HDPE parts. Zhil’tsova et al. [24] 2 nanocomposites. alsoa study performed a similar to understand the effects different processing conditions on had In performed bystudy Bociaga and Palutkiewicz [26],ofthe injection time (residence time) injection molded HDPE acetabular cups. Their results revealed that when the injection time was negligible effect on the mechanical properties of injection molded HDPE parts. Zhil’tsova et al. [24] reduced, thea cups obtained of lower weight [24]. of different processing conditions on injection also performed similar studywere to understand the effects molded HDPE acetabular cups. Their results revealed that when the injection time was reduced, the cups obtained were of lower weight [24].
Materials 2017, 10, 85 Materials 2017, 10, 85 Materials 2017, 10, 85
14 of 25 14 of 24 14 of 24
Figure Effect residencetime timeon on yield yield and and tensile tensile strengths HDPE-TiO 2 Figure 13. 13. Effect of ofresidence strengthsofofthe thedeveloped developed HDPE-TiO 2 Figure 13. Effect(SE of bars residence time on yield and tensile strengths of the developed HDPE-TiO2 nanocomposites included). nanocomposites (SE bars included). nanocomposites (SE bars included).
Figure 14. Effect of residence time on percentage of elongation of the developed HDPE-TiO2 Figure 14. Effect of residence time on percentage of elongation of the developed HDPE-TiO2
nanocomposites (SEresidence bars included). Figure 14. Effect of time on percentage of elongation of the developed HDPE-TiO2 nanocomposites (SE bars included). nanocomposites (SE bars included). 3.3. Thermal Analyses 3.3. Thermal Analyses
3.3. Thermal Analyses
3.3.1. TGA (Thermogravimetric Analysis) 3.3.1. TGA (Thermogravimetric Analysis) 3.3.1. TGA Analysis) For(Thermogravimetric large scale production of nanocomposites, thermal stability plays an important role in For large scale quality production of nanocomposites, thermal stability plays important rolewas in obtaining superior products. In this study, the thermal stability of an nanocomposites For largesuperior scale production of nanocomposites, thermal stability plays an importantwas role in obtaining quality products. In this study, the thermal stability of nanocomposites evaluated using TGA and DSC techniques. In TGA, physical and chemical changes upon heating at obtaining superior quality products. In this study,physical the thermal stability of nanocomposites evaluated using and techniques. In TGA, and The chemical changes upon heatingand at was constant rate areTGA noted asDSC a function of temperature and time. degradation temperature evaluated using TGA and DSC techniques. In TGA, physical and chemical changes upon heating constant rate are noted as a function ofoftemperature and nanocomposites time. The degradation temperature highest degradation rate-temperature the fabricated are obtained from and the highest degradation rate-temperature of the fabricated nanocomposites are obtained from the at constant rate are noted as a function of temperature and time. The degradation temperature respective TGA thermograms [57]. TGA thermograms andrespective highest rate-temperature of the fabricated nanocomposites are obtained from the The degradation thermograms of the[57]. manufactured nanocomposites (BT1-BT5 and RT1-RT5) were taken The thermograms of the manufactured nanocomposites (BT1-BT5 and RT1-RT5) were taken respective TGA thermograms [57]. (TGA). Nanocomposites containing 5 wt % TiO2 nanoparticle were from thermogravimetric analysis from (TGA). Nanocomposites containing 5 wt %times. TiO2RT1-RT5) nanoparticle were injection molded withofa analysis different set of barrel temperatures and(BT1-BT5 residence The thermograms The thermogravimetric thermograms the manufactured nanocomposites and were taken injection molded with a different set of barrel temperatures and residence times. The thermograms obtained by degrading the(TGA). composites until completecontaining degradation5was witnessed As shown inwere fromwere thermogravimetric analysis Nanocomposites wt % TiO2 nanoparticle were obtained the composites until complete degradation was witnessed As shown in Figures 15 andby 16,degrading itacan be seen that and residence affect the TGA. According to injection molded with different set oftemperature barrel temperatures and time residence times. The thermograms Figures 15 and 16, it can be seen that temperature and residence time affect the TGA. According to Beyler and Bayar et al. [58,59] the stiffer the polymer, the greater is its melting temperature. However, wereBeyler obtained by degrading the composites until complete degradation was witnessed As shown in and Bayar et al. [58,59] the stiffer the polymer, the greater is its melting temperature. However,
Figures 15 and 16, it can be seen that temperature and residence time affect the TGA. According to Beyler and Bayar et al. [58,59] the stiffer the polymer, the greater is its melting temperature. However,
Materials 2017, 10, 85
15 of 25
Materials 2017, 10, 85 15 of 24 at higher temperatures the polymer tends to become ductile in nature and the melting temperature 2017, 10, 85 of 24 startsMaterials decreasing and the polymer starts degrading. When a temperature exceeds its 15 withstand at higher temperatures the polymer tends to become ductile in nature and the melting temperature point,atpolymer fragmentation occurs and the polymer decomposes. Heating the polymer below its higher temperatures polymer tends to become ductile in nature and the melting temperature starts decreasing and thethe polymer starts degrading. When a temperature exceeds its withstand point, temperature of degradation and cooling the polymer helps to bind it with the nanoparticles which starts decreasing and the polymer starts degrading. a temperature exceeds its withstand point, polymer fragmentation occurs and the polymer When decomposes. Heating the polymer below its results in a composite more stiffer in nature. With the escalation of the temperature, polymeric materials polymer fragmentation occurs thethe polymer the nanoparticles polymer below its temperature of degradation and and cooling polymerdecomposes. helps to bindHeating it with the which lose their stiffness become more ductile nature, which in turn affects the thermal stability temperature of and degradation cooling thein polymer helps to bind itofwith the nanoparticles which of results in a composite moreand stiffer in nature. With the escalation the temperature, polymeric results in lose a The composite more stiffer in nature. With ofundergoes the polymeric the composites. polymer, when exposed to certain temperatures, degradation and the materials their stiffness and become more ductilethe in escalation nature, which in temperature, turn affects the thermal materials lose their stiffness and become more ductile in nature, which in turn affects the thermal stability of the composites. The polymer, when exposed to certain temperatures, undergoes interaction between the polymer matrix and nanofiller is changed. On annealing, superior quality stability of and the composites. polymer, when exposed tonanofiller temperatures, degradation interactionThe between the polymer matrix and is changed.temperature On undergoes annealing,has a nanocomposites arethe developed, even though a higher degree ofcertain the processing degradation and the interaction between the polymer matrix and nanofiller is changed. On processing annealing, superior quality nanocomposites are developed, even though a higher degree of the negative impact on the thermal stability [60]. Tables 3 and 4 summarize the results of TGA. As shown superior quality developed, even though a higher degree of the processing temperature has ananocomposites negative impact are on the thermal stability [60]. Tables 3 and 4 summarize the results in Table 3, the rate of degradation of nanocomposites decreased as the sample was processed through temperature has a negative impact onof the thermal stability [60]. Tables 3 decreased and 4 summarize the results of TGA. As shown in Table 3, the rate degradation of nanocomposites as the sample was high of barrel temperatures. On3,the contrary, in the case of residence time, the higher duration gave TGA. As shown in Table the rate of degradation of nanocomposites decreased as the sample was processed through high barrel temperatures. On the contrary, in the case of residence time, the higher betterprocessed TGA results. However, with increase in barrel temperature and residence time, the maximum through high barrel temperatures. On the contrary, in the case of residence the higher duration gave better TGA results. However, with increase in barrel temperature andtime, residence time, degradation temperature decreased. duration gave better TGA results. However, with increase in barrel temperature and residence time, the maximum degradation temperature decreased.
the maximum degradation temperature decreased.
Figure 15. Thermogravimetric analysis (TGA) thermograms of HDPE/TiO2 nanocomposites with
Figure 15. Thermogravimetric analysis (TGA) thermograms of HDPE/TiO2 nanocomposites with Figure Thermogravimetric analysis (TGA) thermograms of HDPE/TiO2 nanocomposites with varying15. barrel temperature. varying barrel temperature. varying barrel temperature.
Figure 16. Pictorial representation of TGA analysis carried out on HDPE-TiO2 with varying residence Figure time. 16. Pictorial representation of TGA analysis carried out on HDPE-TiO2 with varying residence Figure 16. Pictorial representation of TGA analysis carried out on HDPE-TiO2 with varying time.
residence time.
Materials 2017, 10, 85
16 of 25
Table 3. Summary of thermogravimetric analysis (TGA) results showing the effect of barrel temperature on the degradation and the highest rate degradation temperatures of the fabricated nanocomposites. Sample
Designation
Barrel Temperature (◦ C)
Degradation Temperature (Td ) (◦ C)
Highest Degradation Temperature (Tdh ) (◦ C)
1 2 3 4 5
BT1 BT2 BT3 BT4 BT5
150 175 200 250 300
458.0 459.5 433.1 424.6 423.5
488.3 488.7 481.2 478.4 478.4
Table 4. Summary of TGA results showing the effect of barrel temperature on the degradation and the highest rate degradation temperatures of the fabricated nanocomposites. Sample
Designation
Residence Time (min)
Degradation Temperature (Td ) (◦ C)
Highest Rate Degradation Temperature (Tdh ) (◦ C)
1 2 3 4 5
RT1 RT2 RT3 RT4 RT5
30 40 50 60 70
450.4 426.8 424.5 454.9 431.1
485.8 480.7 478.4 486.9 479.5
Ranjusha et al. [41] investigated the influence of molding temperature on the injected molded composites and reported that with increase in temperature from 180 to 200 ◦ C, decrease in thermal stability was observed. In another research, Boey et al. [58] found that at lower temperature and shorter residence time, complete melting of polymer and blending of fillers may not be achieved. On the contrary, Davis et al. [61] established that melt blending of poly(ethylene terephthalate) clay nanocomposites for longer duration and higher screw speed resulted in low quality products. To conclude, the highest rate degradation temperature of nanocomposites was 459.5 ◦ C, which was obtained at 175 ◦ C temperature and 50 min residence time. As mentioned above, initially the polymers, under the influence of temperature, melt and a certain amount of degradation takes place. On annealing, polymer will bind with nanoparticles which in turn results in better thermal stability. However, when processing conditions exceed the limit, polymer degradation becomes irreversible and significant changes occur in the structure of the material. The polymer loses its properties and leads to fragmentation [60,62]. In this study, it was noticed that the degradation temperature approximately reduced by 34.5 ◦ C with the increase of barrel temperature from 150 to 300 ◦ C. Similarly, in case of residence time, with escalation of time from 30 to 70 min, there was a decrease of 19 ◦ C in degradation temperature. This decrease in thermal stability can be attributed to the fact that as the duration increases. the polymer has a longer time to melt and degrade. This irreversible degradation can be one of the reasons for the decrease in thermal stability with increase in residence time [60,63]. 3.3.2. DSC (Differential Scanning Calorimetry) In designing the polymeric nanocomposites, tuning the operating conditions becomes extremely crucial to ensure efficient dispersion of nanofillers in the polymeric matrix. For example, each polymer has its own degradation temperature and while choosing the operating conditions, it is very important to choose a temperature lower than its degradation temperature and follow a method that enhances the thermal stability of the nanocomposites [64]. Hence, differential scanning calorimetry was used to obtain the melting and crystallization temperature of nanocomposites along with the degree of crystallinity. In the current work, the DSC curves for polymeric nanocomposites were generated for different barrel temperatures (BT1–BT5) and residence time (RT1–RT5) under a nitrogen atmosphere. Figures 17 and 18 are the pictorial representation of the DSC melting and cooling curves generated under different barrel temperatures. Table 5 summarizes the values of some of the kinetic parameters
Materials 2017, 10, 85 Materials 2017, 10, 85
17 of 25 17 of 24
2017, 10, 85 17 of 24 (e.g., Materials the melting and crystallization temperatures and degree of crystallinity). The results reveal that, the melting and crystallization temperatures and degree ofnot crystallinity). The results reveal that, therange the melting and cooling curves of the nanocomposites have been affected significantly by the the melting and crystallization temperatures and degree of crystallinity). The results reveal that, the ◦ C range melting and cooling curves of Increasing the nanocomposites have not been affected significantly by the of barrel temperatures the barrel temperature fromsignificantly 150 ◦ C to 300 leads to a melting and cooling studied. curves of the nanocomposites have not been affected by the range of barrel temperatures studied. Increasing the barrel temperature from 150 °C to 300 °C leads to a general slow increasing trend in the rate of crystallization (from 60.7% to 74.1%). Similar results of barrel temperatures studied. Increasing the barrel temperature from 150 °C to 300 °C leads to awere general slow increasing trend in the rate of crystallization (from 60.7% to 74.1%). Similar results were reported by slow Hedesiu et al. trend [65], on studying the effect of (from temperature high-density polyethylene. general increasing in the rate of crystallization 60.7% to on 74.1%). Similar results were reported by Hedesiu et al. [65], on studying the effect of temperature on high-density polyethylene. by Hedesiu et al. on studying the effect the of temperature on high-density polyethylene. They reported postulated that, with an [65], increase in temperature, molecular movement of polymers began to They postulated that, with an increase in temperature, the molecular movement of polymers began They postulated that, an increase in temperature, the there molecular movement polymers beganof the shift from amorphous to with lamellae surface. On annealing, is a shift in theofreorganization to shift from amorphous to lamellae surface. On annealing, there is a shift in the reorganization of the to shift from amorphous to lamellae surface. On annealing, therethe is aarrangement shift in the reorganization of the amorphous andand the the crystallization boosts of the crystallization amorphous crystallizationregion, region,this this in in turn, turn, boosts the arrangement of the crystallization amorphous and the crystallization region, this in turn, boosts the arrangement of the crystallization order.order. Due Due to regular shifts in in thethe amorphous thethickness thickness amorphous reduced, to regular shifts amorphous region, region, the ofof thethe amorphous areaarea reduced, order. Due to regular shifts in the amorphous region, the thickness of the amorphous area reduced, as a result of which more crystals were exposed [65]. as a result of which more crystals were exposed [65].
as a result of which more crystals were exposed [65].
Figure 17. Effect of barrel temperature onthe the crystallization temperature of thethe injection molded Figure 17. Effect of barrel temperature temperature injection molded Figure 17. Effect of barrel temperatureon on the crystallization crystallization temperature of of the injection molded HDPE/TiO 2 nanocomposites. HDPE/TiO nanocomposites. HDPE/TiO 2 nanocomposites. 2
Figure 18. Effect of barrel temperature on the melting temperature of the injection molded HDPE/TiO2 Figure 18. Effect of barrel temperature on the melting temperature of the injection molded HDPE/TiO2
Figure 18. Effect of barrel temperature on the melting temperature of the injection molded nanocomposites. nanocomposites. HDPE/TiO2 nanocomposites.
Materials 2017, 10, 85
18 of 25
Materials 2017, 10, 85
18 of 24
Table 5. Differential scanning calorimetry (DSC) results showing the influence of barrel temperature. Table 5. Differential scanning calorimetry (DSC) results showing the influence of barrel temperature. Sample Designation Barrel Temperature (◦ C) Degree of Crystallinity (%)
Sample 1 12 23 34 45 5
Designation BT1 BT1 BT2 BT2 BT3 BT3 BT4 BT5 BT4 BT5
Barrel Temperature (°C) 150 150175 175200 200250 250300 300
Degree of Crystallinity (%) 60.7 60.7 60.7 60.7 62.5 62.5 66.5 74.1 66.5 74.1
The temperature at which the last trace of crystal vanishes is defined as the melting temperature. The temperature at which the last trace of crystal vanishes is defined as the melting temperature. Figures 17 and 18, and Table 5 indicate that the barrel temperature has a minor effect on the melting Figures 17 and 18, and Table 5 indicate that the barrel temperature has a minor effect on the melting and crystallization temperatures. Similar research was conducted by Ranjusha et al. [41] who examined and crystallization temperatures. Similar research was conducted by Ranjusha et al. [41] who the influence of barrel temperature on the hybrid nanocomposites. They summarized that for injection examined the influence of barrel temperature on the hybrid nanocomposites. They summarized that molded nanocomposites, the barrel temperature has a significant effect on the thermal and mechanical for injection molded nanocomposites, the barrel temperature has a significant effect on the thermal stability of the samples. Bociaga al. [26] analyzed theal.influences of injection temperature, injection and mechanical stability of theetsamples. Bociaga et [26] analyzed the influences of injection velocity, and mold temperature on injection molded high-density polyethylene. They concluded that temperature, injection velocity, and mold temperature on injection molded high-density thepolyethylene. injection temperature and injection velocity have a slight influence on the improvement of They concluded that the injection temperature and injection velocity have a slightthe crystallinity ofthe theimprovement nanocomposites. theofincrement of the mold temperature increasedofthe influence on of theHowever, crystallinity the nanocomposites. However, the increment degree of crystallinity. They suggested that with an increase in mold temperature, the polymer the mold temperature increased the degree of crystallinity. They suggested that with an increase in of interest a longer time to cool down in thehas mold cavity andtoatcool high temperature, thecavity polymer mold has temperature, the polymer of interest a longer time down in the mold andtends at to high formtemperature, larger pores.the Aspolymer a result tends of this,tothe product has a higher degree of crystallinity effect form larger pores. As a result of this, the product [26]. has aThe higher of crystallinity [26]. The effect residence time on the melting and temperature, is of degree residence time on the melting andofcrystallization temperature, andcrystallization degree of crystallization and degree of crystallization is presented in Figures 19 and 20 and Table 6. presented in Figures 19 and 20 and Table 6.
Figure 19. Effect of barrel temperature on the crystallization temperature of the injection molded Figure 19. Effect of barrel temperature on the crystallization temperature of the injection molded HDPE/TiO2 nanocomposites. HDPE/TiO2 nanocomposites. Table 6. DSC results showing the influence of residence time. Table 6. DSC results showing the influence of residence time.
Sample Sample 1 12 23 34 45 5
Designation Holding Time (min) Degree of Crystallinity (%) Designation Holding Degree67.9 of Crystallinity (%) RT1 30 Time (min) RT2 40 75.8 RT1 30 67.9 RT3 50 40 66.4 75.8 RT2 RT3 RT4 60 50 58.2 66.4 RT4 60 RT5 70 56.4 58.2 RT5
70
56.4
Materials 2017, 10, 85 Materials 2017, 10, 85 Materials 2017, 10, 85
19 of 25 19 of 24 19 of 24
Figure 20. Effect of residence time on the melting temperature of the injection molded nanocomposites. Figure 20.20. Effect ofthe theinjection injectionmolded moldednanocomposites. nanocomposites. Figure Effectofofresidence residencetime timeon onthe the melting melting temperature temperature of
Influence of TiO2 on the crystal morphology of HDPE was also evaluated using X-ray powder Influence TiO 2 onthe thecrystal crystal morphology of HDPE evaluated using X-ray powder Influence ofof TiO on morphology HDPE was was also evaluated usingdistances, X-ray powder diffraction (XRD). It2 is a powerful technique in determining thealso crystal’s interplanar size diffraction (XRD).It Itisisa apowerful powerfultechnique technique in in determining determining the size diffraction (XRD). the crystal’s crystal’sinterplanar interplanardistances, distances, size and its structure [18,66]. and its structure [18,66]. and its structure [18,66]. The standard diffraction peak for high-density polyethylene is situated at 2θ = 21.4° and 23.7° ◦ and The standard diffraction peak forhigh-density high-density isissituated atat2θ and 23.7° which are in agreement with the for diffraction peakspolyethylene obtained [67,68]. The presence of TiO 2 in the The standard diffraction peak polyethylene situated 2θ= =21.4° 21.4 23.7◦ which are in agreement with the diffraction peaks obtained [67,68]. The presence of TiO 2 in the nanocomposites was detected using XRD patterns. the literature, can be concluded that2 XRD which are in agreement with the diffraction peaksFrom obtained [67,68]. itThe presence of TiO in the nanocomposites was detected using XRD patterns. From[8,69]. the literature, itfrom can be concluded that XRD patterns of TiO 2 shows peaks at 25.4°, 37.9°, and 48.1° As seen Figures 21 and 22, nanocomposites was detected using XRD patterns. From the literature, it can be concludedthe that patterns of TiO2 shows peaks at 25.4°,peaks 37.9°,at and [8,69]. As36.1° seen from Figures 21 22, the ◦ , 48.1° diffraction 21.4°, that TiOand 2 is21 evenly XRD patternspattern of TiO2shows showsprominent peaks at 25.4◦ , 37.9 and23.7°, 48.1◦and [8,69]. Asimplying seen from Figures and 22, diffraction pattern shows prominent peaks 7atand 21.4°, and 36.1° implying that TiO 2 is evenly ◦23.7°, the polymeric matrix. Tables 8 show interplanar and thedistributed diffractionin pattern shows prominent peaks at 21.4 , 23.7a◦ ,summary and 36.1◦ofimplying thatdistances TiO2 is evenly distributed in the polymeric matrix. Tables 7 and 8 show a summary of interplanar distances and crystal sizes (L hkl) calculated from the diffraction peaks. However, from Tables 7 and 8 it can be distributed in the polymeric matrix. Tables 7 and 8 show a summary of interplanar distances and crystal sizes (Lthe hkl) calculated from the diffraction peaks. However, from Tables 7 and 8 it can be inferred interplanar (i.e., d-spacing) are not significantly affected barrel crystal sizesthat (Lhkl ) calculated fromdistances the diffraction peaks. However, from Tables 7 and 8 it canby be inferred inferred that the interplanar temperature or residence time. distances (i.e., d-spacing) are not significantly affected by barrel that the interplanar distances (i.e., d-spacing) are not significantly affected by barrel temperature or temperature or residence time. residence time.
Figure 21. X-ray diffraction pattern for HDPE/TiO2 nanocomposites fabricated at various barrel Figure 21.21. X-ray X-ray diffraction diffractionpattern pattern HDPE/TiO fabricated at barrel various Figure for for HDPE/TiO 2 nanocomposites fabricated at various 2 nanocomposites temperatures. temperatures. barrel temperatures.
Materials 2017, 10, 85 Materials 2017, 10, 85
20 of 25 20 of 24
Table7.7.Summary Summaryofofthe theparameters parametersretrieved retrievedfrom fromthe theX-ray X-raydiffraction diffraction(XRD) (XRD)curves. curves. Table Sample
Sample 1 2 3 4
1 2 3 4
55
Designation
Designation
Barrel Temperature (°C)
Barrel Temperature (◦ C)
BP1
BP1
BP2
BP2
BP3
BP3
BP4
150 175 200
150 175 200 250
BP4
250
BP5 BP5
300 300
Crystal Planes 2Ɵ (°) d (A) 2θ (◦ ) d (A) 110 21.2 4.2 110 200 21.223.6 4.23.6 200 23.6 3.6 110 21.4 4.1 110 21.4 4.1 200 23.8 3.7 200 23.8 3.7 110 21.4 4.1 110 21.4 4.1 200 200 23.723.7 3.83.8 110 21.4 4.2 110 21.4 4.2 200 200 23.723.7 3.73.7 110 21.4 4.24.2 110 21.4 200 200 23.723.7 3.83.8
Crystal Planes
β (°) Lhkl (nm) Lhkl (nm) 0.40 35.2 0.40 35.2 0.41 34.5 0.41 34.5 0.40 35.3 0.40 35.3 0.47 30.2 0.47 30.2 0.43 34.6 0.43 34.6 0.63 22.5 0.63 22.5 0.42 33.4 0.42 33.4 0.61 23.2 0.61 23.2 0.40 34.6 0.40 34.6 0.72 19.7 0.72 19.7
β (◦ )
Figure diffraction pattern for HDPE/TiO fabricated at various residence times. Figure22. 22.X-ray X-ray diffraction pattern for HDPE/TiO 2 nanocomposites fabricated at various residence 2 nanocomposites times. Table 8. Summary of the parameters retrieved from the XRD curves.
Table 8. Summary of the parameters retrieved from the XRD curves. Sample
Sample 1 2
1 2
3
Designation
Designation
30
HT3
50
HT1
HT3 HT5
Crystal Planes
Residence Time (min)
HT1
HT5
3
Residence Time (min)
30 50
70
70
2θ (◦ )
Crystal Planes 2Ɵ (°) 110 21.4 200 110 23.821.4 200 23.8 110 21.4 110 200 23.721.4 200 110 21.323.7 200 110 23.621.3 200 23.6
d (A)
d (A) 4.1 3.74.1 3.7 4.2 3.74.2 4.23.7 3.84.2 3.8
β (◦ )
β (°)
0.43 0.43 0.52
0.52
0.42 0.42 0.61
0.61 0.39 0.39 0.55 0.55
Lhkl (nm)
Lhkl (nm) 32.8 32.8 27.3 27.3 33.6 33.6 23.2 23.2 36.2 36.2 25.8 25.8
According to Wang et al. [70], the addition of TiO2 onto HDPE matrix has no effect on the lattice According to Wang et al. [70], the addition of TiO2 onto HDPE matrix has no effect on the lattice parameter. However, these nanoparticles help to increase the laminar thickness which results in the parameter. However, these nanoparticles help to increase the laminar thickness which results in the formation of perfect crystals. The crystal size was evaluated using the Scherrer derived relationship [33]. formation of perfect crystals. The crystal size was evaluated using the Scherrer derived relationship Crystal size of the nanocomposites increased with the escalation of the residence time of the polymeric [33]. Crystal size of the nanocomposites increased with the escalation of the residence time of the polymeric mixture in the barrel (Table 7). However, the rise in barrel temperature had an adverse
Materials 2017, 10, 85
21 of 25
mixture in the barrel (Table 7). However, the rise in barrel temperature had an adverse effect on the crystal size (Lhkl ) (Table 8). Decrease in crystal size can be postulated in such way that with higher temperature and shorter residence time, the formation of cross-link bond, reorganization, and chain folding between polymers during the crystallization process is hindered, resulting in a distorted lattice and incomplete crystals [70]. From XRD patterns, it can be concluded that the nanocomposites had an even dispersion of nanoparticles in the polymeric matrix irrespective of barrel temperature and retention time. For crystal plane 110, with increase in barrel temperature from 150 ◦ C to 300 ◦ C the crystallite size decreased from 35.2 to 34.6, in turn indicating the formation of perfect crystals. 4. Conclusions Nano-sized titanium dioxide enriched HDPE nanocomposites were fabricated through injection molding using dumbbell shaped inserts. In the injection molding process, the two main control variables are the barrel temperature and the residence time. Hence this study aimed to compare the nanocomposites’ mechanical, thermal, and structural properties obtained by changing these operating parameters. The SEM-EDS, FTIR, and XRD results confirmed the uniform distribution of TiO2 nanoparticles on the surface of the matrix. The degradation temperature decreased with an increase in the barrel temperature and residence time, however, the rate of crystallization showed a consistent rise in both cases; rate of crystallization was increased up to 75%. The results revealed that there is no specific barrel temperature or residence time as an optimum value; for such nanomaterials, a range of temperature (150 ◦ C–300 ◦ C) can be considered for manufacturing these nanocomposites. However, the authors recommend researchers to use an operating barrel temperature lower than 300 ◦ C since the polymer’s initial degradation temperature is about 424–460 ◦ C. When samples were processed at temperatures around 300 ◦ C, black spots were observed on the injection molded nanocomposites. Lastly, it is also recommended to use a temperature higher than 150 ◦ C for easy material flow while injection molding. To conclude, the effect of varying the injection molding process parameters was studied and a wide range of barrel temperature and residence times can be used depending on the specific needs of the application. Acknowledgments: Authors would like to acknowledge UPAR (UAEU-NRF) research grant for this research. Authors would also like to thank Eng. Abdul Sattar for his help in mechanical characterization work and Prashanth Sankaranarayanan (Laboratory Technician, Petroleum Geoscience, The Petroleum Institute, Abu Dhabi) for his assistance in the SEM-EDS analyses. Author Contributions: M.S.M. and A.H.I.M. conceived and designed the experiments; A.M., H.P. and U.M.K. performed the experiments; M.S.M. and A.H.I.M. analyzed the data; U.M.K. contributed reagents/materials/analysis tools, and A.H.I.M., M.S.M., A.M. and H.P. wrote the paper. Conflicts of Interest: The authors declare no conflict of interest.
References 1. 2.
3.
4.
Kothalkar, A.; Sharma, A.S.; Biswas, K.; Basu, B. Novel HDPE–quasicrystal composite fabricated for wear resistance. Philos. Mag. 2011, 91, 2944–2953. [CrossRef] Mourad, A.-H.I.; Fouad, H.; Elleithy, R. Impact of some environmental conditions on the tensile, creep-recovery, relaxation, melting and crystallinity behaviour of UHMWPE-GUR 410-medical grade. Mater. Des. 2009, 30, 4112–4119. [CrossRef] Tripathi, G.; Basu, B. Injection-molded high-density polyethylene-hydroxyapatite-aluminum oxide hybrid composites for hard-tissue replacement: Mechanical, biological, and protein adsorption behavior. J. Appl. Polym. Sci. 2012, 124, 2133–2143. [CrossRef] Mohamed, F.H.; Mourad, A.-H.I.; Barton, D.C. UV irradiation and aging effects on nanoscale mechanical properties of ultra high molecular weight polyethylene for biomedical implants. Plast. Rubber Compos. 2013, 37, 346–352. [CrossRef]
Materials 2017, 10, 85
5.
6. 7.
8. 9. 10.
11.
12.
13.
14. 15.
16. 17. 18.
19. 20. 21. 22. 23. 24. 25. 26.
22 of 25
Khan, Z.A.; Kamaruddin, S.; Siddiquee, A.N. Feasibility study of use of recycled High Density Polyethylene and multi response optimization of injection moulding parameters using combined grey relational and principal component analyses. Mater. Des. 2010, 31, 2925–2931. [CrossRef] Nath, S.; Bodhak, S.; Basu, B. HDPE-Al2 O3 -HAp composites for biomedical applications: Processing and characterizations. J. Biomed. Mater. Res. B Appl. Biomater. 2009, 88, 1–11. [CrossRef] [PubMed] Tripathi, G.; Basu, B. In vitro osteogenic cell proliferation, mineralization, and in vivo osseointegration of injection molded high-density polyethylene-based hybrid composites in rabbit animal model. J. Biomater. Appl. 2014, 29, 142–157. [CrossRef] [PubMed] Li, J.-F.; Xu, Z.-L.; Yang, H.; Yu, L.-Y.; Liu, M. Effect of TiO2 nanoparticles on the surface morphology and performance of microporous PES membrane. Appl. Surf. Sci. 2009, 255, 4725–4732. [CrossRef] Wang, J.F.; Liu, X.Y.; Luan, B. Fabrication of Ti/polymer biocomposites for load-bearing implant applications. J. Mater. Process. Technol. 2008, 197, 428–433. [CrossRef] Sadi, A.Y.; Shokrgozar, M.A.; Homaeigohar, S.S.; Khavandi, A. Biological evaluation of partially stabilized zirconia added HA/HDPE composites with osteoblast and fibroblast cell lines. J. Mater. Sci. Mater. Med. 2008, 19, 2359–2365. [CrossRef] [PubMed] Fouad, H.; Mourad, A.-H.I.; Barton, D.C. Effect of pre-heat treatment on the static and dynamic thermo-mechanical properties of ultra-high molecular weight polyethylene. Polym. Test. 2005, 24, 549–556. [CrossRef] Alothman, O.Y.; Almajhdi, F.N.; Fouad, H. Effect of gamma radiation and accelerated aging on the mechanical and thermal behavior of HDPE/HA nano-composites for bone tissue regeneration. Biomed. Eng. Online 2013, 12, 95. [CrossRef] [PubMed] Faiz, S.; Anis, A.; Luqman, M.; al Zahrani, S.M. Studies on thermal, mechanical, morphological, and viscoelastic properties of polybenzimidazole fiber reinforced high density polyethylene composites. Polym. Compos. 2016, 37, 5–13. [CrossRef] Mao, Q.; Wyatt, T.P.; Chen, J.; Wang, J. Insert injection molding of high-density polyethylene single-polymer composites. Polym. Eng. Sci. 2015, 55, 2448–2456. [CrossRef] Tripathi, G.; Gough, J.E.; Dinda, A.; Basu, B. In vitro cytotoxicity and in vivo osseointergration properties of compression-molded HDPE-HA-Al2 O3 hybrid biocomposites. J. Biomed. Mater. Res. A 2013, 101, 1539–1549. [CrossRef] [PubMed] Pinto, G.; López-gonzález, C.; Jiménez-martín, A. Polymer composites prepared by compression molding of a mixture of carbon black and nylon 6 powder. Polym. Compos. 1999, 20, 804–808. [CrossRef] Yang, F.; Ou, Y.; Yu, Z. Polyamide 6/silica nanocomposites prepared byin situ polymerization. J. Appl. Polym. Sci. 1998, 69, 355–361. [CrossRef] Kaleel, S.H.A.; Bahuleyan, B.K.; Masihullah, J.; Al-Harthi, M. Thermal and Mechanical Properties of Polyethylene/Doped-TiO2 Nanocomposites Synthesized Using In Situ Polymerization. J. Nanomater. 2011, 2011, e964353. Vetrivel, V.; Rajendran, K.; Kalaiselvi, V. Synthesis and characterization of pure titanium dioxide nanoparticles by sol- gel method. Int. J. ChemTech Res. 2015, 7, 1090–1097. Wilkie, C.A.; Morgan, A.B. Fire Retardancy of Polymeric Materials, 2nd ed.; CRC Press: Boca Raton, FL, USA, 2009. Callister, W.D.; Rethwisch, D.G. Materials Science and Engineering: An Introduction; Wiley: New York, NY, USA, 2009; p. 992. Liou, A.-C.; Chen, R.-H. Injection molding of polymer micro- and sub-micrometers structures with high-aspect ratios. Int. J. Adv. Manuf. Technol. 2005, 28, 1097–1103. [CrossRef] Huang, L.; Wang, Z.; Zheng, G.; Guo, J.Z.; Dai, K.; Liu, C. Enhancing oriented crystals in injection-molded HDPE through introduction of pre-shear. Mater. Des. 2015, 78, 12–18. [CrossRef] Zhil’tsova, T.V.; Oliveira, M.S.A.; Ferreira, J.A.F. Relative influence of injection molding processing conditions on HDPE acetabular cups dimensional stability. J. Mater. Process. Technol. 2009, 209, 3894–3904. [CrossRef] Pagès, P. Characterization of Polymer Materials Using FT-IR and DSC Techniques; Universidade da Coruña: Coruña, Spain, 2005. Bociaga, E.; Palutkiewicz, P. The influence of injection molding parameters and blowing agent addition on selected properties, surface state, and structure of HDPE parts. Polym. Eng. Sci. 2013, 53, 780–791. [CrossRef]
Materials 2017, 10, 85
27. 28.
29. 30.
31. 32. 33. 34. 35. 36. 37.
38.
39.
40. 41.
42. 43. 44. 45. 46.
47.
48.
23 of 25
Mourad, A.-H.I. Thermo-mechanical characteristics of thermally aged polyethylene/polypropylene blends. Mater. Des. 2010, 31, 918–929. [CrossRef] Mourad, A.-H.I.; Akkad, R.O.; Soliman, A.A.; Madkour, T.M. Characterisation of thermally treated and untreated polyethylene–polypropylene blends using DSC, TGA and IR techniques. Plast. Rubber Compos. 2009, 38, 265–278. [CrossRef] Bilewicz, M.; Viana, J.; Dobrzanski, ´ L. Polymer composite strengthening by developed injection moulding technique. Arch. Mater. Sci. Eng. 2008, 30, 69–72. Lizundia, E.; Vilas, J.L.; León, L.M. Crystallization, structural relaxation and thermal degradation in Poly(L-lactide)/cellulose nanocrystal renewable nanocomposites. Carbohydr. Polym. 2015, 123, 256–265. [CrossRef] [PubMed] Fei, P.; Fei, B.; Yu, Y.; Xiong, H.; Tan, J. Thermal properties and crystallization behavior of bamboo fiber/high-density polyethylene composites: Nano-TiO2 effects. J. Appl. Polym. Sci. 2014, 131. [CrossRef] Olad, A. Polymer/Clay Nanocomposites. In Advances in Diverse Industrial Applications of Nanocomposites; Reddy, B., Ed.; InTech: Rijeka, Croatia, 2011. Klug, H.P.; Alexander, L.E. X-ray Diffraction Procedures: For Polycrystalline and Amorphous Materials, 2nd ed.; Wiley: Hoboken, NJ, USA, 1974. Rideal, G.R.; Padget, J.C. The thermal-mechanical degradation of high density polyethylene. J. Polym. Sci. Polym. Symp. 2007, 57, 1–15. [CrossRef] Katmer, S.; Karatas, C. Effects of injection molding conditions on residual stress in HDPE and PP parts. J. Fac. Eng. Archit. GAZI Univ. 2015, 30, 319–327. Mozumder, M.S.; Mourad, A.-H.I.; Perinpanayagam, H.; Zhu, J. Nano-SiO2 Enriched Biocompatible Powder Coatings. Mater. Today Proc. 2015, 2, 147–152. [CrossRef] Shi, W.; Mozumder, M.S.; Zhang, H.; Zhu, J. MTA-enriched nanocomposite TiO(2)-polymeric powder coatings support human mesenchymal cell attachment and growth. Biomed. Mater. 2012, 7, 055006. [CrossRef] [PubMed] Mozumder, M.S.; Zhu, J.; Perinpanayagam, H. Titania-polymeric powder coatings with nano-topography support enhanced human mesenchymal cell responses. J. Biomed. Mater. Res. A 2012, 100, 2695–2709. [CrossRef] [PubMed] Mozumder, M.S.; Mourad, A.-H.I.; Perinpanayagam, H.; Zhu, J. NanoTiO2 -Enriched Biocompatible Polymeric Powder Coatings: Adhesion, Thermal and Biological Characterizations. Adv. Mater. Res. 2014, 995, 113–124. [CrossRef] Hou, N.; Perinpanayagam, H.; Mozumder, M.; Zhu, J. Novel Development of Biocompatible Coatings for Bone Implants. Coatings 2015, 5, 737–757. [CrossRef] Ranjusha, J.P.; Anjana, R.; George, K.E. Effect of Moulding Temperature on the Properties of Polypropylene/High Density Polyethylene/Clay/Glass Fibre Composites. Int. J. Eng. Res. Appl. 2012, 2, 1922–1926. FTIR Instrumentation and Theory. Available online: http://chemistry.oregonstate.edu/courses/ch361-464/ ch362/irinstrs.htm (accessed on 10 April 2016). Pathak, L.C.; Venkateswarlu, K.; Bandopadhyay, A.; Ray, A.K. Advanced Materials: Proceedings of the Indo-Malaysian Joint Workshop (WAM-2002); Allied Publishers: New Delhi, India, 2003. IR Absorption Table. Available online: http://www.chem.ucla.edu/~webspectra/irtable.html (accessed on 6 March 2016). Raza, M.; Bachinger, A.; Zahn, N.; Kickelbick, G. Interaction and UV-Stability of Various Organic Capping Agents on the Surface of Anatase Nanoparticles. Materials 2014, 7, 2890–2912. [CrossRef] Fasano, M.; Bigdeli, M.B.; Sereshk, M.R.V.; Chiavazzo, E.; Asinari, P. Thermal transmittance of carbon nanotube networks: Guidelines for novel thermal storage systems and polymeric material of thermal interest. Renew. Sustain. Energy Rev. 2015, 41, 1028–1036. [CrossRef] Sotomayor, M.E.; Krupa, I.; Várez, A.; Levenfeld, B. Thermal and mechanical characterization of injection moulded high density polyethylene/paraffin wax blends as phase change materials. Renew. Energy 2014, 68, 140–145. [CrossRef] Kumar, B.R.B.; Doddamani, M.; Zeltmann, S.E.; Gupta, N.; Ramesh, M.R.; Ramakrishna, S. Processing of cenosphere/HDPE syntactic foams using an industrial scale polymer injection molding machine. Mater. Des. 2016, 92, 414–423.
Materials 2017, 10, 85
49. 50.
51.
52. 53.
54. 55. 56. 57. 58. 59.
60.
61.
62. 63. 64.
65.
66. 67.
68.
24 of 25
Pegoretti, A.P.A.; Dorigato, A. Tensile mechanical response of polyethylene—Clay nanocomposites. eXPRESS Polym. Lett. 2007, 1, 123–131. [CrossRef] Bartczak, Z.; Argon, A.; Cohen, R.; Weinberg, M. Toughness mechanism in semi-crystalline polymer blends: II. High-density polyethylene toughened with calcium carbonate filler particles. Polymer 1999, 40, 2347–2365. [CrossRef] Su, R.; Wang, K.; Zhang, Q.; Chen, F.; Fu, Q. Effect of melt temperature on the phase morphology, thermal behavior and mechanical properties of injection-molded PP/LLDPE blends. Chin. J. Polym. Sci. 2010, 28, 249–255. [CrossRef] Zhou, Y.; Mallick, P.K. Effects of melt temperature and hold pressure on the tensile and fatigue properties of an injection molded talc-filled polypropylene. Polym. Eng. Sci. 2005, 45, 755–763. [CrossRef] Mourad, A.-H.I.; Bekheet, N.; El-Butch, A.; Abdel-Latif, L.; Nafee, D.; Barton, D.C. The effects of process parameters on the mechanical properties of die drawn polypropylene. Polym. Test. 2005, 24, 169–180. [CrossRef] Mourad, A.-H.I.; Bekheet, N.; El-Butch, A.; Abdel-Latif, L.; Nafee, D. Effect of Die Drawing Process on the Mechanical Behaviour of Polypropylene. Key Eng. Mater. 2004, 261–263, 1677–1682. [CrossRef] Sepe, M. The Importance of Melt & Mold Temperature: Plastics Technology. 2011. Available online: http: //www.ptonline.com/columns/the-importance-of-melt-mold-temperature (accessed on 26 April 2016). Ellingham, S.T.D.; Thompson, T.J.U.; Islam, M. Thermogravimetric analysis of property changes and weight loss in incinerated bone. Palaeogeogr. Palaeoclimatol. Palaeoecol. 2015, 438, 239–244. [CrossRef] Boey, P.; Ho, W.; Bull, S.J. The effect of temperature on the abrasive wear of coatings and hybrid surface treatments for injection-moulding machines. Wear 2005, 258, 149–156. [CrossRef] Bayar, S.; Delale, F.; Li, J. Effect of Temperature on Mechanical Properties of Nanoclay-Reinforced Polymeric Nanocomposites. II: Modeling and Theoretical Predictions. J. Aerosp. Eng. 2014, 27, 505–519. [CrossRef] Leszczynska, ´ A.; Njuguna, J.; Pielichowski, K.; Banerjee, J.R. Polymer/montmorillonite nanocomposites with improved thermal properties: Part I. Factors influencing thermal stability and mechanisms of thermal stability improvement. Thermochim. Acta 2007, 453, 75–96. [CrossRef] Davis, C.H.; Mathias, L.J.; Gilman, J.W.; Schiraldi, D.A.; Shields, J.R.; Trulove, P.; Sutto, T.E.; Delong, H.C. Effects of melt-processing conditions on the quality of poly(ethylene terephthalate) montmorillonite clay nanocomposites. J. Polym. Sci. B Polym. Phys. 2002, 40, 2661–2666. [CrossRef] Da Silva, G.R.; da Silva-Cunha, A.; Behar-Cohen, F., Jr.; Ayres, E.; Oréfice, R.L. Biodegradation of polyurethanes and nanocomposites to non-cytotoxic degradation products. Polym. Degrad. Stab. 2010, 95, 491–499. [CrossRef] Fang, L.; Leng, Y.; Gao, P. Processing and mechanical properties of HA/UHMWPE nanocomposites. Biomaterials 2006, 27, 3701–3707. [CrossRef] [PubMed] Mittal, V. (Ed.) Surface Modification of Nanotube Fillers; Wiley-VCH Verlag GmbH & Co. KGaA: Weinheim, Germany, 2011; pp. I–XV. Hedesiu, C.; Demco, D.E.; Kleppinger, R.; Buda, A.A.; Blümich, B.; Remerie, K.; Litvinov, V.M. The effect of temperature and annealing on the phase composition, molecular mobility and the thickness of domains in high-density polyethylene. Polymer 2007, 48, 763–777. [CrossRef] Sampath, S.; Isdebski, T.; Jenkins, J.E.; Ayon, J.V.; Henning, R.W.; Orgel, J.P.R.O.; Antipoa, O.; Yarger, J.L. X-ray diffraction study of nanocrystalline and amorphous structure within major and minor ampullate dragline spider silks. Soft Matter 2012, 8, 6713–6722. [CrossRef] [PubMed] Han, G.; Lei, Y.; Wu, Q.; Kojima, Y.; Suzuki, S. Bamboo–Fiber Filled High Density Polyethylene Composites: Effect of Coupling Treatment and Nanoclay. J. Polym. Environ. 2008, 16, 123–130. [CrossRef] Jafarzadeh, R.Y.Y. Effect of TiO2 nanoparticles on structure and properties of high density polyethylene membranes prepared by thermally induced phase separation method. Polym. Adv. Technol. 2015, 26, 392–398. [CrossRef] Vatanpour, V.; Madaeni, S.S.; Khataee, A.R.; Salehi, E.; Zinadini, S.; Monfared, H.A. TiO2 embedded mixed matrix PES nanocomposite membranes: Influence of different sizes and types of nanoparticles on antifouling and performance. Desalination 2012, 292, 19–29. [CrossRef]
Materials 2017, 10, 85
69. 70.
25 of 25
Wang, S.; Zhang, J. Non-isothermal crystallization kinetics of high density polyethylene/titanium dioxide composites via melt blending. J. Therm. Anal. Calorim. 2013, 115, 63–71. [CrossRef] Gu, J.; Xu, H.; Wu, C. Thermal and Crystallization Properties of HDPE and HDPE/PP Blends Modified with DCP. Adv. Polym. Technol. 2014, 33. [CrossRef] © 2017 by the authors; licensee MDPI, Basel, Switzerland. This article is an open access article distributed under the terms and conditions of the Creative Commons Attribution (CC BY) license (http://creativecommons.org/licenses/by/4.0/).