On the Learnability of Two Representations of Equivalence Partitioning and Boundary Value Analysis Tafline Murnane1, Karl Reed and Richard Hall Department of Computer Science and Computer Engineering La Trobe University, Bundoora, Australia
[email protected],
[email protected],
[email protected]
Abstract Currently, Equivalence Partitioning and Boundary Value Analysis are taught at La Trobe University using Myers’ original representation of these black-box testing methods. We previously proposed an alternative representation called Atomic Rules. In this paper we present the statistical results of two similar experiments that examine which of these approaches enable students to write more complete and correct black-box test sets and which approach students prefer to use. We compare the results of these experiments and discuss how the results could change the teaching of black-box testing methods at La Trobe University and in industry.
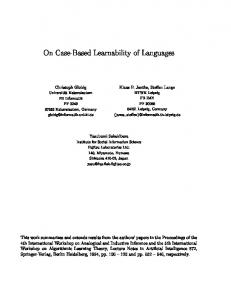
1. Introduction In this paper we present the results of two similar experiments in which two groups of novice software testers were exposed to two different representations of Equivalence Partitioning (EP) and Boundary Value Analysis (BVA): Myers’ original definition [19] and the corresponding Atomic Rules representation [17]. The aim was to determine which representation enabled the testers to write more complete and correct black-box test sets. The testers who participated in the experiment were third and fourth year students enrolled in a software testing subject at La Trobe University. Thirty-two students participated in 2004 and forty in 2005. Each group was given a two-hour lecture on one of the representations (Figure 1). During a subsequent tutorial, students were tested on their comprehension of EP and BVA by deriving black-box test cases from a fictional specification. To ensure every student had equal opportunity to learn the two representations, the groups were subsequently swapped and the process repeated. An Initial Questionnaire was used in the first lecture to collect data on student’s current understanding of blackbox testing methods and on their previous programming and testing experience. A Reflect and Review Questionnaire was used in the final lecture to collect data on student’s initial and final understanding of EP and BVA and on their preferred method representation. 1 Ms. Murnane is also currently working as a Software Test Consultant for K. J. Ross & Associates in Melbourne, Australia.
Proceedings of the 2007 Australian Software Engineering Conference (ASWEC'07) 0-7695-2778-7/07 $20.00 © 2007
Introductory Lecture Initial Questionnaire (all students)
Group 1
Group 2
Lecture Myers Representation
Lecture Atomic Rules Representation
Tutorial Myers Representation
Tutorial Atomic Rules Representation
Lecture Atomic Rules Representation
Lecture Myers Representation
Tutorial Atomic Rules Representation
Tutorial Myers Representation
Final Lecture Reflect & Review Questionnaire (all students)
Figure 1: The experiment process.
While the aims of the two experiments and materials presented during lectures were the same for both years, three changes were made in 2005 that were significant enough for it to be considered to be a different experiment. As each group’s lecture took place at the same time in different locations, two lecturers were required. In 2004, the first author of this paper taught Atomic Rules while the second taught Myers. Then, to eliminate the extraneous variable of student preference for lecturer, the lecturers were swapped in 2005. Also, the 2004 results suggested that students could handle more challenging specifications during tutorials. Thus, longer and more complex specifications were used in 2005. Lastly, to ensure students had enough time to complete their work, tutorials were increased from one hour in 2004 to two hours in 2005. To avoid conflict with other university classes or commitments (a factor which could impact student performance [6]), all work for this part of the experiment was completed in class. These experiments are part of a larger project which explores the learnability, usability and effectiveness of black-box testing methods. In this paper we investigate representation learnability, which we define to be the ease at which a novice can gain knowledge of a
particular concept, and usability, which we define to be the level of satisfaction a tester feels when using a particular representation. The larger project will involve an industry-based case study in which we will compare the effectiveness of Atomic Rules and Systematic Method Tailoring (which enables new Atomic Rules and new black-box methods to be defined [18]) to the blackbox methods used by professional testers. We will also determine whether industry testers use ad hoc or exploratory test case selection rules that are not covered by existing black-box methods, and if so, will determine whether they can be described as Atomic Rules. The remainder of this paper is structured as follows. We present a brief overview of Atomic Rules in Section 2. We discuss our experiment design in Section 3, including hypotheses, group allocation, threats to validity and the specifications used during tutorials. A preliminary analysis of the 2004 Reflect and Review questionnaire was published in [17]; in Section 4 we present the full experiment results, including data collected on other questionnaires and during tutorials. These results are discussed in Section 5. Finally, we present out conclusions and future work in Section 6.
2. Overview of the Atomic Rules Approach The Atomic Rules approach decomposes black-box testing methods into individual elements for partitioning a program’s input and output domains, selecting test data from each partition, optionally mutating the selected data values, and constructing test cases [17]. The aim of developing this generalised representation was to make black-box methods easier to learn and use by describing them more precisely. It resolves a number of consistency problems inherent in the original methods, including ambiguity issues that could cause testers using the same methods to produce vastly dissimilar test sets, and the problem of numerous versions of each method existing in the literature [17]. A characterisation schema was developed to give the methods a standard representation (Table 1) and the following four-step procedure2 was produced to standardise and describe the black-box test case selection process: 1. Select valid and invalid partitions for each input and/or output field by applying a Data-Set Selection Rule (DSSR) to each field. 2. Select at least one individual data value from each partition chosen step in 1 by applying a Data-Item Selection Rule (DISR) to each partition. 3. Mutate the data values selected in step 2 by applying a Data-Item Manipulation Rule (DIMR) to each data value. 4. Select various combinations of the data values chosen in steps 2 and 3 by applying a Test Case Construction Rule (TCCR) to create test cases.
When applied with the Atomic Rules from a particular black-box method or a variety of methods, this four-step test case selection procedure can be used to construct black-box test cases in the usual way [17]. 2
Although step 3 was defined after the initial publication of the Atomic Rules approach [17] and after the experiment, it is included here for completeness.
Proceedings of the 2007 Australian Software Engineering Conference (ASWEC'07) 0-7695-2778-7/07 $20.00 © 2007
For example, consider the field ::= [0 – 150]. An EP DSSR that selects all values between the lower and upper boundaries of range-related fields (Table 1) could be applied, selecting the valid equivalence class [0 – 150]. A BVA DISR that selects the upper boundary value of an equivalence class could be applied to this class, selecting the valid data value 150. A Syntax Testing DIMR that adds an extra character (e.g. the letter a) to the start of a data value could be applied, selecting the invalid data value a150. If this was included in an input string with another field such as Surname ::= [A-Z, a-z, -]1-100, an EP TCCR that selects a test case containing one invalid value per test could be applied, which could result in the invalid test case Smith a150. Table 1: Example of an Atomic Rule [15]. Attribute Test Method Number Name Description Source Rule Type Set Type Valid or Invalid Original Datatype Test Datatype Test Data Length # Fields Populated # Tests Derived
Values Equivalence Partitioning EP3 Lower to Upper Boundary Selection Select an equivalence class containing all values that lie between the lower and upper boundaries of a field [19] DSSR Range Valid Integer, Real, Alpha, Non-Alphanumeric Same as original Same as original 1 0
3. Experiment Design The primary independent variable used in these experiments was the first black-box testing method representation learnt. The approach to manipulating the independent variable was the type technique [13] whereby the type of variable presented is varied over two separate treatments. In the following, we describe the experiment hypotheses, group allocation and threats to validity that relate to this experiment.
3.1 Hypotheses To compare the learnability and usability of the two representations, we measured the completeness (H11) and correctness (H13) of the black-box test sets derived, the efficiency of derivation (H12), the questions asked during derivation (H14) and the level of satisfaction the students experienced while deriving test cases (H15). Thus, the following hypotheses were defined. Completeness: H01: The completeness of the black-box test set derived by novice testers is independent of the approach used. H11: Novice testers using Atomic Rules derive a more complete test set compared to those using Myers’ approach. Efficiency: H02: The efficiency of black-box test case derivation by novice testers is independent of the approach used. H12: Novice testers using Atomic Rules derive test cases more efficiently compared to those using Myers’ approach.
Errors made (Correctness): H03: The number of errors made by novice testers during black-box test case derivation is independent of the approach used. H13: Novice testers using Atomic Rules make fewer errors during test case derivation compared to those using Myers’ approach. Questions asked: H04: The number of questions asked by novice testers during black-box test case derivation is independent of the approach used. H14: Novice testers using Atomic Rules ask fewer questions compared to those using Myers’ approach. User satisfaction: H05: There is no difference between the usability of Atomic Rules or Myers’ approach when used by novice testers in the derivation of black-box test cases. H15: Novice testers find Atomic Rules simpler to use than Myers’ approach when deriving black-box test cases.
These hypotheses are similar to several that were used in an experiment that compared how effective novice testers were in selecting appropriate software testing methods when using descriptions of the methods from a characterisation schema versus novices who used textbook descriptions of the methods [23].
3.2 Group Allocation The participants in our experiments were divided into two comparison groups [13]. To provide repetition, each group was divided into two subgroups, with each deriving test cases from a different specification (Table 2). A discussion of how group allocation affects validity is given in Section 3.4. Table 2: Number of participants per group and subgroup. Year 2004 2005
Group Subgroup Subgroup Total Subgroup Subgroup Total
1 2 1 2
Myers 13 5 18 10 10 20
Atomic Rules 8 6 14 8 12 20
3.3 Input Data Specifications The main requirement that was placed on the specifications that were used during tutorials was that they had to include at least one numerical range, one list of values and a number of different datatypes; e.g. alphas, numbers and symbols. This allowed students to derive tests for a ‘base’ set of set types and datatypes. One of the 2004 specifications was for a fictional Personal Details Recording System (Figure 2), while one of the 2005 specifications was for a Patient Record System (Figure 3). Both were written in a semi-formal notation and contained input fields defined using a combination of Backus-Naur Form and natural language. There were two primary differences between these specifications: length and complexity. In 2004, the top level non-terminal node contained five fields (including two spaces) whereas the corresponding node in 2005 contained fourteen fields. Thus, the 2005 specifications
Proceedings of the 2007 Australian Software Engineering Conference (ASWEC'07) 0-7695-2778-7/07 $20.00 © 2007
were substantially longer. Also, the 2005 specifications contained a recursive field definition, which made test case derivation more challenging (e.g. field). To compensate for this change, the tutorials were extended from one hour in 2004 to two hours in 2005. Specification: ::= ::= [100 – 999] ::= 1 to 100 characters from the sets alpha and nonalphanumeric (i.e. letters and/or symbols) ::= {Male | Female} ::= one to seven single spaces Example Record: 555
Smith
Male
Figure 2: Specification 1 – Personal Details System. Specification: ::= ˆ…“”ˆ…,ˆ…,ˆ… ::= 1 to 100 characters from sets alpha and non-alphanumeric (i.e. letters and symbols) ::= 1 to 150 characters from sets alpha and nonalphanumeric (i.e. letters and symbols) ::= ˆ Floor := ::= {Fredrick Building | John-Scott Memorial Ward | Mary House | Norman Building | … | Zane Square Building | Zoo Ward} ::= ::= [0 – 9] ::= | ::= {nd | rd | st | th} ˆ ::= one space ˆ… ::= one or more spaces Example Record: Joe Hamish Bloggs “Viral pneumonia, ear infection, and lower abdomen pain” 5th Floor, John-Scott Memorial Ward, 1234
Figure 3: Specification 2 – Patient Record System.
3.4 Threats to Validity In this section we explore threats to internal and external validity [13] that apply to our experiments. Internal Threats to Validity History. Experiment outcomes can be biased by time lapses between the application of the treatment variable and measurement of the dependent variable or between pre-test and post-test measurements [8] or if discussions take place between groups during that time [9]. This posed a minimal threat as treatment took place during a lecture that was between two hours and three days prior to measurement. To combat this threat, participants were asked not to discuss the experiment with each other until after the final lecture. As there was no assignment or exam during the experiment, we did not expect students to have a great need to hold discussions during that time. Maturation. Changes or differences in a participant’s internal condition (e.g. age, hunger, fatigue, boredom) [8], knowledge level [9], lecturer preference, or
enthusiasm [23] can bias results. For example, students who are excited about being involved in an experiment on a new technique may work harder on that technique. To ensure this did not bias results, Myers’ representation was referred to as Model 1 and Atomic Rules as Model 2 and students were not told which was new until after the final lecture. Also, students were informed that there would be a gift for every member of the class at the end of the experiment whether they chose to participate or not, which we hoped would compensate them for any disruption they may have experienced during the experiment3. To combat boredom, students were reminded that the work they completed during tutorials would prepare them for their assignments and exam and also for future work in industry. As tutorial attendance was not compulsory, bored students could choose not to attend class but were informed that the subject was an important part of their courses. As the experiments were run over six separate classes, it was hoped that fatigue and hunger did not affect results. Selecting students from the same year levels should have negated the knowledge threat [9]. To mitigate the potential lecturer preference bias threat, the lecturers were swapped in 2005. Instrumentation. This threat relates to research observers becoming accustomed to experiment materials or increasing their experience in measuring data [9]. To ensure the same standards were followed throughout analysis, standard measurement scales and analysis processes were followed. Also, to standardise analysis, one person was responsible for all data analysis. Selection. Random group allocation can be used to mitigate the threat that the groups will be biased; e.g. if one group has a higher mean intelligence level than the other [9]. Conversely, if participants allocate themselves to groups, then the sample within each group is voluntary, not random, allocation [4]. While random allocation was achieved in 2005 by drawing participant names out of a hat, it was not achieved in 2004 due to a timetabling problem, which resulted in students allocating themselves to groups according to their chosen tutorial day/time. However, an analysis of the average grade in each group for that subject revealed that there was no significant difference between the two groups (see Section 4). Thus, this threat should not have biased experiment results. Testing. Bias can occur if participants are given the same test more than once and they become familiar with the types of responses required [9]. Although our participants derived test cases for the two representations over two weeks, we have not included the results of the second week in our analysis as it would not measure their understanding of the representation learnt. Rather, it would test how well they adjusted to learning a second representation. We may analyse this statistic in future, as it may be useful as a preliminary assessment of whether industry testers would adjust to using Atomic Rules after having used different approaches as part of their jobs. 3
A gift of chocolate, which was allowed by the university’s ethics committee, was given to all students as our way of thanking them.
Proceedings of the 2007 Australian Software Engineering Conference (ASWEC'07) 0-7695-2778-7/07 $20.00 © 2007
Reliability. This relates to the consistency of results being obtained from the same person with the same or equivalent tests on different occasions, allowing an error of measurement to be calculated [1]. The simplest approach is to repeat the experiment on two separate occasions, where the error of measurement is a reliability coefficient which is the correlation between the two scores for each individual [1]. Since our experiments took place during university semesters, there was not enough time to repeat the same test twice. However, within each group, the same test was repeated across two subgroups. This allowed us to test experiment reliability. Population and sample. Validity can be affected if the sample is not representative of the entire population [10]. Convenience sampling was the method of recruitment in our experiments, where participants were selected as they were easily accessible [10]. We recognize that our samples are not representative of all novice testers, specifications or black-box methods; e.g. approaches such as Syntax Testing were not covered. Thus, our results are considered to be indicative, not conclusive. Threats to internal validity which were not applicable to our experiments included diffusion of treatments, compensatory equalization, compensatory rivalry and resentful demoralization, as these only applicable when using control groups [9]. We could not use control groups in our experiments, as students in those groups would have been disadvantaged in their assignment and exam as a result of not learning the two representations. Also, in experiments involving students, participants sometimes work on tasks at home; thus copying is a threat [23]. However, in our case, all tasks for the main body of the experiment were completed in class and every second student was given a different specification during tutorials so they could not copy from each other. In addition, a bias can exist if participants do not follow the processes and procedures of the techniques prescribed [23]. We asked students to show all workings while deriving test cases as we were interested in discovering when they did not follow the method procedures, as this may identify method ambiguity. External Threats to Validity Language. Participants may be disadvantaged if experiment materials are not written in their native language [23]. Some international students were involved in our experiments and all materials were written in English. However, since the students were enrolled at an English-speaking university, it was expected that they would be able to understand the language used, and if not, that they would ask a question. Interaction of setting and treatment. This relates to the ability to generalise experiment findings across other environmental settings [9], which in our case is determining whether our results are applicable to industry professionals. This threat is not applicable in our experiment as industry testers can be considered to be expert software testers, while our experiment was aimed at novices.
Interaction of history and treatment. This threat relates to the ability to generalise research outcomes to the past and future; e.g. if a classroom experiment runs during the main semester, the outcomes may be different than if it were conducted over the summer break, due to different types of students being enrolled at that time [9]. One way of resolving this threat is to replicate the experiment at a different time of year. Our experiments were run during the same semester over two years and we do not anticipate having the resources to repeat the experiments over summer as very few third and fourth year subjects run during that time at La Trobe University and there have never been any official student requests to do so in this software testing subject.
Table 5: Participants initial understanding of black-box testing methods in 2004 (n = 26).
4. Results
Table 3: Prior software testing experience. 2004 (n = 26) 19.2% 73.1% 61.5% 0% 11.5%
2005 (n = 37) 13.5% 48.6% 62.2% 0% 16.2%
We also found that 84.6% of the 2004 group had prior experience with black-box testing methods, compared to only 54.1% in 2005 (Table 4). These statistics suggests that there may have been a decrease in the amount of software testing training that was given to students in the 2005 group in the earlier years of their degrees. Table 4: Prior experience with black-box testing methods. Ever used any black-box testing methods? Yes No
2004 (n = 26) 84.6% 15.4%
2005 (n = 37) 54.1% 45.9%
Participants rated their level of experience with the following black-box methods: Boundary Value Analysis (BVA), Cause-Effect Graphing (CEG), Decision Tables
Proceedings of the 2007 Australian Software Engineering Conference (ASWEC'07) 0-7695-2778-7/07 $20.00 © 2007
SBMT
STT
ST
WCT
Percentages (%) 73 100 46 96 8 0 15 0 12 0 31 4 4 0 4 0 4 0 4 0
73 8 12 8 0
54 8 23 15 0
65 15 12 8 0
RT
EP
65 4 8 23 0
OAT
DT
54 8 27 8 4
EG
CEG
96 0 4 0 0
Table 6: Participants initial understanding of black-box testing methods in 2005 (n = 37).
STT
ST
WCT
84 5 11 0 0
SBMT
76 5 16 3 0
Percentages (%) 81 97 73 97 8 0 19 0 11 3 8 3 0 0 0 0 0 0 0 0
87 8 5 0 0
78 14 8 0 0
90 5 5 0 0
RT
95 0 5 0 0
OAT
65 16 16 3 0
EG
EP
Rating None Basic Intermediate Advanced Expert
DT
Black-Box Testing Methods CEG
In the initial questionnaire, students were asked about their prior software testing and industry experience. Twenty-six out of thirty-two students completed this questionnaire in 2004 (81.25%), while thirty-seven out of forty completed it in 2005 (92.5%). Many students reported having prior experience with software testing during university lectures and/or university assignments (Table 3). However, while 19.2% in 2004 and 13.5% in 2005 reported having no prior experience with software testing methods, 73.1% in 2004 and only 48.6% in 2005 stated that they received such experience through university lectures.
19 15 31 23 12
BVA
Demographic
Rating None Basic Intermediate Advanced Expert
BVA
Black-Box Testing Methods
In this section we present data on the demographic of students involved in the experiments, followed by results for each of the five hypotheses. These results are then discussed in Section 5. Note that one-tailed tests were used in all significance tests.
Software Testing Experience None University Lectures University Assignments As a Tutor Other
(DT), Equivalence Partitioning (EP), Orthogonal Array Testing (OAT), Random Testing (RT), SpecificationBased Mutation Testing (SBMT), State-Transition Diagram Testing (STT), Syntax Testing (ST) and Worst Case Testing (WCT). Although statistics were only required for EP and BVA, we enquired about nine other methods to obtain an overall picture of the class’s current black-box testing experience. Students rated their understanding using a Likert scale of: 1 = none, 2 = basic, 3 = intermediate, 4 = advanced and 5 = expert (Tables 5 and 6). With the exception of BVA and RT in 2004, the majority of students reported having limited amounts of experience with black-box testing methods.
Interestingly, very few students reported having any prior experience working in industry (Table 8). Table 7: Prior industry experience. 2004 (n = 26) 3.8% 3.8% 0% 3.8% 3.8% 3.8% 0% 0%
Position in Industry Project Manager Technical Team Leader Business Analyst Programmer Analyst Test Team Leader Test Team Member Other
2005 (n = 37) 0% 0% 0% 2.7% 2.7% 0% 2.7% 5.4%
A comparison of the mean overall grade of each group in the subject showed that there was no significant difference between the groups in 2004 or 2005 (Table 7). Table 8: Comparison of overall grades for each group. Year 2004
N 18 14 20
2005
20
Approach Myers Atomic Rules Myers Atomic Rules
Mean 66.17
Std Dev 20.88
73.29
14.56
68.1
19.49
65.8
14.1
t-test t(38) = .428, p = .336 t(30) = -1.08, p = .143
Completeness (H01/H11)
Table 13: Representation used in the assignment (n = 38).
To assess completeness we compared the percentage of EP equivalence classes, BVA boundary values and EP and BVA test cases derived correctly by each group. In 2004, a t-test showed a significant difference between the groups for EP equivalence class and test case derivation, where the mean was higher for the Atomic Rules group (Tables 9, 10). According to Cohen’s Effect Size [16], these relationships were strong. The 2004 BVA results were inconclusive (Tables 11, 12). Conversely, the mean EP class (Tables 9, 10) and BVA boundary value (Table 11) coverage was higher for Myers’ group in 2005 and Cohen’s Effect Size showed moderate to strong relationships. The results for BVA test cases in 2005 were inconclusive (Table 12). Interestingly, the mean EP and BVA coverage achieved by Myers’ group in 2004 and 2005 was relatively the same in both years (Tables 9 to 12). Table 9: Percentage of coverage of EP equivalence classes. Year 2004
N 18 14 20
2005
20
Approach Myers Atomic Rules Myers Atomic Rules
Mean 49.76
Std Dev 16.95
78.86
26.10
48.61
16.13
26.54
12.65
t-test t(30) = -3.82, p = .0003 t(38) = 4.815, p < .001
Cohen’s Effect Size 1.35 strong 1.53 strong
Year 2005
Table 14: Average mark achieved in the assignment (n = 38). Year 2005
2004
N 18 14 20
2005
20
Approach Myers Atomic Rules Myers Atomic Rules
Mean 36.23
Std Dev 23.29
78.86
26.10
38.94
20.92
23.65
15.11
t-test t(30) = 4.87, p = .0002 t(38) = 2.649, p = .006
1.73 strong 0.85 moderate
Table 11: Percentage of coverage of BVA boundary values. Year 2004
N 18 14 20
2005
20
Approach Myers Atomic Rules Myers Atomic Rules
Mean 18.88
Std Dev 19.98
23.81
26.82
26.00
19.51
11.52
12.80
t-test t(30) = .58, p = .28 t(38) = 2.776, p = .004
Cohen’s Effect Size NA .90 moderate
2004
N 18 14 20
2005
20
Approach Myers Atomic Rules Myers Atomic Rules
Mean Mark 67.91 85.52
t-test t(36) = -1.93, p = .03
We calculated the speed at which students completed test case derivation by counting the number of students who ran out of time before finishing test case derivation during tutorials. We found significantly more students in the Atomic Rules group ran out of time before completing their work in both 2004 and 2005 (Table 15). Table 15: Number of participants who ran out of time. Year 2004
Approach Myers Atomic Rules Myers Atomic Rules
N 18
Out of Time (Count) 5
Out of Time (Percent) 27.77%
14
10
71.43%
20
7
35%
20
19
95%
Test of Two Proportions δ = -.4366, z = -2.45, p = .007 δ = -.6, z = -3.98, p < .001
Correctness (H03/H13) To assess correctness, we counted the number of errors that students made during tutorials. We found that significantly fewer errors were made by students in the Atomic Rules group during EP equivalence class derivation in 2004 (Table 16). A similar result was seen in BVA boundary value definition in 2004, although the result was just outside the 95% confidence interval (Table 18). However, no significant difference was found between the groups during BVA or EP test case derivation in 2004 (Tables 17, 19) or during EP and BVA derivation in 2005 (Tables 16 to 19). Table 16: Errors made in EP equivalence class derivation.
Table 12: Percentage of coverage of BVA test cases. Year
Approach Myers Atomic Rules
Efficiency (H02/H12)
Table 10: Percentage of coverage of EP test cases. Year
Chi-Square 2 χ (1, N = 38) = 6.737, p = .009
In addition, the average assignment mark in 2005 for students who used the Atomic Rules representation in their assignment was significantly higher (Table 14).
2005 Cohen’s Effect Size
Used in Assignment 27.5% 67.5%
Approach Myers Atomic Rules
Mean 14.88
Std Dev 18.83
18.81
26.22
10.22
16.92
9.56
12.63
t-test t(40) = -.39, p = .35 t(38) = .141, p = .445
Cohen’s Effect Size NA
Year 2004
N 18 14 20
2005
20
Approach Myers Atomic Rules Myers Atomic Rules
Mean Rank 20.81
Sum of Ranks 374.50
10.96
153.50
21.65
433
19.35
387
Mann-Whitney U U = 48.5, p = .001 U = 177, p = .274
NA
In addition to data collected during tutorials, students in 2005 were asked to derive black-box test cases in their class assignment using one of the representations (Table 13). We found that significantly more students chose to use the Atomic Rules approach in that year.
Proceedings of the 2007 Australian Software Engineering Conference (ASWEC'07) 0-7695-2778-7/07 $20.00 © 2007
Table 17: Errors made in EP test case derivation. Year 2004
N 18 14 20
2005
20
Approach Myers Atomic Rules Myers Atomic Rules
Mean Rank 15.56
Sum of Ranks 280
17.71
248
21.55
431
19.45
389
Mann-Whitney U U = 109, p = .245 U = 179, p = .292
Table 18: Errors made in BVA boundary value derivation. Year 2004
N 18 14 20
2005
20
Approach Myers Atomic Rules Myers Atomic Rules
Mean Rank 18.5
Sum of Ranks 333
13.93
195
22.15
443
18.85
377
Mann-Whitney U U = 90, p = .0675 U = 167, p = .192
Table 19: Errors made in BVA test case derivation. Year 2004
N 18 14 20
2005
20
Approach Myers Atomic Rules Myers Atomic Rules
Mean Rank 17
Sum of Ranks 306
15.86
222
20.70
414
20.30
406
Mann-Whitney U U = 117, p = .349 U = 196, p = .463
Questions Asked (H04/H14) Participants were asked to document the questions they asked during tutorials. However, we found that only three students in 2004 and no students in 2005 recorded questions. Possible reasons could be that students: 1. were reluctant to ask questions, 2. did not have enough time to record questions, or 3. had a sound understanding of the methods taught. Although we hope the third option was the case, we do not have enough data to clarify this. In future experiments we could ask students on a questionnaire whether they recorded any questions, and if not, why. User Satisfaction (H05/H15) To assess user satisfaction, students completed a Reflect and Review Questionnaire. Thirty-two students completed this questionnaire in 2004 (100% of the class) and twenty-eight in 2005 (70% of the class). In 2004, students were asked which model they would prefer to use in future and this was compared to the model they learn first (Table 20) [17]. A chi-square test indicated that significantly more students would prefer to use the Atomic Rules approach in future.
Students also rated their understanding of the two representations using a Likert scale of: 1 = very poor, 2 = poor, 3 = average, 4 = good, 5 = very good, 6 = excellent. In both years, students reported that their understanding of EP and BVA had improved by the end of the experiment (Tables 22 and 23, columns 2-5). In 2004, 57% of students rated their understanding of Myers’ representation as below-average, whereas 100% rated their understanding of Atomic Rules as good or above (Table 22, cols 2-5). A significant difference was found in their self-rated understanding of the Atomic Rules approach as compared to Myers’ approach, where the mean was higher for Atomic Rules; t(30) = -7.65, p < .01. Thus, students reported that they were able to gain a better understanding of Atomic Rules [17]. Table 22: Self-rated understanding in 2004 (n = 32) [17].
Rating Very Poor Poor Average Good Very Good Excellent Frequency Mean Std Dev Missing
In addition, 82% of students in 2005 rated their understanding of Atomic Rules as Good to Excellent, compared to only 54% for Myers’s representation (Table 23, cols 2-5). Furthermore, a significant difference was found in the student’s self-rated understanding of the two representations, where the mean was again higher for Atomic Rules; t(26) = -3.22, p = .03. Thus, the students in 2005 also reported that they were able to gain a better understanding of the Atomic Rules representation. Table 23: Self-rated understanding in 2005 (n = 28).
Table 20: Approach students leant first versus approach they indicated they would use in future (n = 32). Year 2004
Approach Myers Atomic Rules
Leant First 61%
Use in Future 9%
39%
91%
Chi-Square 2
χ (1, N = 32) = 21.16, p < .001
In 2005 we posed a slightly different question. Students were asked to rate the likelihood that they would use the models in future (Table 21) using a Likert scale of: 1 = very unlikely, 2 = somewhat unlikely, 3 = neither likely nor unlikely, 4 = somewhat likely, 5 = very likely. However, the mean response was relatively even for both groups and no significant difference was found. Table 21: Likelihood of using approaches in future (n = 28).
Year 2005
Model use in future (mean) Atomic Rules Myers
Approach
Model Learn t First
Myers
46.43%
3.46
3.47
Atomic Rules
53.57%
3.23
3.73
t-test t(26) = -.01, p = .307 t(26) = -1.12, p = .445
Proceedings of the 2007 Australian Software Engineering Conference (ASWEC'07) 0-7695-2778-7/07 $20.00 © 2007
Understanding of Black-Box Understanding of Testing Methods Approaches Initial Final Atomic Myers Rules EP BVA EP BVA Percentages (%) 3 9 0 0 6 0 15 18 0 0 15 0 36 45 0 3 36 0 15 18 12 21 15 12 24 9 58 55 18 70 6 0 30 21 3 18 Values 3.61 3.00 5.18 4.94 3.35 5.03 1.27 1.06 0.64 0.75 1.25 0.56 0 0 0 0 1 0
Rating Very Poor Poor Average Good Very Good Excellent Frequency Mean Std Dev Missing
Understanding of Black-Box Understanding of Testing Methods Approaches Initial Final Atomic Rules Myers EP BVA EP BVA Percentages (%) 32 21 4 4 4 4 21 18 0 0 21 0 29 29 7 11 21 11 7 21 36 25 29 46 11 7 50 46 25 29 0 4 4 14 0 7 Values 2.43 2.86 4.39 4.54 3.50 4.22 1.32 1.38 .96 1.11 1.20 1.01 0 0 0 0 0 1
4.1 Related Research In this section we discuss a number of case studies that assess testing methods taught at university. We also explore a number of other empirical studies that compare the effectiveness of black-box methods to other testing methods and reflect on the approaches they use to assess test method effectiveness, as well as the number of
participants used in those studies. We then examine the continuing debate in the literature as to whether students should be used in software engineering experimentation. Roper et al. suggest that one way to progress towards firmer concepts of test method effectiveness is to develop tighter definitions of the methods themselves so that the experimental derivation of test data becomes predictable and repeatable [21]. This was of our main objectives in developing the Atomic Rules approach and one of our primary motivations in assessing the learnability and usability of traditional black-box methods. In our experiments we examined learnability in terms of the ease at which novice testers gained knowledge of particular concepts and usability in terms of the satisfaction the novice testers felt when using the representations. This included assessment of the level of completeness and correctness of derived test cases. Chen and Poon used similar measures when reviewing fortyeight student projects for the types of classifications that students missed as well as they numbers and types of mistakes they made when using the black-box Classification Tree Method (CTM) [7]. In another case study on CTM that was run 104 students and rerun with fifty-eight students, participants were asked to test programs that they had developed themselves using whatever test methods they felt were appropriate [25]. Their programs were graded by an automated test suite in terms the number of test cases that resulted in correct program output4. Then, the students were taught CTM and were asked to retest their programs using that method, to critically evaluate CTM, compare it to the test methods they previously used and to rate their future preference of test methods. With the exception of the critical evaluation, these measures are similar to those that were used in our experiment and to those we plan to use in our industry case study. Other studies use metrics such as fault-detection effectiveness to assess test method effectiveness. Basili and Selby conducted an experiment involving a total of forty-two students (twenty-nine juniors, thirteen intermediates) and thirty-two industry professionals, in which they compared the fault detection effectiveness, fault detection rate and classes of faults detected by three testing techniques: black-box testing (EP and BVA), white-box testing (100% statement coverage) and code reading (by stepwise abstraction) [3]. They found that the industry professionals were able to detect the most faults with code reading and did so at a faster rate. They were also able to detect more faults with black-box methods than white-box methods; however, these did not differ in fault detection rate. In one university group the same numbers of faults were detected with code reading and black-box methods and both detected more faults than white-box methods. The rate at which students detected faults did not differ for any technique. Kamsties and Lott repeated this experiment with fifty students and found that while the defect detection 4
Hoffman et al. also used automated testing tools to grade student’s work [11].
Proceedings of the 2007 Australian Software Engineering Conference (ASWEC'07) 0-7695-2778-7/07 $20.00 © 2007
effectiveness of the two dynamic approaches (white-box and black-box) were comparable to that of the static approach (code reading), participants detected more faults using black-box methods [15]. This experiment was also repeated by Wood et al. with forty-seven student participants [24]. They found that participants detected similar numbers of faults for all three techniques; however, their effectiveness depended on the nature of the program under test and the program faults. In a different experiment that compared the probability that test cases derived by EP, BVA and RT would be capable of detecting specific program faults, only one person was involved in test case derivation [20]. Reed noted that participants using black-box methods during experiments often select test cases that are not representative of other testers, therefore experiments could not be generalised unless large enough groups of testers and test cases were used. Thus, Reed sought to derive every test case that satisfied the black-box methods under study. In our industry case study we plan to use some of the more commonly used metrics for assessing test method effectiveness, such as comparing the number of defects detected by experienced software testers when using the Atomic Rules approach to the number that are detected when testers use their own systematic and exploratory black-box methods. We also plan to compare the results of our university experiments to that of the industry case study, to determine whether experienced software testers are able to derive complete test sets using Atomic Rules. Our university experiments involved a total of seventy-two students and we hope to obtain participation from at least thirty industry professionals. These figures are comparable with subject numbers from other studies, both inside and outside the domain of software testing. For example, in one study outside the domain of testing, an experiment was run with thirty-six students was rerun by a different researcher with fifty-nine students and ninety-nine industry professionals who were paid standard consultancy rates [2]. Remuneration could account for this relatively high number of industry participants. For example, in another experiment outside testing, only twelve industry professionals participated [12] and they did not appear to be remunerated. Thus, remuneration may be an effective approach of obtaining more industry participation in our future case study. Carver et al. state that running pilot experiments with students is effective preparation for industry-based experiments [6]. In addition, Tichy stated that student experiments could be used to predict future trends in experiments that are rerun with industry professionals [22]. Tichy also stated that graduate computer science students are only marginally different from industry professionals [22]. In addition, Carver et al. discuss a study in which a significant difference was found between graduate and undergraduate students, but only small differences were found between graduates and industry professionals [6]. Thus, one negative aspect that has been reported on the use of students as experimental subjects is that experiment results may not be able to be
generalised to industry professionals [6]. However, our university experiments have been excellent preparation for our industry case study, as they have facilitated an initial assessment of the learnability and usability of Atomic Rules and have identified threats to validity that need to be considered and controlled. Also, we consider our results to be suggestive of what the general population of professional testers might experience when learning and using the Atomic Rules approach, and this will be properly verified through the industry case study.
5. Discussion Students in the Atomic Rules group in 2004 were able to produce significantly more complete and correct EP equivalence classes and test cases, although the BVA results were inconclusive. On the other hand, students in Myers’ group in 2005 produced more complete EP equivalence classes and test cases and BVA boundary values. However, we believe this was due to the 2005 students being given a longer and more complicated specification during tutorials. As test cases generally take longer to hand-write using the Atomic Rules approach, significantly more students in the Atomic Rules group in both 2004 and 2005 did not have enough time to complete the tutorial tests. Despite this, in 2004 the Atomic Rules group still achieved much higher mean coverage levels than those using Myers’ approach. The setting of a potentially overly-complicated test in the 2005 tutorials could have been caused by the second system effect, which is where system engineers, having developed small, elegant solutions the first time around, have a tendency to design overly complicated solutions the second time [5]. It is only by the design of a third system that the engineer will develop an effective solution that is not under or over designed [5]. As students did well with the Atomic Rules approach in the 2004 tutorials, we felt it was reasonable to increase the length and complexity of the specifications used in 2005. A third experiment using a complex and a non-complex specification in the one experiment could clarify whether specification complexity caused students in the Atomic Rules group to produce less complete test sets than Myers’ group in 2005. Nonetheless, students in the Atomic Rules group produced more correct answers than Myers’ group in both years, in that they made fewer mistakes during test case derivation. In addition, significantly more students in 2004 reported that they would prefer to use the Atomic Rules approach in future. Also, more students in 2005 used Atomic Rules in their assignment and achieved higher assignment marks than those that used Myers’ representation. Furthermore, in both years a significant difference was found in student’s self-rated understanding of the two approaches, where the mean was higher for the Atomic Rules representation. Thus, students in both years felt that they had gained a better understanding of the Atomic Rules representation by the end of the experiment.
Proceedings of the 2007 Australian Software Engineering Conference (ASWEC'07) 0-7695-2778-7/07 $20.00 © 2007
These results suggest that Atomic Rules could be a more effective representation to teach to novice software testers at university. However, the collection of more data would allow us to draw more solid conclusions. It is hoped that the industry-based case study we are currently planning will provide us with such data. One observation that was made during the experiment was that the structure of the Atomic Rules approach can stifle tester creativity, even for novice testers. As Atomic Rules is much more systematic than Myers’ original definitions, it did not allow the students to derive test cases based on their own knowledge and experience. During data analysis, it became apparent that some testers in Myers’ group created test cases that were not derivable from Myers’ representation. As noted by Kaner et al., prior testing experience can be used to identify effective test cases through error guessing in similar testing scenarios, even if a tester cannot remember where they gained the domain knowledge [15]. We developed an approach called Systematic Method Tailoring which allows testers to systematically define new test case selection rules and new black-box testing methods based on their own knowledge and experience, allowing these to be retained for future reuse. In our industry case study, we will determine whether the ad hoc test case selection rules that are used by industry testers can be captured as Atomic Rules. We do not believe that student preference for lecturer had an affect on the experiment results, as it would be fair to assume that the results of the two groups would have swapped in 2005 if this was the case.
6. Conclusions and Future Work In this paper we presented the results of two similar classroom experiments that compared the learnability and usability of two representations of Equivalence Partitioning and Boundary Value Analysis: Myers’ original definitions and the corresponding Atomic Rules representation. The aim was to compare the learnability and usability of these two representations. The experiments were run with two groups of novice testers over two years at La Trobe University. While our results cannot be generalised across the entire population of novice testers, program specifications or black-box testing methods, they do suggest that the Atomic Rules representation makes black-box testing methods easier to learn and use in some situations and that students feel that they are able to gain a better understanding of Atomic Rules than Myers’ representation. They also suggest that this topic warrants further investigation. We feel that these experiments have been excellent preparation for an industry-based case study that we are currently planning for 2007, in which we will compare the fault detection effectiveness of the Atomic Rules approach to the effectiveness of the systematic and exploratory black-box testing methods that are used by experienced software testers in industry. In addition, in our university experiments we found that the Atomic Rules approach can stifle tester creativity. However, in
previous research we proposed Systematic Method Tailoring as an approach for defining new Atomic Rules and new black-box testing methods [16]. Thus, in the industry-based case study we will also determine whether professional testers use any test case selection rules that are not covered by traditional black-box methods, and if so, we will determine whether they can be described via Systematic Method Tailoring as Atomic Rules. This verification process will also allow us to further assess whether Atomic Rules and Systematic Method Tailoring are effective representations to teach to novice and professional testers in both academia and industry. We will also seek to compare the findings of our university experiments to our industry-based case study, to analyse the differences in the test sets that are derived by experienced and inexperienced testers, such as differences in the completeness and quality of the test sets and the speed at which they are derived. During our industry case study we will also evaluate the effectiveness of an automated testing tool that we are developing, which implements Atomic Rules and Systematic Method Tailoring. This tool automatically generates a set of black-box test cases for specifications input either through a graphical user interface or via an upload facility for specifications expressed in BackusNaur Form. This tool could increase the efficiency of the Atomic Rules approach and make black-box test case selection more efficient and precise.
Acknowledgements We sincerely thank the students of the Department of Computer Science and Computer Engineering at La Trobe University who participated in our experiment. We also thank the postgraduate students and staff of the Department who gave constructive feedback during a seminar on the preliminary findings of our experiment. We would also like to thank the reviewers of this paper for their constructive feedback. Lastly, we thank Sue Cook of the Human Ethics Committee of the Faculty of Science, Technology and Engineering, La Trobe University, for her valuable feedback on our experiment design.
References [1] Anastasi, A., and Urbina, S. Psychological Testing. Prentice Hall, New Jersey, USA, 1997. [2] Arisholm, E., and SjØberg, D. Evaluating the Effect of a Deligated versus Centralized Control Style on the Maintainability of Object-Oriented Software. IEEE Transactions on Software Engineering, 30(8):521-534, 2004. [3] Basili, V., and Selby, R. Comparing the Effectiveness of Software Testing Strategies. IEEE Transactions on Software Engineering, SE-13(12): 1278–1296, 1987. [4] Berry, D.M. and Tichy, W.F. Comments on Formal methods application: an empirical tale of software development. IEEE Transactions on Software Engineering, 29(6):567-571, June 2003. [5] Brooks, F. The Mythical Man-Month: Essays on Software Engineering. Addison-Wesley Publishing, 1975.
Proceedings of the 2007 Australian Software Engineering Conference (ASWEC'07) 0-7695-2778-7/07 $20.00 © 2007
[6] Carver, J., Jaccheri, L., and Morasca, S. Issues in Using Students in Empirical Studies in Software Engineering Education. Proceedings of the 9th International Software Metrics Symposium, Sydney, Australia, 2003. [7] Chen, T. Y., and Poon, P. L. Experience with Teaching Black-Box Testing in a Computer Science/Software Engineering Curriculum. IEEE Transactions on Education, 47(1):42-50, February 2004. [8] Christensen, L. Experimental Methodology. Pearson/Allyn and Bacon, Boston, Massachusetts, USA, 2004. [9] Creswell, J. Educational Research. Planning, Conducting and Evaluating Quantitative and Qualitative Research. Pearson Education, New Jersey, USA, 2002. [10] Gorard, S. Quantitative Methods in Educational Research: the Role of Numbers Made Easy. Continuum, UK, 2001. [11] Hoffman, D., Strooper, P., and Walsh, P. Teaching and Testing. Proceedings of the 9th Conference on Software Engineering Education, IEEE, pp. 248-258, April 1996. [12] Hungerford, B., Henver, A., and Collins, R. Reviewing Software Diagrams: A Cognitive Study. IEEE Transactions on Software Engineering, 30(2):82-30, February 2004. [13] Johnson, B., and Christensen L. Educational Research. Quantitative, Qualitative and Mixed Approaches. Pearson Education, USA, 2004. [14] Kamsties, E., and Lott, C. An Empirical Evaluation of Three Defect-Detection Techniques. Proceedings of the 5th European Software Engineering Conference, September 1995. [15] Kaner, C., Falk, J., and Nguyen, H. Testing Computer Software. John Wiley & Sons, 2nd edition, 1999. [16] Mujis, D. Doing Quantitative Research in Education with SPSS. SAGE publications Ltd., London, UK, 2004. [17] Murnane, T., Hall, R., and Reed, K. Towards Describing Black-Box Testing Methods as Atomic Rules. Proceedings of the 29th Annual International Computer Software and Applications Conference, Scotland, pp. 437-442, July 2005. [18] Murnane, T., Hall, R., and Reed, K. Tailoring of BlackBox Testing Methods. Proceedings of the 2006 Australian Software Engineering Conference, Sydney, Australia, IEEE, pp. 292-299, April 2006. [19] Myers, G. The Art of Software Testing. John Wiley & Sons Inc, USA, 1979. [20] Reid, S. An Empirical Analysis of Equivalence Partitioning, Boundary Value Analysis and Random Testing. Proceedings of the 4th International Software Metrics Symposium, IEEE, 1997. [21] Roper, M., Miller, J., Brooks, A., and Wood, M. Towards the Experimental Evaluation of Software Testing Techniques. Technical Report, Department of Computer Science, University of Strathclyde, Glasgow, 1993. [22] Tichy, W. Hints for Reviewing Empirical Work in Software Engineering. Empirical Software Engineering, 5:309312, 2000. [23] Vegas, S., Juristo, N., and Basili, V. Implementing Relevant Information for Testing Technique Selection. An Instantiated Characterization Schema. Kluwer Academic Publishers, USA, 2003. [24] Wood, M., Roper, M., Brooks, A., and Miller, J. Comparing and Combining Software Defect Detection Techniques: A Replicated Empirical Study. Proceedings of the 6th European Software Engineering Conference / 5th AGM SIGSOFT Symposium on the Foundations of Software Engineering, Switzerland, pp. 262-277, September 1997. [25] Yuen, T. Y., Ng, S. P., Poon, P. L., and Chen, T. Y. On the Testing Methods Used by Beginning Software Testers. Information and Software Technology, Elsevier, 46:329-335, 2004.