J. Hlaváˇcová (Ed.): ITAT 2017 Proceedings, pp. 210–217 c 2017 L. Grad-Gyenge CEUR Workshop Proceedings Vol. 1885, ISSN 1613-0073,
On the Optimal Setting of Spreading Activation Parameters to Calculate Recommendations on the Knowledge Graph László Grad-Gyenge Eötvös Loránd University, Budapest, Hungary
[email protected], WWW home page: http://laszlo.grad-gyenge.com
Abstract: This paper presents the analysis on the optimal settings of the spreading parameters of the spreading activation technique. The method is applied on the knowledge graph, an information representation technique that combines collaborative and content-based information. The evaluation of the recommendation technique is based on recommendation lists. The involved measures are precision, recall and normalized discounted cumulative gain. The numerical experiments are conducted on the MovieLens 1M dataset. The evaluation results show that spreading activation delivers a stable performance regarding to the evaluation measures over different parameter settings. The quality of the recommendations degrade in the case, the method parameters are set to extreme values.
1 Introduction As discussed in detail by Grad-Gyenge et al. [1], in contrast to the paradigm of user preference, the paradigm of relatedness provides a more general and effective approach to the design and development of the recommendation algorithms. The essence of the paradigm is to focus on the relations between the entities of the recommendation scenario instead of involving models emphasizing the user item interactions. The primary outcome of the application of the paradigm is the potential to involve transitivity into the recommendation techniques. Transitivity is one possibility to define the relation between the users and the recommended items in a more general way. The application of spreading activation in the field of recommender systems is an illustrative example of the utilization of the paradigm. The method is applied on the knowledge graph [2], which is a general information representation technique. The entities of the recommendation scenario and also the relatations between them are generalized. The users, items and their attribute values are representated with nodes. User preferences on items and content based information are represented with edges. The transitive relation in this case means the possibilty to involve paths of heterogeneous types between two nodes. The advantage of the paradigm is that it does not restrict the type of the individual edges on the path between two nodes, thus the relations between the entities can be treated as generalized and transitive. The past research on the evaluation of spreading activation to generate recommendations showed its potential.
Although the optimal parameter settings of the method should have been further investigated. In order to fill this gap, this paper presents the results of our numerical experiments conducted to identify the optimal values for the relax parameters of the technique. Our results show that the method delivers a stable performance regarding the different parameter settings. The quality of the recommendations calculated by the method become low if the relax parameters are set to extreme values. The rest of the paper is organized as follows. Section 2 discusses the work related to graph based information representation and the application of spreading activation as a recommendation technique. Section 3 presents the representation technique and the dataset the method is evaluated on. Section 4 describes the recommendation technique. Section 5 discusses the evaluation technique and presents the evaluation results. Section 6 concludes the paper and gives insight into our plans for the future.
2 Related Work Next to matrix factorization methods [3][4][5], the graph based information representation technique has proven its effectiveness. Several research projects utilize the general information representation capability of heterogeneous graphs. As the state of the art results of the research on recommender systems illustrate, the application of graph based information representation techniques gaining attention nowadays. Graphs are powerful tools of knowledge representation. An example of the involvement of a hybridization technique at the information representation level, Lee at al. [6] introcude a heterogeneous graph based technique to combine collaborative and content based information. Further investigating the topic, Lee et al. [7] analyse the correlations of the entities found in the graph. As the work presented by Tiroshi et al. [8] illustrate, the graph based representation is straightforward technique in the case of modeling social relations. In addition to ontologies, the involvement of social networks into the recommendation process is an intensively researched field. Typically, there are two classes of the approaches modeling social networks, the asymmetric and the symmetric case. The asymmetric case can be described as the follow and the trust relationships. The symmetric
On the Optimal Setting of Spreading Activation Parameters to Calculate Recommendations on the Knowledge Graph
case can be described as the friendship relationship. Influencing results conducted on trust networks are published by Guha et al. [9], Massa et al. [10], Ziegler et al. [11], and Jøsang et al. [12]. Important works calculating recommendations with the help of the social network are published by Guy et al. [13], Konstas et al. [14], and He et al. [15]. The layered graph technique is a typical representation method found in the early works in this field. Kazienko et al. [16] also derive recommendations with the help of this technique. Cantador et al. [17] present a clustering technique based method on the layered graph based representation.
An important feature of the knowledge graph is its capability to represent heterogeneous information. Probably, this is the reason why the technique is intensively researched as the more the involved information sources are, the less the cold start cases occur. Hu et al. [18] generate leads with a label propagation technique. Catherine et al. [19] introduce a probabilistic logic method to calculate recommendations with the help of the knowledge graph. Yu et al. [20] investigate the observed and the potential paths of the knowledge graph. To have a numerical measure, they involve the PathSim measure for path comparison. Kouki et al. [21] describe a hybridization technique with the help of a probabilistic framework. Burke et al. [22] present a recommendation technique based on the k-Nearest Neighbours method applied to various matrices as the user-tag matrix, user-resource matrix, resource-tag matrix and the resource-user matrix.
The spreading activation technique was originally applied to ontologies and is recently involved in different domains to derive recommendations. The primary goal of Hussein et al. is to close the gap between contextawareness and self-adaptation [23]. To perform this task, SPREADR, a spreading activation based recommendation method is defined. Gao et al. [24] propose an ontology based approach to model both user interests and items in the same knowledge base. Jiang et al. [25] define a user model with the help of an ontology and calculate recommendations with the help of the spreading activation. Blanco-Fernandez et al. [26] argue that spreading activation is to be involved to avoid overspecialisation. They present a semantic model of the preferences of the users and apply spreading activation to proceed content based reasoning. Codina et al. [27] define an item score based on the weighted average of concepts related to each other in their model. In their work, they estimate user ratings with a semantic recommendation technique treating it a reasoning method. Troussov et al. [28] investigate decay configurations over a tag aware representation. Alvarez et al. [29] introduce ONTOSPREAD in the field of medical systems.
3
211
Dataset
3.1 Representation Technique To represent the data, a graph based technique described by Grad-Gyenge et al [2] is involved. The advantage of this method is its ability to represent various information sources by alloying both collaborative and content based information. The essence of the method is to represent the information in a labeled, heterogeneous graph. Each user and each item is represented with a dedicated node. The explicit or implicit interaction between the users and the items are modeled with relations annotated by the specific type of the interaction. In addition, the content-based information, namely the user and the item attributes are represented with the so-called attribute value nodes. In this case, a dedicated node is created for each attribute value. The node representing the user or item is bound to the specific attribute value node indicating then the particular attribute value. This representation technique leads to a knowledge graph containing heterogeneous information at the informaiton representation level. The information is represented in a labeled, undirected, weighted graph. The definition of the graph is extended with labels, thus types can be assigned to the nodes and edges of the graph. Although parallel edges are allowed, in practical applications it is recommended to add only one edge per type between two specific nodes in order to reduce the computational complexity. Equation 1 presents the definition of the knowledge graph. K = (Tn , Te , N, E,tn ,te , re ),
(1)
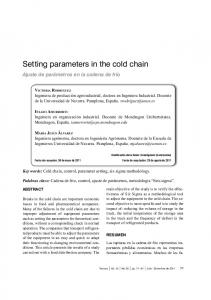
where Tn stands for the node types, Te stands for the edge types. N stands for the nodes of the graph. E ⊆ {{u, v}|u ∈ N ∧ v ∈ N ∧ u 6= v} stands for the set of edges, thus the graph is undirected. The function tn ⊂ N × Tn specifies the type of the nodes. The function te ⊂ E × Te specifies the type of the edges. The function re ⊂ Eu × R specific the rating value of the appropriate edges. The function re does not assign rating to all edges of the graph, thus re is partial. 3.2 MovieLens To analyse the performance of the various method configurations, the MovieLens 1M dataset is involved [30]. The advantage of the MovieLens 1M dataset over the other published MovieLens dataset is that in addition to user preferences on items it also contains user and item attributes. This allows us to utilize both the collaborative and content-based information to come to a lower cold start rate than the pure collaborative filtering technique has. To give an insight into the information representation technique, Figure 1 presents a detailed part of the knowledge graph in the case of the MovieLens 1M dataset. To illustrate the different information source types, the nodes
212
L. Grad-Gyenge
technique. For each attribute value, a node of the appropriate type is created and bound to the item with a corresponding edge. The node types introduced in this expriment are as follows. • Type YearOfRelease annotates the years of release. • Type Genre annotates the genres. In the case of the MovieLens 1M dataset, multiple genres can be assigned to a movie. It means the a node representing an item can be connected to multiple nodes representing a genre. Figure 1: A detailed view of the MovieLens dataset represented in the knowledge graph. and the relations are coloured to show the type of information they represent. Colour light blue annotates the items to recommend, i.e., Jaws, Forrest Gump and Chasing Amy. Colour light brown annotates the movie genres, i.e., Romance and Drama. Colour orange annotates the release year of a movie, i.e., 1997. Colour lilac annotates the users, i.e., Person 1, Person 2 and Person 3. Colour grey annotates the gender of a person, i.e., Male. Colour blue annotates the occupation of a person, i.e., Scientist. Colour green annotates the ZIP region of a person, i.e., ZIP region 2. Colour red annotates the age category, i.e., 25-34. In order to represent the users of the recommendation screnario, a node with the appropriate type (User) is created in the knowledge graph. The user attribute values are represented with the attribute node technique. For each attribute value, a node of the appropriate type is created and bound to the user with a corresponding edge. The node types introduced in this expriment are as follows. • Type Gender annotates the genders of the users. • Type AgeCategory annotates the age categories. • Type Occupation annotates the occupations. • Type ZipCodeRegion annotates the ZIP code regions. The ZIP code region is derived from the ZIP code by using only its first digit representing the U.S. region. The user attribute values are bound to the users with edges of the corresponding type. The edge types defined are PersonGender, PersonAgeCategory, PersonOccupation and PersonZipCodeRegion, respectively. Analogously to the user attribute values, the items are represented with a dedicated node of the appropriate type (Item) is created in the knowledge graph. The item attribute values are also represented with the attribute node
The item attribute values are bound to the items with edges of the corresponding type. The edge types defined are ItemGenre and ItemYearOfRelease, respectively. The advantage of the MovieLens 1M dataset is that it contains both collaborative and content-based information. The content-based information is described above. The collaborative information in this case is basically the 1 000 209 known user rating events contained in the dataset. Each rating event consists of a user, an item, a preference value and a time-stamp. The preference values are in the [1, 5] interval. In the current experiment, a linear normalization is conducted on this value to the [0.2, 1] interval. In order to represent the known rating in the dataset, the edge type ItemRating is introduced. Adding a known rating to the knowledge graph means the creation of the edge of the appropriate type (ItemRating) between the particular user and item. The concrete value of the rating is assigned to the particular edge by the re partial function. Table 1 presents the amount of information contained in the knowledge graph in two subtables. Table 1a and Table 1b contain the amount of nodes and edges per type, respectively. The knowledge graph contains 10 062 nodes in total. Not counting the edges of type ItemRating, the knowledge graph contains 34 451 edges in total.
4 Recommendation Technique According to Grad-Gyenge et al. [1], the application of spreading activation on the knowledge graph described in Section 3.1 to estimate user preferences on items leads to high quality recommendations. As described in several works in the past [29, 28, 24, 26, 25, 23, 27], spreading activation is an iterative technique to calculate a similarity between a source node and the other nodes of a particular graph. As already discussed by Grad-Gyenge et. al [1], the advantage of the method is that the similarity value incorporates both the distance between two nodes and the parallel paths in between. As already mentioned, spreading activation is an iterative method. In this experiment, similarly to Grad-Gyenge et al. [1], the iteration is conducted until a pre-specified iteration step (c) limit is reached. The method assigns
On the Optimal Setting of Spreading Activation Parameters to Calculate Recommendations on the Knowledge Graph
Table 1: Count of node and edge types in the MovieLens dataset.
5.1 Evaluation Technique
(a) Count of node types. Node type Person AgeCategory Gender Occupation ZipCodeRegion Item Genre YearOfRelease
The methods are evaluated with an iterative process as also described by Grad-Gyenge et al. [2]. Before starting the iteration, all the user preference information is removed from the knowledge graph, thus it contains no edges representing ratings. In the initial step, the knowledge graph is filled with content-based information, meaning that it contains the nodes representing the users, items and their attribute values. The relations between users and user attribute values, items and item attributes values are also present in the knowledge base. Having the knowledge base initialized, the evaluation process is basically an iteration over the known rating values. This iteration is conducted in an ascending order by the timestamp of the known rating. It also means that the knowledge graph is filled with collaborative information during the evaluation process. Each iteration step consist of the following operations.
Count 6 040 7 2 21 10 3 883 18 81
(b) Count of edge types. Edge type PersonAgeCategory PersonGender PersonOccupation PersonZipCodeRegion ItemGenre ItemYearOfRelease ItemRating
5 Evaluation
Count 6 040 6 040 6 040 6 040 6 408 3 883 1 000 209
1. Generate recommendations with the evaluated method. 2. Record the evaluation measures.
activation values to the nodes of the graph as defined in Equation 2. a(i) ⊂ N × R,
(2)
where a denotes the activation function. In the initial step of the iteration, the activation of the source node is set to 1 (a(0) (ns ) = 1). The source node (ns ) represents the user the recommendations are generated for. The activation of all the other nodes are set to 0 (a(0) (n) = 0, n ∈ N, n 6= ns ). In each iteration step, the activation of the nodes is maintained. A part of the activation of each node is propagated to its neighbour nodes and a part of the activation of each node is being kept at the node. The distribution of the propagated activation values is conducted based on the weight of the edges. In our case the graph is not weighted, in other words, the edges are weighted basically equally. In order to control the propagation process, two parameters are introduced. The parameter spreading relax (rs ) controls the amount of the distributed activation. The parameter activation relax (ra ) controls the amount of activation kept at each node. The function to maintain the activation of the nodes is defined in Equation (3). a(i+1) (n) = ra a(i) (n) + rs
a(i) (m) , m∈Mn |Mn |
∑
(3)
where n ∈ N, i ≥ 0. Mn stands for the neighbour nodes of n. Mn = {m|{m, n} ∈ E}. Having the iteration step count (c) reached, the preference value of each node regarding the source node is defined as the value of the activation function.
3. Add the known rating to the knowledge graph. The advantage of this evaluation method is that in the beginning the methods are analysed in a cold start environment. As the knowledge based is being filled with collaborative information, the analsys tends to be conducted in an information dense environment. According to our past experiments [1, 2], in order to represent the problem, the experiments are to be conducted on the first 10 000 known ratings. This is the amount of information, the performance indicators of the methods typically stabilize, thus the methods can be interpreted. The analysis of the spreading parameters is basically a greedy search method. All the combinations of the rs and the ra parameters are evaluated in the interval [0, 1]. The fidelity of the analysis is 0.1. The experiment covers all possible combinations of the parameter values and does not restrict to the rs + ra = 1 cases. To evaluate the methods, the precision, recall and the nDCG measure is recorded at each evaluation step for a concrete method configuration. The recorded measure values are then averaged and are presented. The measures are calculated on the first 10 items of the list of recommended items. The relevance of an item is defined as follows. If the known rating value of a specific item is 4 or 5 then the item is treated relevant. In other words, relevance is defined as the threshold 0.8 on the normalized rating value. 5.2 Evaluation Results Figure 2 contains the results of the evaulation in three subfigures. Subfigure 2a, 2b and 2c presents the precision,
213
214
L. Grad-Gyenge
recall and nDCG of the methods, respectively. On each figure, the horizontal axis represents the setting of the activation relax (ra ) parameter, the vertical axis represents the setting of the spreading relax (rs ) parameter. The color of each cell represents the average value of the respective evaluation measure as also indicated in the legend of the figure. Mean of Precision
Spreading Relax
1.00
0.75
0.650 0.625 0.600 0.575
0.50
0.25
0.00
0.25
0.50
0.75
Activation Relax
1.00
(a) Precision
Mean of Recall
Spreading Relax
1.00
0.75
0.072 0.068 0.064 0.060
0.50
0.25
0.00
0.25
0.50
0.75
Activation Relax
1.00
(b) Recall
Mean of nDCG
Spreading Relax
1.00
0.75
0.90 0.88 0.86
0.50
0.25
0.00
0.25
0.50
0.75
Activation Relax
1.00
(c) nDGC Figure 2. Evaluation measures at different spreading parameter settings.
In order to easier interpret the results visually, the figures do not present the evaluation measures resulted in the rs = 0 case. This is the case when no recommendation can
be generated as due to the setting of the parameter the activation can not spread from the source node to neighbouring nodes, thus the evaluation measures of these cases are 0. This presentation allows us to investigate the evaluation measures more refined. The figures show that the low values of ra lead to a decrease in the recommendation quality. Especially if the setting of rs is high. Taking a closer look, it can be read from the figures that the difference in the quality occurs from the second or the third digit depending on the concrete evaluation measure. It means that although the quality of the recommendations may decrease in some cases but the method shows a quite stable performance on this dataset. The reason behind this stabily can be found in its network science background. We assume that the fact that the method operates on the network is more important than its actual configuration. Table 2 presents the result of the evaluation in numbers in its subtables. Subtable 2a, 2b and 2c presents the precision, recall and nDCG values respectively. The columns of the table represent different activation relax (ra ) parameter settings. The rows of the table represent different spreading relax (rs ) parameter settings. The value of each table cell contain the actual value of the appropriate evaluation measure. The results give a deeper insight into the performance of the methods than the figure based presentation. The table shows that setting the rs to zero leads to unproducible recommendation lists. Regarding precision and recall, the highest recommendation quality can be achieved by setting rs to 0.1 and setting ra to higher than 0.5. It means that in the case of precision and recall, low spreading and high activation values lead to higher performance. Looking at nDCG, the configurations leading to the highets quality for (rs , ra ) are (0.4, 0.3) and (0.5, 0.4). In this case a less extreme and a more common setting of the parameters can be adequate. At the macro level, the numerical presentation of the values shows a consistent view to the figure based representation. The results show that the extreme setting of the method configuration parameters (rs =0) leads to a significant decrease in the recommendation quality. In addition, setting ra to a low value while setting rs to a high value is not recommended. To summarize the results, in the case there is no research capacity available to analyise the optimal setting of the spreading parameters, a good practice can be to set these parameters to a moderate value, e.g., to the mean of the value interval.
6
Conclusion
The paper discusses the analysis of the configuration of the spreading activation method. The technique is applied on the knowledge graph to generate recommendations. Parameters spreading and activation relax are investigated
On the Optimal Setting of Spreading Activation Parameters to Calculate Recommendations on the Knowledge Graph
215
Table 2. The evaluation measures of the method configuration over various spreading parameter settings.
(a) Precision.
S/A 1.0 0.9 0.8 0.7 0.6 0.5 0.4 0.3 0.2 0.1 0.0
0.0 0.5592 0.5592 0.5592 0.5592 0.5592 0.5592 0.5592 0.5592 0.5592 0.5592 0.0000
0.1 0.5922 0.5981 0.6042 0.6117 0.6210 0.6326 0.6426 0.6530 0.6616 0.6718 0.0000
0.2 0.6326 0.6370 0.6426 0.6476 0.6530 0.6568 0.6616 0.6664 0.6718 0.6732 0.0000
0.3 0.6495 0.6530 0.6558 0.6585 0.6616 0.6655 0.6685 0.6718 0.6726 0.6734 0.0000
0.4 0.6568 0.6594 0.6616 0.6647 0.6664 0.6697 0.6718 0.6725 0.6732 0.6735 0.0000
0.5 0.6616 0.6642 0.6661 0.6673 0.6706 0.6718 0.6723 0.6728 0.6734 0.6736 0.0000
0.6 0.6655 0.6664 0.6685 0.6710 0.6718 0.6722 0.6726 0.6732 0.6734 0.6737 0.0000
0.7 0.6669 0.6693 0.6714 0.6718 0.6721 0.6726 0.6729 0.6733 0.6735 0.6737 0.0000
0.8 0.6697 0.6715 0.6718 0.6720 0.6725 0.6727 0.6732 0.6733 0.6735 0.6737 0.0000
0.9 0.6716 0.6718 0.6719 0.6723 0.6726 0.6729 0.6734 0.6734 0.6736 0.6737 0.0000
1 0.6718 0.6719 0.6723 0.6726 0.6728 0.6732 0.6734 0.6735 0.6736 0.6737 0.0000
0.6 0.0726 0.0727 0.0728 0.0729 0.0730 0.0730 0.0731 0.0731 0.0731 0.0732 0.0000
0.7 0.0727 0.0728 0.0730 0.0730 0.0730 0.0731 0.0731 0.0731 0.0731 0.0732 0.0000
0.8 0.0729 0.0730 0.0730 0.0730 0.0731 0.0731 0.0731 0.0731 0.0731 0.0732 0.0000
0.9 0.0730 0.0730 0.0730 0.0731 0.0731 0.0731 0.0731 0.0731 0.0731 0.0732 0.0000
1 0.0730 0.0730 0.0730 0.0731 0.0731 0.0731 0.0731 0.0731 0.0731 0.0732 0.0000
0.6 0.9145 0.9162 0.9168 0.9167 0.9165 0.9164 0.9163 0.9161 0.9161 0.9160 0.0000
0.7 0.9166 0.9169 0.9167 0.9165 0.9164 0.9163 0.9162 0.9160 0.9160 0.9159 0.0000
0.8 0.9168 0.9166 0.9165 0.9164 0.9163 0.9162 0.9161 0.9161 0.9160 0.9159 0.0000
0.9 0.9166 0.9165 0.9165 0.9163 0.9163 0.9162 0.9161 0.9161 0.9160 0.9159 0.0000
1 0.9165 0.9165 0.9163 0.9163 0.9162 0.9161 0.9161 0.9160 0.9160 0.9159 0.0000
(b) Recall.
S/A 1.0 0.9 0.8 0.7 0.6 0.5 0.4 0.3 0.2 0.1 0.0
0.0 0.0574 0.0574 0.0574 0.0574 0.0574 0.0574 0.0574 0.0574 0.0574 0.0574 0.0000
0.1 0.0632 0.0641 0.0650 0.0663 0.0678 0.0693 0.0705 0.0716 0.0723 0.0730 0.0000
0.2 0.0693 0.0698 0.0705 0.0710 0.0716 0.0719 0.0723 0.0727 0.0730 0.0731 0.0000
0.3 0.0712 0.0716 0.0718 0.0721 0.0723 0.0726 0.0728 0.0730 0.0731 0.0731 0.0000
0.4 0.0719 0.0721 0.0723 0.0725 0.0727 0.0729 0.0730 0.0731 0.0731 0.0731 0.0000
0.5 0.0723 0.0725 0.0726 0.0727 0.0729 0.0730 0.0730 0.0731 0.0731 0.0731 0.0000
(c) nDCG.
S/A 1.0 0.9 0.8 0.7 0.6 0.5 0.4 0.3 0.2 0.1 0.0
0.0 0.8508 0.8508 0.8508 0.8508 0.8508 0.8508 0.8508 0.8508 0.8508 0.8508 0.0000
0.1 0.8694 0.8717 0.8743 0.8785 0.8843 0.8897 0.8960 0.9040 0.9124 0.9165 0.0000
0.2 0.8897 0.8927 0.8960 0.9003 0.9040 0.9075 0.9124 0.9162 0.9165 0.9161 0.0000
0.3 0.9008 0.9040 0.9065 0.9087 0.9124 0.9145 0.9168 0.9165 0.9163 0.9161 0.0000
0.4 0.9075 0.9099 0.9124 0.9140 0.9162 0.9168 0.9165 0.9163 0.9161 0.9160 0.0000
0.5 0.9124 0.9134 0.9154 0.9165 0.9167 0.9165 0.9163 0.9162 0.9161 0.9160 0.0000
216
L. Grad-Gyenge
via an exhaustive search over the parameter space with the fidelity of 0.1 in the interval [0, 1] × [0, 1]. Evaluation measures precision, recall and nDCG are recorded during the evaluation on the first 10 000 known ratings values. The results are presented both graphically and numerically. The primary finding of the numerical experiments is that the quality of the recommendations decreases in the case of setting the activation relax (ra ) parameter to a low value (close to 0). The quality stays low especially if the setting of the spreading relax (rs ) is set to a high value (close to 1). In addition, the method is not able to calculate recommendations if the spreading relax (rs ) parameter is set to 0. To be more exact, not counting the rs = 0 case, spreading activation shows a stable performance. Depending on the evaluation measure, the quality of the recommendations changes numerically only from the second or the third digit. We assume that the reason behind this issue can be found in the theoretical foundations of the technique. Spreading activation is a typical example of the paradigm of relatedness, which paradigm generalizes the connections between the entities and emphasizes the network like behaviour of the graph. It also means that the method strongly relies on the structure of the graph, thus it involves also network science. We would conculde that the presence or involvement of the network leads to a stable calculation mechanism which is less sensitive to the actual setting of the parameters. Our plans for the future is to analyse the stability of recommendation spreading as introduced by Grad-Gyenge et al. [2]. Another important direction is the temporal influence as a still open question in the case of the graph based techniques as also investigated by Dojchinovski et al. [31].
References [1] L. Grad-Gyenge and P. Filzmoser, “The Paradigm of Relatedness,” in AKTB 2016 : 8th Workshop on Applications of Knowledge-Based Technologies in Business. Springer International Publishing AG, 2017, pp. 57–68. [2] L. Grad-Gyenge, P. Filzmoser, and H. Werthner, “Recommendations on a Knowledge Graph,” in MLRec 2015 : 1st International Workshop on Machine Learning Methods for Recommender Systems, 2015, pp. 13–20. [Online]. Available: http: //mlrec.org/2015/papers/grad2015recommendation.pdf [3] Y. Koren, R. Bell, and C. Volinsky, “Matrix Factorization Techniques for Recommender Systems,” Computer, vol. 42, no. 8, pp. 30–37, Aug. 2009. [Online]. Available: http://dx.doi.org/10.1109/MC.2009.263 [4] S. Zhang, W. Wang, J. Ford, and F. Makedon, “Learning from incomplete ratings using non-negative matrix factorization,” in In Proc. of the 6th SIAM Conference on Data Mining (SDM, 1996, pp. 549–553. [5] S. Purushotham and Y. Liu, “Collaborative Topic Regression with Social Matrix Factorization for Recommendation Systems.” in ICML. icml.cc / Omnipress, 2012. [Online]. Available: http://dblp.uni-trier.de/db/conf/icml/icml2012. html#PurushothamL12
[6] S. Lee, S. Park, M. Kahng, and S. goo Lee, “PathRank: Ranking nodes on a heterogeneous graph for flexible hybrid recommender systems.” Expert Syst. Appl., no. 2, pp. 684– 697. [7] K. Lee and K. Lee, “Escaping your comfort zone: A graphbased recommender system for finding novel recommendations among relevant items.” Expert Syst. Appl., no. 10, pp. 4851–4858. [8] A. Tiroshi, S. Berkovsky, M. A. Kâafar, D. Vallet, and T. Kuflik, “Graph-Based Recommendations: Make the Most Out of Social Data.” in UMAP, ser. Lecture Notes in Computer Science, V. Dimitrova, T. Kuflik, D. Chin, F. Ricci, P. Dolog, and G.-J. Houben, Eds. Springer, pp. 447–458. [9] R. Guha, R. Kumar, P. Raghavan, and A. Tomkins, “Propagation of trust and distrust,” in WWW ’04: Proceedings of the 13th international conference on World Wide Web. New York, NY, USA: ACM, 2004, pp. 403–412. [10] P. Massa and P. Avesani, “Trust-Aware Collaborative Filtering for Recommender Systems.” in CoopIS/DOA/ODBASE (1), ser. Lecture Notes in Computer Science, R. Meersman and Z. Tari, Eds., vol. 3290. Springer, 2004, pp. 492–508. [11] C.-N. Ziegler and G. Lausen, “Propagation Models for Trust and Distrust in Social Networks,” Information Systems Frontiers, vol. 7, no. 4-5, pp. 337–358, Dec. 2005. [12] A. Jøsang, S. Marsh, and S. Pope, “Exploring Different Types of Trust Propagation.” in iTrust, ser. Lecture Notes in Computer Science, K. Stølen, W. H. Winsborough, F. Martinelli, and F. Massacci, Eds., vol. 3986. Springer, 2006, pp. 179–192. [13] I. Guy et al., “Personalized recommendation of social software items based on social relations.” in RecSys, L. D. Bergman, A. Tuzhilin, R. D. Burke, A. Felfernig, and L. Schmidt-Thieme, Eds. ACM, pp. 53–60. [14] I. Konstas, V. Stathopoulos, and J. M. Jose, “On Social Networks and Collaborative Recommendation,” in Proceedings of the 32Nd International ACM SIGIR Conference on Research and Development in Information Retrieval, ser. SIGIR ’09. New York, NY, USA: ACM, 2009, pp. 195– 202. [15] J. He, “A Social Network-based Recommender System,” Ph.D. dissertation, Los Angeles, CA, USA, 2010, aAI3437557. [16] P. Kazienko, K. Musial, and T. Kajdanowicz, “Multidimensional Social Network in the Social Recommender System,” Trans. Sys. Man Cyber. Part A, vol. 41, no. 4, pp. 746–759, Jul. 2011. [17] I. Cantador and P. Castells, Multilayered Semantic Social Network Modeling by Ontology-Based User Profiles Clustering: Application to Collaborative Filtering. Berlin, Heidelberg: Springer Berlin Heidelberg, pp. 334–349. [18] Q. Hu et al., “HeteroSales: Utilizing Heterogeneous Social Networks to Identify the Next Enterprise Customer,” in Proceedings of the 25th International Conference on World Wide Web, ser. WWW ’16. Republic and Canton of Geneva, Switzerland: International World Wide Web Conferences Steering Committee, pp. 41–50. [19] R. Catherine and W. Cohen, “Personalized Recommendations Using Knowledge Graphs: A Probabilistic Logic Pro-
On the Optimal Setting of Spreading Activation Parameters to Calculate Recommendations on the Knowledge Graph
[20]
[21]
[22]
[23]
[24]
[25]
[26]
[27]
[28]
[29]
[30]
[31]
gramming Approach,” in Proceedings of the 10th ACM Conference on Recommender Systems, ser. RecSys ’16. New York, NY, USA: ACM, pp. 325–332. X. Yu et al., “Personalized Entity Recommendation: A Heterogeneous Information Network Approach,” in Proceedings of the 7th ACM International Conference on Web Search and Data Mining, ser. WSDM ’14. New York, NY, USA: ACM, pp. 283–292. P. Kouki, S. Fakhraei, J. Foulds, M. Eirinaki, and L. Getoor, “HyPER: A Flexible and Extensible Probabilistic Framework for Hybrid Recommender Systems,” in Proceedings of the 9th ACM Conference on Recommender Systems, ser. RecSys ’15. New York, NY, USA: ACM, pp. 99–106. R. Burke, “The Adaptive Web,” P. Brusilovsky, A. Kobsa, and W. Nejdl, Eds. Berlin, Heidelberg: Springer-Verlag, ch. Hybrid Web Recommender Systems, pp. 377–408. T. Hussein, D. Westheide, and J. Ziegler, “Contextadaptation based on Ontologies and Spreading Activation,” in LWA 2007: Lernen - Wissen - Adaption, Halle, September 2007, Workshop Proceedings, 2007, pp. 361–366. Q. Gao, J. Yan, and M. Liu, “A Semantic Approach to Recommendation System Based on User Ontology and Spreading Activation Model.” in NPC Workshops, J. Cao, M. Li, C. Weng, Y. Xiang, X. Wang, H. Tang, F. Hong, H. Liu, and Y. Wang, Eds. IEEE Computer Society, 2008, pp. 488–492. X. Jiang and A.-H. Tan, “Learning and inferencing in user ontology for personalized Semantic Web search.” Inf. Sci., vol. 179, no. 16, pp. 2794–2808, 2009. Y. Blanco-Fernández, M. L. Nores, A. Gil-Solla, M. R. Cabrer, and J. J. P. Arias, “Exploring synergies between content-based filtering and Spreading Activation techniques in knowledge-based recommender systems.” Inf. Sci., vol. 181, no. 21, pp. 4823–4846, 2011. V. Codina and L. Ceccaroni, “Taking Advantage of Semantics in Recommendation Systems.” in CCIA, ser. Frontiers in Artificial Intelligence and Applications, R. Alquézar, A. Moreno, and J. Aguilar-Martin, Eds., vol. 210. IOS Press, 2010, pp. 163–172. A. Troussov, D. Parra, and P. Brusilovsky, “Spreading Activation Approach to Tag-aware Recommenders: Modeling Similarity on Multidimensional Networks,” D. Jannach, W. Geyer, J. Freyne, S. S. Anand, C. Dugan, B. Mobasher, and A. Kobsa, Eds., 2009, pp. 57–62. J. M. Alvarez, L. Polo, P. Abella, W. Jimenez, and J. E. Labra, “Application of the Spreading Activation Technique for Recommending Concepts of well-known ontologies in Medical Systems,” 2011. P. Resnick, N. Iacovou, M. Suchak, P. Bergstorm, and J. Riedl, “GroupLens: An Open Architecture for Collaborative Filtering of Netnews,” in Proc. of ACM 1994 Conference on Computer Supported Cooperative Work. Chapel Hill, North Carolina: ACM, 1994, pp. 175–186. M. Dojchinovski, J. Kuchar, T. Vitvar, and M. Zaremba, Personalised Graph-Based Selection of Web APIs. Berlin, Heidelberg: Springer Berlin Heidelberg, 2012, pp. 34–48. [Online]. Available: https://doi.org/10.1007/978-3-642-35176-1_3
217