Technische Universität Ilmenau. P. O. Box 100565, D-98684 Ilmenau, Germany ..... pp. 829â833. [9] L. Materum, J.-I. Takada, I. Ida, and Y. Oishi, âMobile station.
On the Reliability of Multipath Cluster Estimation in Realistic Channel Data Sets Christian Schneider, Maysam Ibraheam, Stephan H¨afner, Martin K¨aske, Matthias Hein and Reiner S. Thom¨a Institute for Information Technology Technische Universit¨at Ilmenau P. O. Box 100565, D-98684 Ilmenau, Germany Email: {christian.schneider, maysam.ibraheam, stephan.haefner, matthias.hein, reiner.thomae}@tu-ilmenau.de Abstract—For the parametrization of geometry based stochastic channel models as from the IST-WINNER or COST 273/IC1004 initiatives large data analysis from channel sounding campaigns play an important role. Whereby the reliability of cluster charaterisation as a post-processing step after the high resolution multipath estimation exhibits a crucial issue. In this contribution a framework for evaluation and development of different cluster algorithms is discussed. Furthermore a novel hierarchical algorithm is introduced and compared to standard K-means and Fuzzy-C-means algorithms. Whereby the new algorithm outperforms the standard algorithms wrt. increasing number and size of clusters. Index Terms—Multipath clustering, spatial channel modelling, high resolution multipath parameter estimation, geometry-based stochastic channel model.
I.
INTRODUCTION
Broadband wireless channel models are understood to be essential for reliable assessing the performance of wireless systems. In particular if the systems are rely on multiple input multiple output (MIMO) concepts directional depending channel models are indispensable [1]. Standardized models [1], [2] and recently proposed models like WINNER channel model family and COST273/2100/IC1004 [3], [4] allow for modelling of multipath propagation with parameters such as delay, direction of arrival and direction of departure (direction is composed of azimuth and elevation). Among a broad range of channel model approaches the aforementioned concepts belong to the group of geometry based stochastic channel models. Most of those assume that multipath components arrive/departure in clusters, with similar properties within the considered parameter domains. To parameterize these models and analyze the cluster properties in a statistical manner a large number of measurement data sets has to be processed. Various clustering algorithms have been discussed. At first visual inspection [5], [6] has been used, which is hardly applicable for automatic processing. Considering 1-2 parameter domains it provides a simple and reliable check. In wireless channel modelling often the K-means algorithm, which belongs to the group of partitional clustering, is used e.g. [7]–[9]. To group multipath into clusters two important extensions on the K-means have been made in the past: consideration of the multipath power
[10] and dimension weighting by the multipath component distance (MCD) [10], [11]. A hierarchical clustering approach is applied in [9] and in [12] first common cluster among multi-links have been studied. In [13] K-means and Fuzzy-cmean as well as different initialization concepts are compared, whereby the Fuzzy-c-means outperformed the K-means under random initialization but with a deterministic initialization both performances are similar. Notable a crucial issue in any clustering algorithm is the estimation of number of clusters [14], [15]. A so called initial guess is introduced in [16], however in [13] it is shown that an intermediate validation step would increase the reliability. Furthermore including various cluster validation indices (CVI) into the final cluster estimaton process can improve the estimation result [17]. Within this contribution we are studying the performance and reliability of three different clustering algorithms. A similar evaluation method as in [18] is introduced. However based on the WINNER channel model [3] a more detailed study within the 3D multipath propagation space is performed. Furthermore a novel hierarchical clustering algorithm is proposed. The statistical analysis highlights that the new proposal outperforms K-means and Fuzzy-c-means. II. E VALUATION F RAMEWORK select NCl and ASA of cluster
Generation of WINNER channel data sets
Cluster estimation with various algorithms
Statistical analysis of clustering results
Comparison and conclusion
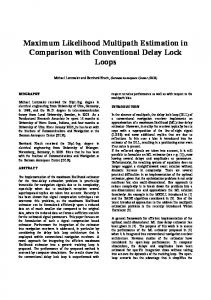
Fig. 1: Workflow of cluster algorithm testbed based on realistic WINNER channel model For a consistent evaluation of the various multipath cluster estimation algorithms a framework has been developed. The Fig. 1 sketches the basic idea of the method. To allow statistical analysis the WINNER model creates 500 independent drops with multipath parameter sets based in the C2 scenario (urban macro cell). The multipath components (MPCs) are used as input to the different clustering algorithms. The outcome of the clustering is evaluated and compared wrt. the
Fig. 2: Example on distribution of MPCs in azimuth and elevation based on WINNER scenario C2 with 24 clusters and inner cluster ASA = 2◦ , view:AoA = 77◦ , EoA = 0◦
Fig. 3: Example on distribution of MPCs in azimuth and elevation based on WINNER scenario C2 with 24 clusters and inner cluster ASA = 15◦ , view:AoA = 77◦ , EoA = 0◦
known cluster positions. Based on the pre-knowledge about the clusters created by the WINNER model the accuracy and reliability of each algorithm can be assessed. To discuss the limits of the clustering algorithms 2 important model parameters have been alternated: number of clusters (NCl) and the inner cluster azimuth spread of arrival (ASA), while other parameters are kept constant wrt. the original WINNER C2 definition. Table I summarizes the parameter variation. With increasing NCl the density of MPCs and clusters increases hence it will be more difficult to estimate the number and position of clusters accurately. Furthermore by controlling the size of cluster, e.g. by varying the inner cluster ASA the difficulty can be scaled. A small inner cluster ASA = 2◦ leads to rather compact and easy detectable clusters of multipath components, whereby in contrast to that a ASA = 15◦ blurred different clusters into each other. Comparing Fig. 2 and Fig. 3 this effect can be seen. Both figures contain 24 clusters each with 20 so-called sub-path (400 sub-path in total). A inner cluster ASA = 15◦ and N Cl = 20 clusters represent the standard parameter setup for WINNER C2.
A. K-means and Fuzzy-c-means Both algorithms are considered as described within [13], [16], whereby only the centroid calculation is power weighted and the inital guess from [16] is slightly adopted to stop at a pre-defined maximum NCl rather than stopping by cluster power threshold or similar. Furthermore within the cluster estimation a validation step is included, where various cluster validation indices (CVIs) are calculated. The final decision is derived after applying a fusion method. A similar method is used within [17] but here up to 9 instead of 4 CVIs are considered. In the following a summary of the algorithm w.r.t. [13] is given: Algorithm 1 KPM and FCM approach 1: 2: 3: 4: 5: 6:
7:
III. C LUSTERING A LGORITHMS
8:
In the following, two (three) algorithms are briefly described: two already known concepts namely K-means and Fuzzy-c-means and the new multi-reference detection of maximum separation (MR-DMS).
10:
9:
TABLE I: Overview of channel model parameter changes NCl
8
12
16
20
inner cluster ASA
2◦
6◦
10◦
15◦
24
11: 12:
Define N Clmax Calculate the initial position of the centroids with the IG Store all intermediate results: centroid positions w.r.t. NCl for k = 1 to N Clmax do while Iter �= IterM ax ∨ CentroidM ove do Calculate the distance d between any MPC and given centroid Reallocate MPC to the closest centroid Calculate the new position of the centroids end while Validate the different clustering results by calculating the CVI’s Calculate the fusion of the different CVI’s end for
It is worth to note that algorithm 1 can be applied for both concepts K-means as well as Fuzzy-c-means. The basic difference between both approaches arises from the soft value based affiliation of one MPC to all centroids within the Fuzzy approach. Subsequent the CVI calculation is sligthly different
w.r.t. the soft values. B. Multi-Reference Detection of Maximum Separation (MRDMS) The novel MR-DMS belongs to the group of hierarchical clustering approaches and herein to the divisive algorithms (top down). The basic idea is to start with one single cluster and divide that cluster into 2 smaller clusters. This procedure is applied again on each new cluster and will be continued until a defined maximum number of clusters is reached. The splitting is based on the calculation of the maximum distance change within one single cluster. Whereby the distance between each MPC and the reference points are calculated and sorted in ascending manner. For each estimated number of clusters different CVIs and subsequent a fusion of these indices is derived to converge into the final decision. In the following a algorithmic description is given: Algorithm 2 MR-DMS 1: 2: 3: 4: 5: 6: 7: 8: 9: 10: 11: 12:
Define N Clmax and NRef , set k = 2 Add all MPC’s to one cluster D1 while k �= N Clmax do for r = 1 to NRef do Calculate distance between MPC’s and reference Store distance in dk,r end for Sort dk,r in ascending order Calculate the derivative d�k,r Find index max(d�k,r ) Split Dk into 2 parts Dk−1 and Dk end while
Compared to the conventional MPC clustering approaches (III-A) following advantages for the MR-DMS can be summarized: • No initialization or pre-knowledge is required • Elliptical and non convex clusters are possible • Rather low complexity However to avoid distance ambiguities well distributed multiple references are required. The complexity of the MRDMS is basically scaling linear with the considered number of references. In the following we used 16 equally distributed references. C. Distance Measure, Cluster Validation Indices and Fusion The considered multipath components have following parameters: • azimuth and elevation at receiver φAoA , θAoA • azimuth and elevation at transmiter φAoD , θAoD • power of the multipath p • delay τ A distance between two MPCs or a centroid/reference and a MPC is calculated as: M CD =
� ||DistAoA ||22 + ||DistAoD ||22 + Dist2τ
(1)
where ||DistAoA ||22 refers to the distance within the angular domain at the receiver, ||DistAoD ||22 at the transmitter and Distτ within the delay domain of the MPCs. The operator ||...||22 refers to the squared euclidean norm. Each distance contribution are derived as described in [10], [11], [13]. To validate the clustering results und select the best result different cluster validation indices (CVI) are introduced. A detailed description of the following CVIs can be found in [13]–[15], [18]: CVIs used here include Xie Beni index (XB), Davies-Bouldin index (DB), Dunn index (D), Calinski Harabasz index (CH), Scott and Simons index (SaS), PakhiraBandyopadhyay-Maulik index (PBM), I index (I), Silhouette width index (SWC), Hartigan Index (H), Fukuyama and Sugeno index (FS), Zahid index (Z), Partition coefficient and exponential separation (PCAES), Kwon index (vk ), Partition index (SC), Fuzzy Hypervolume index (FHV). Within the table II the selected CVIs are summarized. Selecting the best matching CVIs indeed is a difficult study because the varity of CVIs is very large and a general trend or a single CVI with a very good matching result could not be found. The selected CVIs in table II are based on a empirical pre-study with WINNER data sets. In [17] similar observation have been reported. Therefore Mota et al. introduced the fusion of the CVI results, whereby score fusion with geometric and arithmetic mean (SF g, SF a) as well as the median (SF m) and decision rank fusion methods (DRF ) are applied. Furthermore here a simple mean of all fusion techiques is introduced to reduce to among of clustering results: M oF = mean(SF a, SF g, SF m, DRF ). TABLE II: Selected CVIs for cluster validation K-means
XB, DB, SaS, I, D, PBM, SWC, H
Fuzzy-c-means
XB, FS, Z, FHV, PCAES, vk , PBM, SC, I
MR-DMS
XB, DB, SaS, CH, I, PBM
IV.
SIMULATION RESULTS
To assess the reliability and accuracy of the considered clustering algorithms Monte-Carlo simulations wrt. the introduced evaluation framework (Fig. 1) have been performed. By increasing the NCl and the inner cluster ASA according to the definitions in Table I it is possible to follow if the estimation of the correct number of clusters fails or not. For each paramater combination in Table I 500 WINNER drops of the scenario C2 have been created. Whereby each cluster consists of 20 sub-path, hence the total number of sub-path is changing with the defined NCl. Furthermore it is important to be noted that within the WINNER model so-called sub-cluster have been introduced. Each of the two strongest cluster are split into 3 sub-cluster, hence 2x2 additional (sub-)cluster ”appear”. While splitting cluster the original number of sub-path (#20) per cluster is kept constant. The NCl given in Table I already include sub-cluster, hence the original NCl is minus 4. This implies an additional difficulty because these 2 groups of 3 sub-cluster are close co-located within the multipath parameter space and probably very tough to be detected.
50
0
5
10
15 NCl
Probability [%]
100
20
25
AS − A = 10o
5
10
15 NCl
20
25
AS − A = 6o
50
0
30
50
0
100 Probability [%]
AS − A = 2o
5
10
15 NCl
100 Probability [%]
Probability [%]
100
25
30
AS − A = 15o
50
0
30
20
5
10
15 NCl
20
25
30
Fig. 4: Probability of estimated NCl detected by the K-means based on N CL = 12(8)
o
50
0
5
10
15 NCl
20
25
Probability [%]
o
AS−A=10 50
5
10
15 NCl
20
25
o
AS−A=6 50
0
30
100
0
100
5
10
15 NCl
20
25
100 Probability [%]
Probability [%]
AS−A=2
Probability [%]
100
o
AS−A=15 50
0
30
30
5
10
15 NCl
20
25
30
Fig. 5: Probability of estimated NCl detected by the MR-DMS based on N CL = 12(8)
30 20 10 0
5
10
15 NCl
Probability [%]
50
20
25
30 20 10 5
10
15 NCl
20
25
30 20 10 5
10
15 NCl
50
o
AS − A = 10
AS − A = 6o
40
0
30
40
0
50 Probability [%]
AS − A = 2o
40
Probability [%]
Probability [%]
50
25
30
AS − A = 15o
40 30 20 10 0
30
20
At first cluster estimation results for N Cl = 12(8), where (8) refers to the original NCl, are shown in Fig. 4 and Fig. 5. The selected N Cl is similar to [18]. Only the Kmeans results are discussed, while the Fuzzy-c-means algorithm showed similar performances. It can be studied that with increasing ASA the probability distribution gets broader while the occurrence of ”correct” estimated NCl is decreasing. Comparing K-means and MR-DMS it has been found the Kmean results are distributed around N Cl = 8 while MRDMS around N Cl = 12. Hence it seems the K-mean has difficulties to detected the sub-cluster. With increasing N Cl both effects are emphasized as detailed within Figs. 6 and 7. Only with low ASA, e.g. at 2◦ , the K-means can detect sometime the ”correct” N Cl, however with increasing the ASA this approach almost fails. The MR-DMS seems to be still working, however the detected NCl is distributed broader around 20-24. The results of this study can be summarized by the following discussion. In Fig. 8 the detected mean NCl is shown where the K-means shows larger divergences with increasing correct NCl and ASA. Furthermore the Figs. 9 and 10 summarize the findings assuming a range/span of correctly estimated number of clusters, e.g. in Fig. 9 if the true N Cl = 24 then a range of (-4/+2) equivalent to N Cl = 20..26 is accepted to be correct. In both result figures it can be seen that the MRDMS clearly outperforms the K-means (subsequent the Fuzzyc-means). With increasing inner cluster ASA the estimation performance decreases, which is similar for all algorithms. Furthermore if the NCl increase again the performance of all clustering algorithms decreases. However for the MRDMS it turns out that a probability of 80% and more for correctly estimated NCl is possible with inner cluster ASA and NCl until 10◦ respectively 16 clusters. Obviously for any clustering algorithm it is hard to estimate the correct NCl (wrt. the defined range/span) of the original WINNER scenario C2 parameter setup (inner clusterASA = 15, N Cl = 24).
5
10
15 NCl
20
25
25
30
o
MR−DMS AS−A = 2
o
MR−DMS AS−A = 6
30 20 10 0
5
10
Probability [%]
50 40
15 NCl
20
25
o
20 10 5
10
15 NCl
20
25
30
o
KPM AS−A = 2 15
o
KPM AS−A = 6
o
KPM AS−A = 10
o
KPM AS−A = 15 10
o
0 8
20
10
12
14
16 NCl
18
20
22
24
10 5
10
50
AS−A=10
o
MR−DMS AS−A = 15
AS−A=6
30
0
30
30
0
40
o
MR−DMS AS−A = 10
5
50
o
AS−A=2
Probability [%]
40
Probability [%]
Probability [%]
50
20
mean(NCl)
Fig. 6: Probability of estimated NCl detected by the K-means based on N CL = 24(20)
40
15 NCl
20
25
30
15 NCl
20
25
30
o
Fig. 8: Mean NCl detected by K-means and MR-DMS vs. defined NCl and inner cluster ASA
AS−A=15
30 20 10 0
5
10
Fig. 7: Probability of estimated NCl detected by the MR-DMS based on N CL = 24(20)
V. C ONCLUSION An evaluation framework for algorithms to cluster multipath parameters in wireless propagation and a novel hierarchical clustering algorithm have been proposed. The testbed is based
R EFERENCES
100 90 80
Probability
[%]
70 60 50 40 30 20 10 0 8
10
MR-DMS AS-A = MR-DMS AS-A = MR-DMS AS-A = MR-DMS AS-A = KPM AS-A = 2o KPM AS-A = 6o KPM AS-A = 10o KPM AS-A = 15o
2o 6o 10o 15o
12
14
16 NCl
18
20
22
24
Fig. 9: Probability of correct estimation of NCl (range: -4/+2) vs. defined NCl and inner cluster ASA 100 90
Probability
[%]
80 o
MR−DMS AS−A = 2
70
o
MR−DMS AS−A = 6
60
o
MR−DMS AS−A = 10 50
MR−DMS AS−A = 15
40
KPM AS−A = 2
o
o o
KPM AS−A = 6
30
o
KPM AS−A = 10 20
o
KPM AS−A = 15
10 0 8
10
12
14
16 NCl
18
20
22
24
Fig. 10: Probability of correct estimation of NCl (range: -2/+2) vs. defined NCl and inner cluster ASA
on the well-accepted WINNER channel model and by varying relevant cluster parameters limitations on reliability and accuracy of clustering algorithms can be assessed. Within this contribution the number of clusters and the inner cluster azimuth spread of arrival (ASA) has been systematically changed. The new hierarchical clustering algorithm, the multi-reference detection of maximum separation (MR-DMS), splits interatively clusters into 2 smaller clusters (top-to-down approach). In comparison to the already adopted K-means and Fuzzy-cmeans concepts the proposed MR-DMS does not need any initialization and has lower complexity, however a carefully selection of cluster validation indices and the reference is still required. The Monte-Carlo simulations based on the WINNER model and the subsequent statistical evaluation highlight that the MR-DMS outperforms the K-means and the Fuzzy-cmeans. However if the density of the clusters or the size of the clusters increases, hence an overlapping of those clusters can be expected, the algorithms dramatically suffer in accuracy. Whereby the MR-DMS still shows better reliability than the K-means and Fuzzy-c-means. ACKNOWLEDGMENTS The authors would like to thank the administration and members of Th¨uringer Innovationszentrum Mobilit¨at (ThIMo) and the group of researchers Powertrain - Radio Train PORT for their support and the Th¨uringer Aufbaubank TAB / ESF for their kind funding.
[1] P. Almers, E. Bonek, A. Burr, N. Czink, M. Debbah, V. DegliEsposti, H. Hofstetter, P. Kyosti, D. Laurenson, G. Matz, A. Molisch, C. Oestges, and H. Ozcelik, “Survey of channel and radio propagation models for wireless mimo systems,” EURASIP Journal on Wireless Communications and Networking, vol. 2007, no. 1, p. 019070, 2007. [Online]. Available: http://jwcn.eurasipjournals.com/content/2007/1/019070 [2] 3GPP - 3GPP2 Spatial Channel Model Ad-hoc Group, 3GPP TR 25.996, “Spatial channel model for multiple input multiple output (mimo) simulations,” v6.1.0 (2003-09. [3] “http://projects.celtic-initiative.org/winner+/.” [4] N. Czink and C. Oestges, “The cost 273 mimo channel model: Three kinds of clusters,” in Spread Spectrum Techniques and Applications, 2008. ISSSTA ’08. IEEE 10th International Symposium on, 2008, pp. 282–286. [5] L. Vuokko, P. Vainikainen, and J. Takada, “Clusterization of measured direction-of-arrival data in an urban macrocellular environment,” in Personal, Indoor and Mobile Radio Communications, 2003. PIMRC 2003. 14th IEEE Proceedings on, vol. 2, 2003, pp. 1222–1226 vol.2. [6] L. Vuokko, P. Vainikainen, and J.-i. Takada, “Clusters extracted from measured propagation channels in macrocellular environments,” Antennas and Propagation, IEEE Transactions on, vol. 53, no. 12, pp. 4089– 4098, 2005. [7] J. Salo, J. Salmi, N. Czink, and P. Vainikainen, “Automatic clustering of nonstationary mimo channel parameter estimates,” in in ICT05, Cape Town, South Africa, May 2005, Cape Town, South Africa. [8] W. Dong, J. Zhang, X. Gao, P. Zhang, and Y. Wu, “Cluster identification and properties of outdoor wideband mimo channel,” in Vehicular Technology Conference, 2007. VTC-2007 Fall. 2007 IEEE 66th, 2007, pp. 829–833. [9] L. Materum, J.-I. Takada, I. Ida, and Y. Oishi, “Mobile station spatio-temporal multipath clustering of an estimated wideband mimo double-directional channel of a small urban 4.5ghz macrocell,” EURASIP J. Wirel. Commun. Netw., vol. 2009, pp. 9:1–9:16, Jan. 2009. [Online]. Available: http://dx.doi.org/10.1155/2009/804021 [10] N. Czink, P. Cera, J. Salo, E. Bonek, J. P. Nuutinen, and J. Ylitalo, “Improving clustering performance using multipath component distance,” Electronics Letters, vol. 42, no. 1, pp. 33–5–, 2006. [11] M. Steinbauer, H. Ozcelik, H. Hofstetter, and C. Mecklenbraeuker, “How to quantify multipath separation?” IEICE transactions on electronics, Special Issue on Signals, Systems and Electronics Technology, vol. 85, no. 3, pp. 552–557, mar 2002. [Online]. Available: http://ci.nii.ac.jp/naid/110003220895/en/ [12] J. Poutanen, F. Tufvesson, K. Haneda, V. Kolmonen, and P. Vainikainen, “Multi-link mimo channel modeling using geometry-based approach,” Antennas and Propagation, IEEE Transactions on, vol. 60, no. 2, pp. 587–596, 2012. [13] C. Schneider, M. Bauer, M. Narandzic, W. A. T. Kotterman, and R. Thoma, “Clustering of mimo channel parameters - performance comparison,” in Vehicular Technology Conference, 2009. VTC Spring 2009. IEEE 69th, 2009, pp. 1–5. [14] J. Han, Data Mining: Concepts and Techniques. San Francisco, CA, USA: Morgan Kaufmann Publishers Inc., 2005. [15] X. L. Xie and G. Beni, “A validity measure for fuzzy clustering,” Pattern Analysis and Machine Intelligence, IEEE Transactions on, vol. 13, no. 8, pp. 841–847, 1991. [16] N. Czink, R. Tian, S. Wyne, F. Tufvesson, J. P. Nuutinen, J. Ylitalo, E. Bonek, and A. Molisch, “Tracking time-variant cluster parameters in mimo channel measurements,” in Communications and Networking in China, 2007. CHINACOM ’07. Second International Conference on, 2007, pp. 1147–1151. [17] S. Mota, M. Garcia, A. Rocha, and F. Perez-Fontan, “Clustering of the multipath radio channel parameters,” in Antennas and Propagation (EUCAP), Proceedings of the 5th European Conference on, 2011, pp. 3232–3236. [18] S. Mota, F. Perez-Fontan, and A. Rocha, “Estimation of the number of clusters in multipath radio channel data sets,” Antennas and Propagation, IEEE Transactions on, vol. 61, no. 5, pp. 2879–2883, 2013.