1
On the summertime planetary boundary layer with
2
different thermodynamic stability in China: A
3
radiosonde perspective
4
Wanchun Zhang1#,Jianping Guo1#*,Yucong Miao1,Huan Liu1,Yu Song2,
5
Zhang Fang3, Jing He1, Mengyun Lou1, Yan Yan1, Yuan Li1, Panmao Zhai1* 1
6
State Key Laboratory of Severe Weather, Chinese Academy of Meteorological Sciences, Beijing 100081, China
7 2
8
Department of Environmental Science, Peking University, Beijing, 100871, China
9 10
State Key Joint Laboratory of Environmental Simulation and Pollution Control,
3
Public Meteorological Service Center, China Meteorological Administration, Beijing 100081, China
11 12 13 14 15
# These co-authors contribute equally to this work.
16
Correspondence to:
17
Dr./Prof. Jianping Guo, Email:
[email protected]
18
Prof. Panmao Zhai, Email:
[email protected]
19
Key Points:
20
l
neutral PBL types across China for the first time
21 22
l
The PBL height is positively (negatively) associated with near-surface temperature (humidity) for both convective and neutral PBLs
23 24
PBL height is estimated from afternoon soundings for convective, stable and
l
Clouds tend to cause more stable atmosphere, resulting in lower PBL height 1
25
Abstract
26
Strongly influenced by thermodynamic stability, the planetary boundary layer (PBL) is
27
key to the exchange of heat, momentum, and moisture between the ground surface and
28
free troposphere. The PBL with different thermodynamic stability across the whole
29
China, however, is not yet well understood. In this study, the occurrence frequency and
30
spatial distribution of convective boundary layer (CBL), neutral boundary layer (NBL),
31
and stable boundary layer (SBL) were systematically investigated, based on intensive
32
summertime soundings launched at 1400 Beijing time (BJT) throughout the China’s
33
Radiosonde Network (CRN) for the period 2012 to 2016. Overall, the occurrences of
34
CBL, NBL, and SBL account for 70%, 26%, and 4%, respectively, suggesting CBL
35
dominates in summer throughout China. In terms of the spatial pattern of PBL height,
36
a prominent north-south gradient can be found with higher PBL height in Northwest
37
China. Besides, the PBL heights of CBL and NBL were found to be positively
38
(negatively) associated with near-surface air temperature (humidity), whereas no
39
apparent relationship was found for SBL. Furthermore, clouds tend to reduce the
40
occurrence frequency, irrespective of PBL types. Roughly 70% of SBL cases occur
41
under overcast conditions, much higher than those for NBL and CBL, indicating that
42
clouds govern to some extent the occurrence of SBL. In contrast, except for the
43
discernible changes in PBL height under overcast condition relative to that under clear-
44
sky conditions, the changes in PBL height under partly cloudy condition are no more
45
than 170 m for both NBL and CBL types.
46
Keywords: Radiosonde, convective PBL, PBL height, thermodynamic stability, China 2
47
1. Introduction
48
The planetary boundary layer (PBL), the lowest layer of troposphere close to the
49
surface, plays an important role in air pollution, weather and climate (Garratt 1992;
50
1994; Stull 1988) . The turbulent PBL is also the main place where the vertical exchange
51
of momentum, heat, moisture, and atmospheric pollutants occurs between ground
52
surface and free troposphere (e.g., Garratt 1992; Oke 2002; Hu et al. 2010; Zhang et
53
al. 2015; Guo et al. 2016a). The turbulent motions in the PBL are responsible for the
54
mixing processes in the atmosphere, which affects the vertical redistribution of moisture
55
and momentum. This in turn impacts on the formation and evolution of boundary-layer
56
clouds such as stratocumulus and cumulus (e.g., Paluch and Lenschow 1991; Eltahir
57
1996; Amenu and Kumar 2005; Sherwood et al. 2014; Eitan et al. 2017; Zhang et al.
58
2017).
59
The PBL is increasingly recognized as one of important parameters that strongly
60
influence the air quality (Guo et al. 2009; Sandip and Martial 2015; Li et al. 2017),
61
partly account for the varying regional warming rate (Davy and Esau 2016), and
62
significantly affect global weather and climate system (Medeiros et al. 2005; Esau et
63
al. 2010; Fletcher et al. 2016; Solomon et al. 2017). Previous studies show that the
64
heating and cooling of ground surface, cloudiness, and the variability in surface
65
characteristics could affect the evolution of the PBL (e.g., Garratt 1994; Miao et al.
66
2015a; 2017). The PBL height during the daytime is found to be significantly negatively
67
correlated with surface relative humidity, but positively correlated with surface
68
temperature (Zhang et al. 2013). Likewise, on the seasonal and annual timescales, the 3
69
PBL height is positively associated with surface temperature and 10-m wind speed, but
70
negatively associated with surface pressure (Seidel et al. 2012; Guo et al. 2016b).
71
The PBL height is traditionally determined from the vertical profiles of temperature,
72
humidity, and wind from atmospheric soundings. In addition, several other methods
73
based on new data sources (e.g., lidar, doppler radar, and sodar) have been developed to
74
elucidate the PBL structure/processes (e.g., Holzworth 1964; Coulter 1979; Beyrich
75
1997; Steyn et al. 1999; Seibert 2000; Asimakopoulos et al. 2004; Hennemuth and
76
Lammert 2006; Lammert and Bösenberg 2006; Dandou et al. 2009; Mao et al. 2009;
77
McGrath-Spangler and Denning 2012; Chan and Wood 2013; Sawyer and Li 2013;
78
Zhang et al. 2014; Guo et al. 2016b; Zhang et al. 2016).
79
Based on the atmospheric soundings collected in several major field campaigns, the
80
diurnal variation of three dominant PBL types, namely convective boundary layer
81
(CBL), stable boundary layer (SBL), and neutral boundary layer (NBL) in the
82
continental U.S., were documented (Liu and Liang 2010): the CBL mainly occurs in
83
the daytime with a peak at 1500 local time, in contrast to the SBL dominating at
84
nighttime. Seidel et al. (2010) calculated the PBL height by applying seven commonly
85
methods to the profiles of temperature, potential temperature, virtual potential
86
temperature, relative humidity, specific humidity, and refractivity, and found there
87
existed large uncertainties with respect to various methods to estimate PBL height .
88
Then the climatology of the PBL height over Europe and the continental U.S. were
89
compiled using the bulk Richardson number method (Seidel et al. 2012). The same
90
method has also been utilized by Guo et al. (2016b) to develop a radiosonde-based PBL 4
91
height climatology in China, which exhibits large diurnal, seasonal, and spatial
92
variations. This could be at least in part in association with the strong variations in
93
aerosol pollution in China (Guo et al. 2011; Guo et al. 2016c) and atmospheric
94
thermodynamic stability (Tokinaga et al. 2006; Tang et al. 2016). Although the PBL
95
height over China has been well characterized from space-borne lidars (e.g., Liu et al.
96
2015; Zhang et al. 2016) and radiosondes (Guo et al., 2016b), most of other PBL
97
characteristics remain poorly understood, including the thermodynamic stability and its
98
associated meteorological factors.
99
Since 2011, intensive radiosonde observational campaigns at 1400 Beijing time (BJT)
100
in summer (May-June-July-August) have been performed at most sites of the newly-
101
updated L-band China Radiosonde Network (CRN) as operated by the China
102
Meteorological Administration (CMA) (Guo et al. 2016b; Zhang et al. 2016). The
103
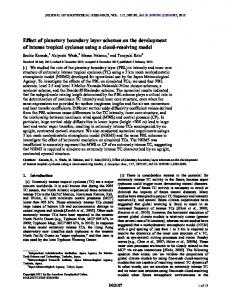
afternoon soundings provide us a unique opportunity to look into the thermodynamic
104
stability of PBL. Thus, one of the main objectives of this study is to unravel the
105
occurrence frequency and spatial distribution of CBL, SBL, and NBL across China
106
using long-term fine-resolution atmospheric soundings. Another objective is to
107
understand the relationships between meteorological variables and PBL height that
108
differs by three PBL types.
109
The rest of the present paper is organized as follows. Section 2 describes the data and
110
method used in this study, as well as the uncertainty analysis for the PBL height
111
retrievals. Section 3 presents the climatology of different PBL types in China, and its
112
association with other atmospheric variables. In section 4, detailed discussions with 5
113
regard to the PBL height climatology and the potential influential factors on the
114
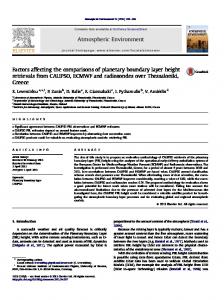
development of PBL will be provided. Finally, the key findings are summarized in
115
section 5.
116
2. Data and Methods
117
2.1 Radiosonde and meteorological data
118
The L-band radiosondes of CRN are conventionally launched twice a day at 0800
119
and 2000 BJT, and additional soundings are made at 1400 BJT in summer (May-June-
120
July-August) at most radiosonde sites mainly for improving the capability of predicting
121
high-impact weather in China. The L-band radiosondes are produced by the Nanjing
122
Daqiao Co. LTD., and the Shanghai Changwang Meotech Co. LTD. (Xu et al. 2007),
123
which provide fine resolution (1s) profiles of temperature, humidity, wind speed and
124
wind direction (Guo et al. 2016b; Zhang et al. 2016). As the previous studies (Tao et al.
125
2006; Xing et al. 2009; Bian et al. 2011; Ma et al. 2011) pointed out, the accuracy of
126
the temperature profiles within lower portion of troposphere is similar to that of GPS
127
RS92 radiosonde (produced by Vaisala), which is less than 0.1 K. Such good data
128
accuracy provides us enough confidence to investigate PBL climatology in China using
129
these L-band soundings of CRN.
130
In this study, the characteristics of afternoon PBL during summer were investigated
131
using the 1400 BJT soundings from 2012 to 2016 collected from CRN, due to most of
132
the exchanges of energy, moisture and air pollutants occurring in the PBL in the
133
afternoon (Garratt 1994; Guo et al. 2016b). Considering the time consistency, the near6
134
surface meteorological observations from the collocated radiosonde sites are used to
135
understand the factors governing the PBL development, including near-surface
136
temperature (Tsfc), near-surface relative humidity (RHsfc), near-surface pressure (Psfc)
137
and 10-m wind speed (WS10). The former three meteorological factors were calculated
138
by taking average over the five lowest consecutive soundings starting from the ground
139
surface, whereas WS10 calculated by taking average over the wind profiles from the
140
second lowest to third lowest soundings.
141
Given the substantial difficulties and uncertainties in determining the PBL types
142
caused by precipitation, the 1400 BJT sounding data have been excluded for the days
143
when precipitation occurred from 1200 BJT to 1400 BJT. Additionally, the sites that
144
have less than 30 valid soundings at 1400 BJT from 2012 to 2016 are not considered.
145
As a result, there are 5399 valid summertime soundings collected from the 92
146
radiosonde sites of CRN at 1400 BJT. The total cloud cover (CLD) data measured at
147
1400 BJT at the same radiosonde sites have been used, in addition to the hourly rain
148
gauge measurements recorded at the hours from 1200 BJT to 1400 BJT.
149
To understand the impacts of land surface processes on the development of PBL in
150
the afternoon, the dataset from Global Land Data Assimilation System (GLDAS, Rodell
151
et al., 2004) were analyzed. The GLDAS contains a series of geophysical parameters
152
reflecting the state of land surface (e.g., soil moisture and surface temperature) and flux
153
(e.g., evaporation and sensible heat flux), based on four land surface models (CLM,
154
Mosaic, Noah and VIC). The surface sensible heat fluxes (SHFsfc) and soil moisture
155
fields in China derived from the Noah model (Chen and Dudhia 2001) were used as 7
156
157
well.
2.2 Determination of PBL type
158
During the daytime, due to the sufficient solar radiation reaching the land surface,
159
the CBL typically dominates over land, which can reach a few kilometers in the
160
afternoon (Chen and Houze 1997). By contrast, when the surface cools by the nocturnal
161
radiation processes, the SBL takes over the bottom portion of the troposphere ( Zhang
162
et al. 2011; Miao et al. 2015b). The residual layer is neutrally stratified, resulting in
163
turbulence that is nearly of equal intensity in all directions ( Sivaraman et al. 2013;
164
Blay-Carreras et al. 2014), referred to as the NBL.
165
Despite the dominance of CBL in the afternoon, the SBL and NBL may form under
166
certain meteorological conditions (Medeiros et al. 2005; Poulos et al. 2002; Stull 1988).
167
The complicated connections between the PBL structure and meteorology make it
168
imperative that the PBL types be determined upfront.
169
Here the determination of PBL types is largely based on the methods developed by
170
Liu and Liang (2010), where the soundings they used are at a vertical resolution of ~5
171
hPa, which is in sharp contrast to the vertical resolution of L-band radiosonde (~1 hPa)
172
to be used in the present study. Therefore, subsample operation in the vertical has been
173
performed by resampling 5 consecutive original 1-hPa measurements to one 5-hPa
174
measurement. As such, a series of coarser-resolution soundings (5-hPa) are derived,
175
and Figure S1 is a case in point. Then, the PBL types were determined by calculating
176
the near-surface potential temperature difference (PTD) between the fifth lowest 8
177
measurement and second lowest measurement. The threshold value of PTD is set to be
178
0.1 K, and the thermodynamic stability of PBL has to be further determined using the
179
bulk Richardson number based on the original lowest 100 m radiosonde measurements.
180
Specifically, if the PTD lies between -0.1 K and 0.1 K, the PBL is identified as NBL; if
181
the PTD is higher than 0.1 K and the bulk Richardson number is positive, the PBL types
182
is identified as SBL; other PBL cases can be considered as CBL (Vogelezang and
183
Holtslag 1996; Eresmaa et al. 2006; Tang et al. 2015).
184
2.3 PBL height estimation and uncertainty analysis
185
The estimation method of PBL height differs by varying PBL types. Similar to Liu
186
and Liang (2010), the PBL height for both CBL and NBL is calculated as the height at
187
which an air parcel rising adiabatically from the surface becomes neutrally buoyant
188
(Stull 1988). Starting from the surface, the height where the gradient of potential
189
temperature firstly becomes greater than a certain gradient threshold (GT) of potential
190
temperature is considered as the estimated PBL height.
191
For the SBL, the determination of the PBL height is much more uncertain.
192
Turbulence in the SBL can result from either buoyancy forcing or wind shear (Bonner
193
1968; Garreaud and Muñoz 2005). If both the stability-derived and wind-shear-derived
194
PBL heights are derived, the lowest of which is estimated to be the PBL heights for
195
SBL (Liu and Liang 2010; Sivaraman 2013). Figure S2 illustrates the typical profiles
196
of CBL, NBL, and SBL, and their corresponding PBL heights are 1650, 721, and 249
197
m above ground level (AGL), respectively. 9
198
To quantify the uncertainties in the estimation of PBL heights, sensitivity analysis
199
by selecting various values of GT has been performed (Argentini et al. 2005). Figures
200
1a-b compared the PBL heights calculated using 3.5 K/km, 4 K/km 4.5 K/km as GT.
201
As expected, the PBL heights of GT = 4.5 K/km (3.5 K/km) are generally higher (lower)
202
than those of GT= 4 K/km. The heights of NBL and CBL based on different GT are
203
significantly correlated with each other (R = 0.98). In contrast, the heights of SBL based
204
on various GT have relatively weaker correlations with each other.
205
We further checked the changes in occurrence frequency of SBL, NBL and CBL
206
caused by the different critical GT values applied. The changes in their corresponding
207
PBL heights were examined as well, which is summarized in Table S1. Overall, the
208
deviation of frequency for SBL, NBL and CBL is less than 13%, and the changes in
209
PBL heights is not more than 177 m, which could make sense for SBL cases. However,
210
the uncertainties can be negligible for NBL and CBL, since most of their PBL heights
211
are much higher.
212
3. Results
213
This section presents the basic climatology of three PBL types (i.e., SBL, NBL, and
214
CBL). Comparisons of radiosonde-based PBL height climatology under different CLD
215
conditions are made to elucidate the impacts of cloud on the development of PBL in the
216
afternoon during the summer. Then we present comprehensive analysis results with
217
regard to the correlations between PBL heights and four typical meteorological
218
variables, including Tsfc, Psfc, RHsfc, and WS10. 10
219
3.1 Climatology of PBL height for various PBL types
220
Figure 2 shows the frequency distribution and cumulative frequency distribution of
221
PBL heights for SBL, NBL, and CBL. At 1400 BJT, 96 % of SBL are lower than 500
222
m, while 83 % (76 %) of CBL (NBL) are higher than 1000 m. On the whole, all PBL
223
heights estimated from soundings are lower than 5 km at 1400 BJT across China.
224
In terms of the numbers of valid soundings at each site at 1400 BJT during summer,
225
the numbers of soundings at 69 sites (about 75%) range from 30 to 60 (Figure 3). In
226
particular, the valid soundings at Beijing (39.80°N, 116.47°E) and Shanghai (31.40°N,
227
121.48°E) are larger than 150. Figures 3b-d presents the spatial distributions of
228
occurrence frequency with respect to CBL, NBL and SBL at 1400 BJT across China,
229
which on average are 70 %, 26 %, and 4 %, respectively. The occurrence frequency of
230
NBL is generally less than 40 % at most sites of CRN. By comparison, the CBL
231
dominates over most sites of CRN.
232
Irrespective of PBL regimes, Figure 4a displays the spatial distribution of mean PBL
233
height at 1400 BJT in China. The averaged PBL height of all sites is 1694 m AGL,
234
indicative of high tendency of well-developed PBL in the afternoon. A prominent north-
235
south PBL height gradient is found, with higher PBL height in northwestern China,
236
which is consistent with spatial pattern revealed by previous PBL studies derived from
237
the Cloud-Aerosol Lidar with Orthogonal Polarization (CALIOP) onboard CALIPSO
238
(Huang et al. 2009; Liu et al. 2015; Zhang et al. 2016). The climatological PBL height
239
in northwest China is generally greater than 1800 m AGL, whereas the values are 11
240
usually less than 1400 m AGL over southeast and coastal areas. The high soil moisture
241
may be one of the causes accounting for the relatively shallower daytime PBL over the
242
east coast (McGrath-Spangler and Denning 2012; Wang and Wang 2014; 2016). In
243
contrast, the low soil moisture in the north and west regions tends to favor the PBL
244
development by partitioning more solar radiation to sensible heat flux (Wang and Wang
245
2014).
246
Figures 4b-d illustrate the spatial distributions of PBL height of SBL, NBL, and CBL.
247
Specifically, Figure 4b shows that the PBL height for SBL is merely 152 ± 100 m AGL
248
(mean value ± standard deviation). However, the values increase sharply to 1656 ± 562
249
m AGL for NBL, and 1803 ± 550 m AGL for CBL (Figures 4c-d). In other words, the
250
mean PBL heights tend to be on average reduced by ~150 m in the presence of NBL as
251
compared with those for CBL. Although the SBL develop more frequently after sunset,
252
which can also be established during the daytime under certain synoptic conditions.
253
To reveal the spatial discrepancy in PBL, we further selected six typical regions of
254
interest (ROIs, defined and shown in Figure S3), including (1) the North China Plain
255
(NCP), (2) the Yangtze River Delta (YRD), (3) the Pearl River Delta (PRD), (4) the
256
Taklamakan Desert (TKD), (5) the Tibetan Plateau (TBP), and (6) the Sichuan Basin
257
(SCB). The occurrence frequency and averaged PBL height of CBL, NBL and SBL at
258
these six ROIs are illustrated in Figure 5 and Table 1. Except for PRD, in which the
259
1400 BJT soundings were only launched in May and June, the 1400 BJT soundings in
260
other ROIs are all launched throughout the whole summer season (June-July-August),.
12
261
Overall, the CBL occurs most frequently in summer (60%), about 2 times higher than
262
the frequency of NBL (less than 30%), let alone the frequency of SBL (less than 10%).
263
Among these six ROIs, the TBP has the highest occurrence frequency of CBL (Figure
264
5), characterized by an averaged PBL height of 2222 m AGL (Table 1). Although both
265
PRD and TKD have similar occurrence frequencies for all the three PBL types, the
266
mean PBL heights are quite different, which are 1067 and 2248 m AGL for PRD and
267
TKD, respectively (Table 1). This large difference in PBL height over PRD and TKD
268
could be relevant to the large discrepancy of RHsfc and SHFsfc. The mean RHsfc over
269
PRD and TKD is 50 % and 22 %, respectively, whereas the mean SHFsfc 113 W/m2 and
270
290 W/m2 at these two ROIs. In the afternoon, less moisture in the PBL of arid TKD is
271
associated often with lower RH and higher SHF, which generally facilitates the
272
development of PBL (Stull 1988; Liu et al. 2004; Dirmeyer et al. 2014). This could be
273
likely the main reason why the high PBL height occurred in TKD rather than in PRD.
274
3.2 The potential impact of cloud on the development of various PBL regimes
275
It is well known that clouds alter the solar radiation reaching the land surface, which
276
further modulates the PBL in the afternoon. Figure 6 shows the mean PBL height and
277
frequency for SBL, NBL, and CBL under different CLD conditions. It is intriguing to
278
note that the PBL height does not change much when CLD ranges from 0 % to 80 %,
279
no matter what the PBL regime is. Only when the CLD becomes higher than 80%,
280
which is referred to as the overcast condition, the PBL height for SBL, NBL and CBL
281
decreases by a certain magnitude. As compared with that under clear-sky condition 13
282
(CLD < 20%), the averaged PBL height at 1400 BJT under overcast condition decreases
283
by ~400 m and ~300 m for NBL and CBL, respectively. In contrast, the depth of SBL
284
keeps almost constant. Relative to PBL under clear-sky condition, the changes in PBL
285
height under partly cloudy condition are less than 170 m for both NBL and CBL regimes
286
(Table S2).
287
Figure 6b shows the occurrence frequency of SBL, NBL, and CBL under different
288
CLD conditions in summer. In general, the occurrence frequency of CBL is higher than
289
40 % under overcast conditions, almost twice the frequency under clear-sky conditions.
290
Similarly, the occurrence frequencies of NBL are ~20 % and ~50 % for the clear-sky
291
and overcast conditions, respectively. For SBL, the occurrence frequency is merely ~10 %
292
under clear-sky conditions, as compared to ~70 % under overcast conditions. Such huge
293
differences existing in the occurrence frequency of CBL, NBL, and SBL suggested that
294
the CLD could play a significant role in modulating the development of PBL. The
295
presence of clouds tends to reduce the solar radiation reaching surface in the afternoon,
296
and thus weaken the vertical turbulent mixing, which in turn suppress the PBL
297
development (Li et al. 2017). Therefore, a reduced PBL height typically ensues (Wetzel
298
et al. 1996; Freedman et al. 2001; Zhou and Geerts 2013).
299
To figure out the spatial distribution of potential cloud influences on CBL, 29
300
radiosonde sites evenly scattered across the China were selected, in which the number
301
of valid CBL sounding is more than 30 for both overcast and clear-sky conditions. As
302
shown in Figure 7, one noticeable feature is that the PBL height under clear-sky
303
condition is systematically lower than that under overcast condition throughout all these 14
304
29 sites, even though the PBL height under both conditions ranges from 800 m to 2600
305
m. On average, the difference of mean PBL height is 336 m, as indicated in Figure 7c.
306
3.3 Relationships between PBL height and meteorological variables
307
In this section, we will analyze the relationships between PBL height and several
308
meteorological parameters, including Tsfc, RHsfc, Psfc, and WS10. To better understand
309
the development of SBL in the afternoon, the meteorological factors for the days with
310
SBL were compared with those with CBL, including CLD, Tsfc, RHsfc, WS10 and SHFsfc.
311
Comparing with the CBL regime, the SBL tends to be formed under the meteorological
312
conditions characterized by relatively high CLD and RHsfc, and low Tsfc, WS10 and
313
SHFsfc (Figure 8).
314
Figure 9 shows the correlation coefficient (R) of PBL height and various
315
meteorological factors in the six ROIs for different PBL regimes, and the gray shaded
316
areas indicate the R values are statistically significant at 95% confidence level.
317
Typically, the PBL height is positively correlated with Tsfc in six ROIs for both NBL
318
and CBL, including the NCP (R = 0.37, 0.25 for NBL and CBL, respectively), YRD (R
319
= 0.55, 0.62), PRD (R = 0.73, 0.66), SCB (R = 0.68 under CBL), and TBP (R = 0.19,
320
0.24), and the lowest correlation (R = 0.02, 0.13) is found in TKD. For SBL, only the
321
correlation of YRD region show here (R = -0.30). More details on the correlations can
322
be found in Table S3.
323
In contrast, negative relationships are observed between the PBL height and RHsfc in
324
summer for NBL and CBL (Figure 9), and the R values are mostly lower than -0.6 15
325
except for those in TKD (R = -0.39 for NBL, -0.51 for CBL) regions. By comparison,
326
the positive correlations (R = 0.36) in TKD between PBL height and RHsfc are found in
327
summer for SBL. For a specific location, the high RHsfc may be associated with high
328
soil moisture and high latent heat flux, which will inhibit the occurrence of convection
329
and turbulence within SBL, and thus lead to a relatively deeper SBL. For CBL and NBL,
330
higher Tsfc and lower RHsfc have been found to be linked to more sensible heat fluxes,
331
favoring the development of PBL during the daytime (Zhang et al. 2013).
332
Besides, the relationships are ubiquitously negative between the PBL height and Psfc
333
in summer for CBL, NBL and SBL. Similar correlation analyses using WS10 show that
334
these parameters are not significantly correlated with PBL height at 1400 BJT in
335
summer.
336
4. Discussions
337
Regarding the large discrepancy in PBL height in PRD and TKD (Figure 5), it is
338
known that PRD is characterized by richer vegetation cover compared with TKD, the
339
relatively strong surface evaporation in PRD can substantially increase the near-surface
340
humidity, and lead to less surface sensible heat flux, which suppress the PBL height
341
over PRD (Zhang et al. 2013; Dirmeyer et al. 2014).
342
In addition to the local-scale atmospheric processes, the large-scale synoptic
343
conditions have been well recognized to be able to govern the development of the PBL
344
(Whiteman and Doran 1993; Garratt 1994; Hoover et al. 2015; Miao et al. 2017). For
345
example, the subsidence associated with the high-pressure systems (e.g., anti-cyclone) 16
346
may suppress the development of PBL, while the large-scale upward motions induced
347
by the low-pressure systems (e.g., fronts, cyclone) would favor the growth of PBL (Stull
348
1988). Specifically, the cold front passage generally comes with CBL, since the strong
349
winds within PBL would favor the development the PBL dynamically. In contrast,
350
sometimes the presence of warm front could facilitate the formation of SBL, since warm
351
air mass behind the front would climb over the local colder air, leading to an increase
352
in atmospheric stability and a suppressed growth in PBL to some extent (Keyser and
353
Anthes 1982; Stull 1988; Sun et al. 2002). Conversely, the stable PBL is also favorable
354
for the low-level stratus cloud formation and maintenance (Lin et al. 2016).
355
Furthermore, clouds (especially under overcast condition) are generally associated
356
with lower PBL height (Figure 6). As shown in Figure 10, compared with the negligible
357
association between CLD and WS10, high CLD was found to be associated with low
358
Tsfc and higher RHsfc (Betts et al. 2017; Garcia-Carreras et al. 2017), which also
359
accompanied with the lower PBL height in the afternoon (Zhang et al. 2013). Although
360
high wind speed is recognized to be positively associated with annual averaged PBL
361
height in the morning or afternoon (Guo et al. 2016b), this positive relation cannot be
362
apparently seen from the afternoon PBL during summer. There may exist complicated
363
coupling effects between the near-surface meteorological factors, CLD, and PBL in the
364
afternoon. For instance, high CLD is often associated with high RHsfc and low PBL
365
height, due to the modulation of surface solar radiation. Meanwhile, the low PBL height
366
may limit the vertical exchange of water vapor between the moister surface layer and
367
upper dryer free troposphere, leading to the relatively high RHsfc (Hohenegger et al. 17
368
2009;Zhou and Geerts 2013).
369
In addition, the soil moisture may be another important factor dictating the
370
development of PBL, since it affects the land surface energy budget (e.g., surface
371
sensible heat flux and latent heat flux). For a specific location, the lower soil moisture
372
generally comes with high surface sensible heat flux, which facilitates the PBL
373
development in the afternoon (McCumber and Pielke 1981; Sanchez-Mejia and Papuga
374
2014; Rihani et al. 2015). As illustrated in Figure S4, the northwest of China is mainly
375
covered by bare land, characterized by low soil moisture, high SHFsfc, high Bowen ratio,
376
and low latent heat flux, all of which favors the development of PBL. On the contrary,
377
the high soil moisture, high latent heat flux, low SHFsfc and low Bowen ratio in the
378
southern China are unfavorable to the development of PBL. Besides, the high latent
379
heat flux tends to favor cloud formation, and the increased clouds will in turn results in
380
reduced surface temperature, increased soil moisture and decreased PBL height (Betts
381
et al. 1996; Eltahir 1998; Pal and Eltahir 2001; Zhou and Geerts 2013). Additionally,
382
the different land covers in the northwest and southeast of China may also play a role
383
in modulating the land surface processes and PBL development. The complex
384
relationships/connections between the land surface properties and PBL in China need
385
more studies in the future.
386
5. Conclusions
387
Based on the 1400 BJT soundings in summer collected from the CMA radiosonde
388
network across China from 2012 to 2016, this study investigated the occurrence
18
389
frequency, spatial distribution of different PBL types (i.e., SBL, NBL, and CBL) in
390
China. Besides, the relationships between the PBL heights and other meteorological
391
variables were examined, including CLD, Tsfc, Psfc, RHsfc and WS10.
392
The occurrence frequency of CBL is about 70 %, followed by 26 % for NBL, and 4 %
393
for SBL. At 1400 BJT, the spatial distributions of PBL heights for NBL and CBL are
394
quite similar, demonstrating a prominent north-south gradient of PBL height. The depth
395
of SBL (152 ± 100m) is generally lower than those of NBL (1656 ± 562 m) and CBL
396
(1803± 550 m). At 1400 BJT, clouds tend to reduce the occurrence frequency of CBL
397
and NBL. In terms of cloud impact on the frequency of SBL, it is found to be merely
398
~10 % under clear-sky conditions, as compared to ~70 % under overcast conditions,
399
indicating that clouds are one of the key factors dictating the frequency of SBL. With
400
the exception of the discernible changes in PBL height under overcast condition relative
401
to the PBL height under clear-sky condition, the PBL height under partly cloudy
402
condition does not change much (less than 170 m) under CBL and NBL regimes. This
403
indicates that high cloud cover could be an important factor modulating PBL
404
development. Besides, the PBL heights of CBL and NBL were found to be positively
405
correlated with the near-surface meteorological factors such as Tsfc, but negatively
406
associated with RHsfc. For a specific location, the low RHsfc usually accompanies with
407
low CLD and low soil moisture, which could favor the development of PBL in the
408
afternoon with high surface sensible heat flux.
409
Although the CBL dominates over China in the summer afternoon, the NBL and SBL
410
could also be established and cannot be overlooked. This study merely investigated the 19
411
afternoon PBL in summer, more efforts should be made to expand the climatology of
412
different PBL types to other seasons in China when more sounding data are available
413
in the future.
414
Acknowledgements
415
This work was supported by the National Natural Science Foundation of China under
416
Grants 41771399, 41705002, 91544217 and 41471301, Ministry of Science and
417
Technology under Grant 2014BAC16B01, and Chinese Academy of Meteorological
418
Sciences under Grants 2017Z005 and 2017Y002. The authors would like to
419
acknowledge Chinese Meteorological Administration for providing the radiosonde
420
dataset. Last, but not least, special thanks go to four anonymous reviewers for their
421
valuable comments and suggestions that helped improve the quality of our manuscript.
20
422
Reference
423
Amenu, G. G., P. Kumar, and X. Z. Liang, 2005: Interannual variability of deep-layer
424
hydrologic memory and mechanisms of its influence on surface energy fluxes. J.
425
Climate, 18(23), 5024-5045, doi:10.1175/JCLI3590.1.
426
Argentini, S., A. Viola, A. Sempreviva, and I. Petenko, 2005: Summer boundary-layer
427
height at the plateau site of Dome’C, Antarctica. Bound. Lay. Meteorol., 115(3), 409-
428
422, doi:10.1007/s10546-004-5643-6.
429
Asimakopoulos, D., C. Helmis, and J. Michopoulos, 2004: Evaluation of SODAR
430
methods for the determination of the atmospheric boundary layer mixing height.
431
Meteorol. Atmos. Phys., 85(1-3), 85-92, doi:10.1007/s00703-003-0036-9.
432
Betts, A. K., A. B. Tawfik, and R. L. Desjardins, 2017: Revisiting hydrometeorology
433
using cloud and climate observations. J. Hydrometeorol., 18(4), 939-955,
434
doi:10.1175/JHM-D-16-0203.1.
435
Betts, A. K., J. H. Ball, A. C. M. Beljaars, M. J. Miller, and P. A. Viterbo, 1996: The
436
land surface-atmosphere interaction: A review based on observational and global
437
modeling perspectives. J. Geophys. Res. Atmos., 101 (D3), 7209–7225,
438
doi:10.1029/95JD02135.
439 440
Beyrich, F., 1997: Mixing height estimation from sodar data - a critical discussion, Atmos. Environ., 31(23), 3941-3953, doi:10.1016/S1352-2310(97)00231-8.
441
Bian, J., H. Chen, H. Vömel, Y. Duan, Y. Xuan, and D. LV, 2011: Intercomparison of
442
humidity and temperature sensors: GTS1, Vaisala RS80, and CFH. Adv. Atmos. Sci.,
443
28, 1, 139-146, doi:10.1007/s00376-010-9170-8.
444
Blay-Carreras, E., D. Pino, J. Vilà-Guerau de Arellano, A. van de Boer, O. De Coster,
445
C. Darbieu, O. Hartogensis, F. Lohou, M. Lothon, and H. Pietersen, 2014: Role of
446
the residual layer and large-scale subsidence on the development and evolution of
447
the convective boundary layer. Atmos. Chem. Phys., 14(9), 4515-4530,
448
doi:10.5194/acp-14-4515-2014.
449 450 451
Bonner, W. D., 1968: Climatology of the low level jet. Mon. Weather Rev, 96(12), 833850, doi:10.1175/1520-0493(1968)0962.0.CO;2. Chan, K. M., and R. Wood, 2013: The seasonal cycle of planetary boundary layer depth 21
452
determined using COSMIC radio occultation data. J. Geophys. Res. Atmos., 118(22),
453
doi:10.1002/2013JD020147.
454
Chen, F., and J. Dudhia, 2001: Coupling an Advanced Land Surface–Hydrology Model
455
with the Penn State–NCAR MM5 Modeling System. Part I: Model Implementation
456
and
457
0493(2001)1292.0.CO;2.
Sensitivity.
Mon.
Weather
Rev.
129,
569-585,
doi:10.1175/1520-
458
Chen, S. S., and R. A. Houze, 1997: Diurnal variation and life ‐ cycle of deep
459
convective systems over the tropical Pacific warm pool. Q. J. Roy. Meteorol. Soc.,
460
123(538), 357-388, doi: 10.1002/qj.49712353806.
461
Coulter, R. L., 1979: A comparison of three methods for measuring mixing-layer height.
462
J.
Appl.
Meteorol.,
18(11),
463
0450(1979)0182.0.CO;2.
1495-1499,
doi:10.1175/1520-
464
Dandou, A., M. Tombrou, K. Schäfer, S. Emeis, A. P. Protonotariou, E. Bossioli, N.
465
Soulakellis, and P. Suppan, 2009, A comparison between modelled and measured
466
mixing-layer height over Munich. Bound. Lay. Meteorol., 131(3), 425-440,
467
doi:10.1007/s10546-009-9373-7.
468
Davy, R., and I. Esau, 2016: Differences in the efficacy of climate forcings explained
469
by variations in atmospheric boundary layer depth. Nat. Commun., 7,
470
doi:10.1038/ncomms11690.
471
Dirmeyer, P. A., Z .Wang, M. J. Mbuh, and H. E. Norton, 2014: Intensified land surface
472
control on boundary layer growth in a changing climate. Geophys. Res. Lett., 41(4),
473
1290-1294, doi:10.1002/2013GL058826.
474
Eresmaa, N., A. Karppinen, S. Joffre, J. Räsänen, and H. Talvitie, 2006: Mixing height
475
determination by ceilometer. Atmos. Chem. Phys., 6(6), 1485-1493, doi:10.5194/acp-
476
6-1485-2006.
477
Eitan, H., K. Ilan, A. Orit, L. Zev and A. Eyal, 2017: Enhanced humidity pockets
478
originating in the mid boundary layer as a mechanism of cloud formation below the
479
lifting condensation level. Environ. Res. Lett., 12(2): 024020. doi:10.1088/1748-
480
9326/aa5ba4.
481 482
Eltahir, E. A., and C. Gong, 1996: Dynamics of wet and dry years in West Africa. J. Climate,
9(5), 22
1030-1042,
483 484 485 486 487
doi:10.1175/15200442(1996)0092.0.CO;2. Eltahir, E. A. B., 1998: A soil moisture–rainfall feedback mechanism. Part I: Theory and observations. Water Resour. Res., 34, 765–776, doi: 10.1029/97WR03499. Esau, I., and S. Zilitinkevich, 2010: On the role of the planetary boundary layer depth in the climate system. Adv. Sci. Res., 4, 63, doi:10.5194/asr-4-63-2010.
488
Freedman, J. M., D. R. Fitzjarrald, K. E. Moore, and R. K. Sakai, 2001: Boundary layer
489
clouds and vegetation-atmosphere feedbacks. J. Climate, 14, 180–197, doi:
490
10.1175/1520-0442(2001)0132.0.CO;2.
491
Fletcher, J., S. Mason, and C. Jakob, 2016: The climatology, meteorology, and boundary
492
layer structure of marine cold air outbreaks in both hemispheres. J. Climate, 29(6),
493
1999-2014, doi: 10.1175/JCLI-D-15-0268.1.
494
Garcia-Carreras, L., J. H. Marsham, and D. V. Spracklen, 2017: Observations of
495
increased cloud cover over irrigated agriculture in an arid environment. J.
496
Hydrometeorol., 18(4), 2161-2172, doi:10.1175/JHM-D-16-0208.1.
497 498 499 500 501
Garratt, J. R., 1992: The Atmospheric Boundary Layer. Cambridge University Press, 316 pp. Garratt, J. R., 1994: Review: the atmospheric boundary layer, Earth Sci. Rev., 37(1-2), 89-134, doi: 10.1016/0012-8252(94)90026-4. Garreaud, R., and R. C. Muñoz, 2005: The low-level jet off the west coast of subtropical
502
South America: Structure and variability. Mon. Weather Rev., 133(8), 2246-2261, doi:
503
10.1175/MWR2972.1.
504
Guo, J., X. Zhang, H. Che, S. Gong, X. An, C. Cao, J. Guang, H. Zhang, Y. Wang, and
505
X. Zhang, 2009: Correlation between PM concentrations and aerosol optical depth
506
in
507
doi:10.1016/j.atmosenv.2009.08.026.
eastern
China.
Atmos.
Environ.
,
43(37),
5876-5886,
508
Guo, J., X. Zhang, Y. Wu, Y. Zhaxi, H. Che, B. La, W. Wang, and X. Li, 2011: Spatio-
509
temporal variation trends of satellite-based aerosol optical depth in China during
510
1980–2008.
511
doi:10.1016/j.atmosenv.2011.03.068.
512
Atmos.
Environ.,
45(37),
6802-6811,
Guo, J., J. He, H. Liu, Y. Miao, H. Liu, and P. Zhai, 2016a: Impact of various emission 23
513
control schemes on air quality using WRF-Chem during APEC China 2014. Atmos.
514
Environ., 140, 311-319, doi:10.1016/j.atmosenv.2016.05.046.
515
Guo, J., Y. Miao, Y. Zhang, H. Liu, Z. Li, W. Zhang, J. He, M. Lou, Y. Yan, L. Bian,
516
and P. Zhai, 2016b: The climatology of planetary boundary layer height in China
517
derived from radiosonde and reanalysis data. Atmos. Chem. Phys., 16(20), 13309-
518
13319, doi:10.5194/acp-16-13309-2016.
519
Guo, J., H. Liu, F. Wang, J. Huang, F. Xia, M. Lou, Y. Wu, H. Jiang, T. Xie, Y. Zhaxi,
520
and L. Yung, 2016c: Three-dimensional structure of aerosol in China: A perspective
521
from
522
doi:10.1016/j.atmosres.2016.05.010.
multi-satellite
observations.
Atmos.
Res.,
178–179,
580–589,
523
Hennemuth, B., and A. Lammert, 2006: Determination of the atmospheric boundary
524
layer height from radiosonde and lidar backscatter. Bound. Lay. Meteorol., 120(1),
525
181-200, doi:10.1007/s10546-005-9035-3.
526
Holzworth, G. C., 1964: Estimates of mean maximum mixing depths in the contiguous
527
United
States.
Mon.
Weather
Rev.,
92(5),
528
0493(1964)0922.3.CO;2.
235-242,
doi:10.1175/1520-
529
Hoover, J. D., D. R. Stauffer, S. J. Richardson, L. Mahrt, B. J. Gaudet, and A. Suarez
530
2015: Submeso motions within the stable boundary layer and their relationships to
531
local indicators and synoptic regime in moderately complex terrain. J. Appl.
532
Meteorol. Clim., 54(2), 352-369, doi:10.1175/JAMC-D-14-0128.1.
533
Hohenegger, C., P. Brockhaus, C. S. Bretherton, and C. Schar, 2009: The soil moisture–
534
precipitation feedback in simulations with explicit and parameterized convection. J.
535
Climate, 22, 5003–5020, doi:10.1175/2009JCLI2604.1.
536
Hu, X., G. Nielsen, John W, and F. Zhang, 2010: Evaluation of three planetary boundary
537
layer schemes in the WRF model. J. Appl. Meteorol. Clim., 49(9), 1831-1844,
538
doi:10.1175/2010JAMC2432.1.
539
Huang, J., Q. Fu, J. Su, Q. Tang, P. Minnis, Y. Hu, Y. Yi, and Q. Zhao, 2009: Taklimakan
540
dust aerosol radiative heating derived from CALIPSO observations using the Fu-
541
Liou radiation model with CERES constraints. Atmos. Chem. Phys., 9, 4011-4021,
542
doi:10.5194/acp-9-4011-2009.
543
Keyser, D., and R. A. Anthes, 1982: The influence of planetary boundary layer physics 24
544
on frontal structure in the Hoskins-Bretherton horizontal shear model. J. Atmos. Sci.,
545
39(8), 1783-1802.
546 547
Lammert, A., and J. Bösenberg, 2006: Determination of the convective boundary-layer height with laser remote sensing. Bound. Lay. Meteorol., 119(1), 159-170.
548
Li Z., J. Guo, A. Ding, H. Liao, J. Liu, Y. Sun, T. Wang, H. Xue, H. Zhang, B. Zhu,
549
2017: Aerosol and boundary-layer interactions and impact on air quality. Natl. Sci.
550
Rev., doi: 10.1093/nsr/nwx117.
551
Lin, Y., Y. Wang, R. Zhang, Y. Liu, 2016: Response of boundary layer clouds to
552
continental pollution during the RACORO campaign. J. Atmo. Sci. 73(9), 3681-3700.
553
Liu, J., J. Huang, B. Chen, T. Zhou, H. Yan, H. Jin, Z. Huang, and B. Zhang, 2015:
554
Comparisons of PBL heights derived from CALIPSO and ECMWF reanalysis data
555
over
556
doi:10.1016/j.jqsrt.2014.10.011.
557
China.
J.
Quant.
Spectrosc.
Radiat.
Transfer,
153,
102-112,
Liu, S., and X.-Z. Liang, 2010: Observed Diurnal Cycle Climatology of Planetary
558
Boundary
Layer
Height.
559
doi:10.1175/2010JCLI3552.1.
J.
Climate,
23(21),
5790-5809,
560
Liu, S., X. Yue, F. Hu, and H. Liu, 2004: Using a Modified Soil-Plant-Atmosphere
561
Scheme (MSPAS) to simulate the interaction between land surface processes and
562
atmospheric boundary layer in semi-arid regions. Adv. Atm. Sci., 21(2), 245-259,
563
doi:10.1007/BF02915711.
564
Mao, M., W. Jiang, J. Gu, C. Xie, and J. Zhou, 2009: Study on the mixed layer,
565
entrainment zone, and cloud feedback based on lidar exploration of Nanjing city.
566
Geophys. Res. Lett., 36(4), doi:10.1029/2008GL036768.
567
Ma Y., W. Yao, and B. Huang, 2011: Comparison of Temperature and Geopotential
568
Height Records Between 59 Type and L-band Radiosonde Systems. J. App. Meteor.
569
Sci., 22(3), 336-345, doi:10.3969/j.issn.1001-7313.2010.02.011.
570
Mccumber, M. C., and R. A. Pielke, 1981: Simulation of the effects of surface fluxes
571
of heat and moisture in a mesoscale numerical model: 1. Soil layer. J. Geophys. Res.
572
Oceans, 86(C10), 9929-9938, doi:10.1029/JC086iC10p09929.
573
McGrath-Spangler, E. L., and A. S. Denning, 2012: Estimates of North American 25
574
summertime planetary boundary layer depths derived from space-borne lidar. J.
575
Geophys. Res. Atmos., 117(D15), doi:10.1029/2012JD017615.
576 577
Medeiros, B., A. Hall, and B. Stevens, 2005: What controls the mean depth of the PBL?. J. Climate, 18(16), 3157-3172, doi:10.1175/JCLI3417.1.
578
Miao, Y., X. Hu, S. Liu, T. Qian, M. Xue, Y. Zheng, and S. Wang, 2015a: Seasonal
579
variation of local atmospheric circulations and boundary layer structure in the
580
Beijing-Tianjin-Hebei region and implications for air quality. J. Adv. Model Earth
581
Sy., 7(4), 1602-1626, doi:10.1002/2015MS000522.
582
Miao, Y., S. Liu, Y. Zheng, S. Wang, Z. Liu, and B. Zhang, 2015b: Numerical study of
583
the effects of planetary boundary layer structure on the pollutant dispersion within
584
built-up areas. J. Environ. Sci., 32, 168-179, doi:10.1016/j.jes.2014.10.025.
585
Miao, Y., J. Guo, S. Liu, H. Liu, Z. Li, W. Zhang, and P. Zhai, 2017: Classification of
586
summertime synoptic patterns in Beijing and their association with boundary layer
587
structure affecting aerosol pollution. Atmos. Chem. Phys., 17, 3097-3110,
588
doi:10.5194/acp-17-3097-2017.
589
Oke, T. R., 2002: Boundary layer climates. Routledge, 435 pp.
590
Pal, J. S., and E. A. B. Eltahir, 2001: Pathways relating soil moisture conditions to future
591
summer rainfall within a model of the land–atmosphere system. J. Climate, 14,
592
1227–1242, doi:10.1175/1520-0442(2001)0142.0.CO;2.
593 594
Paluch, I. R., and D. H. Lenschow, 1991: Stratiform cloud formation in the marine boundary layer. J. Atmos. Sci., 48(19): 2141-2158.
595
Poulos, G. S., W. Blumen, D. C. Fritts, J. K. Lundquist, J. Sun, S. Burns, C. Nappo, R.
596
Banta, T. Newsom, J. Cuxart, E. Terradellas, B. Balsley, and M. Jensen, 2002:
597
CASES-99: A comprehensive investigation of the stable nocturnal boundary layer.
598
B.
599
0477(2002)0832.3.CO;2.
Am.
Meteorol.
Soc.,
83(4),
555-581,
doi:10.1175/1520-
600
Rihani, J. F., F. K. Chow, and R. M. Maxwell, 2015: Isolating effects of terrain and soil
601
moisture heterogeneity on the atmospheric boundary layer: Idealized simulations to
602
diagnose land-atmosphere feedbacks. J. Adv. Model. Earth Sy., 7(2), 915-937,
603
doi:10.1002/2014MS000371.
26
604
Rodell, M., P. R. Houser, U. Jambor, J. Gottschalck, K. Mitchell, C-J. Meng, K.
605
Arsenault, B. Cosgrove, J. Radakovich, M. Bosilovich, J. K. Entin, J. P. Walker, D.
606
Lohmann, and D. Toll, 2004: The Global Land Data Assimilation System. Bull. Am.
607
Meteorol. Soc., 85(3), 381–394, doi:10.1175/BAMS-85-3-381.
608
Sanchez-Mejia, Z. M., and S. A. Papuga, 2014: Observations of a two-layer soil
609
moisture influence on surface energy dynamics and planetary boundary layer
610
characteristics in a semiarid shrubland. Water Resour. Res., 50(1), 306-317,
611
doi:10.1002/2013WR014135.
612
Sherwood, S. C., S. Bony, and J. L. Dufresne, 2014: Spread in model climate sensitivity
613
traced
to
atmospheric
614
doi:10.1038/nature12829.
convective
mixing.
Nature,
505,
37-42,
615
Sun, J., S. P. Burns, D. H. Lenschow, R. Banta, R. Newsom, R. Coulter, S. Frasier,T.
616
Ince, C. Nappo, J. Cuxart, W. Blumen, X. Lee, and X, Z. Hu, 2002: Intermittent
617
turbulence associated with a density current passage in the stable boundary layer.
618
Bound. Lay. Meteorol., 105(2), 199-219, doi:10.1023/A:1019969131774.
619
Sandip, P., and H. Martial, 2015: Forcing mechanisms governing diurnal, seasonal, and
620
interannual variability in the boundary layer depths: Five years of continuous lidar
621
observations over a suburban site near Paris. J. Geophys. Res. Atmos., 120(23),
622
11,936-11,956, doi:10.1002/2015JD023268.
623
Sawyer, V., and Z. Li, 2013: Detection, variations and intercomparison of the planetary
624
boundary layer depth from radiosonde, lidar and infrared spectrometer. Atmos.
625
Environ., 79, 518-528, doi:10.1016/j.atmosenv.2013.07.019.
626
Seibert, P., 2000: Review and intercomparison of operational methods for the
627
determination of the mixing height. Atmos. Environ., 34(7), 1001-1027,
628
doi:10.1016/S1352-2310(99)00349-0.
629
Seidel, D. J., C. O. Ao, and K. Li, 2010: Estimating climatological planetary boundary
630
layer heights from radiosonde observations: Comparison of methods and uncertainty
631
analysis. J. Geophys. Res. Atmos., 115(D16), doi:10.1029/2009JD013680.
632
Seidel, D. J., Y. Zhang, A. Beljaars, J. C. Golaz, A. R. Jacobson, and B. Medeiros, 2012:
633
Climatology of the planetary boundary layer over the continental United States and
634
Europe. J. Geophys. Res. Atmos., 117(D17), doi:10.1029/2012JD018143. 27
635
Sivaraman, C., S. McFarlane, E. Chapman, M. Jensen, T. Toto, S. Liu, and M. Fischer,
636
2013: Planetary Boundary Layer (PBL) Height Value Added Product (VAP):
637
Radiosonde Retrievals. U.S. Department of Energy, Gaithersburg, MD, USA,
638
DOE/SC-ARM-TR-132.
639
Solomon, A., M. D. Shupe, and N. B. Miller, 2017: Cloud–Atmospheric Boundary
640
Layer–Surface Interactions on the Greenland Ice Sheet during the July 2012 Extreme
641
Melt Event. J. Climate, 30(9), 3237-3252, doi:10.1175/JCLI-D-16-0071.1.
642
Steyn, D. G., M. Baldi, and R. Hoff, 1999: The detection of mixed layer depth and
643
entrainment zone thickness from lidar backscatter profiles. J. Atmos. Ocean.
644
Technol.,
645
0426(1999)0162.0.CO;2.
646 647
16(7),
953-959,
doi:10.1175/1520-
Stull, R. B., 1988: An Introduction to Boundary Layer Meteorology, Atmospheric Sciences Library, Dordrecht: Kluwer, PP670.
648
Tao, S., X. Chen, and J. Gong, 2006: Error analyses for temperature of L band
649
radiosonde. Meteor. Monogr, 32, 46-51, doi:10.3969/j.issn.1000-0526.2006.10.007.
650
Tang, G., X. Zhu, B. Hu, J. Xin, L. Wang, C. Münkel, G. Mao, and Y. Wang, 2015:
651
Impact of emission controls on air quality in Beijing during APEC 2014: lidar
652
ceilometer
653
doi:10.5194/acp-15-12667-2015.
observations.
Atmos.
Chem.
Phys.,
15(21),
12667-12680,
654
Tang, G., J. Zhang, X. Zhu, T. Song, C. Münkel, B. Hu, K. Schäfer, Z. Liu, J. Zhang, L.
655
Wang, J. Xin, P. Suppan, and Y. Wang, 2016: Mixing layer height and its implications
656
for air pollution over Beijing. Atmos. Chem. Phys., 16(4), 2459-2475,
657
doi:10.5194/acp-16-2459-2016.
658
Tokinaga, H., Y. Tanimoto, M. Nonaka, B. Taguchi, T. Fukamachi, S. P. Xie, H.
659
Nakamura, T. Watanabe, and I. Yasuda, 2006:
Atmospheric sounding over the
660
winter Kuroshio Extension: Effect of surface stability on atmospheric boundary
661
layer structure. Geophys. Res. Lett., 33(4), doi:10.1029/2005GL025102.
662
Vogelezang, D., and A. Holtslag, 1996: Evaluation and model impacts of alternative
663
boundary-layer height formulations. Bound. Lay. Meteorol., 81(3-4), 245-269,
664
doi:10.1007/BF02430331.
665
Wang, X., and K. Wang, 2016: Homogenized variability of radiosonde-derived 28
666
atmospheric boundary layer height over the global land surface from 1973 to 2014.
667
J. Climate, 29(19), 6893-6908, doi:10.1175/JCLI-D-15-0766.1.
668
Wang, X., and K. Wang, 2014: Estimation of atmospheric mixing layer height from
669
radiosonde data. Atmos. Meas. Tech., 7(6), 1701-1709, doi:10.5194/amt-7-1701-
670
2014.
671
Wetzel, P. J., S. Argentini, and A. Boone, 1996: Role of land surface in controlling
672
daytime cloud amount: Two case studies in the GCIP-SW area. J. Geophys. Res.
673
Atmos., 101, 7359–7370, doi:10.1029/95JD02134.
674 675
Whiteman, C. D., and J. C. Doran (1993). The relationship between overlying synopticscale flows and winds within a valley. J. Appl. Meteorol., 32(11), 1669-1682.
676
Xing Y., Z. Zhang, Y. Cao, Y. Li, H. Wang, X. Li, and S. Ma, 2009: Experiment and
677
Analysis of GPS Radiosonde RS92 Performance. Meteor. Sci. Technol., 37(3), 336-
678
340, doi:10.3969/j.issn.1671-6345.2009.03.014.
679
Xu W., Y. Guo, B. Huang, and S. Gu, 2007: Analysis of GTS Radiosonde Humidity
680
Sensor Testing Data and Correction of Upper-Air Relative Humidity Radiosonde
681
Data.
682
6345.2007.03.025.
Meteorol.
Sci.
Technol.,
35(3),
423-428,
doi:10.3969/j.issn.1671-
683
Zhang, W., M. Augustin, Y. Zhang, Z. Li, H. Xu, D. Liu, Z. Wang, Y. Zhang, Y. Ma,
684
and F. Zhang, 2015: Spatial and temporal variability of aerosol vertical distribution
685
based on lidar observations: A haze case study over Jinhua basin. Adv. Meteorol.,
686
doi:10.1155/2015/349592.
687
Zhang, W., J. Guo, Y. Miao, H. Liu, Y. Zhang, Z. Li, and P. Zhai, 2016: Planetary
688
boundary layer height from CALIOP compared to radiosonde over China. Atmos.
689
Chem. Phys., 16(15), 9951-9963, doi:10.5194/acp-16-9951-2016.
690
Zhang, Y., D. J. Seidel, J. C. Golaz, C. Deser, and R. A. Tomas, 2011: Climatological
691
characteristics of Arctic and Antarctic surface-based inversions. J. Climate, 24(19),
692
5167-5186, doi:10.1175/2011JCLI4004.1.
693
Zhang, Y., D. J. Seidel, and S. Zhang, 2013: Trends in planetary boundary layer height
694
over Europe. J. Climate, 26(24), 10071-10076, doi:10.1175/JCLI-D-13-00108.1.
695
Zhang, Y., L.J. Zhang, J.P. Guo, J.M. Feng, Y. Wang, Q. Zhou, 29
L. X. Li, B. Li, J. He,
696
H.
Xu,
L.
Liu,
N.
An,
H.
Liu,
2017:
697
The climatology of cloud base height from long-
698
term radiosonde measurements in China, Adv. Atmos. Sci., doi: 10.1007/s00376-
699
017-7096-0.
700
Zhang, Y., S. Zhang, C. Huang, K. Huang, Y. Gong, and Q. Gan, 2014: Diurnal
701
variations of the planetary boundary layer height estimated from intensive
702
radiosonde observations over Yichang, China. Sci. China Technol. Sci., 57(11),
703
2172-2176, doi:10.1007/s11431-014-5639-5.
704
Zhou, X., and B. Geerts, 2013: The influence of soil moisture on the planetary boundary
705
layer and on cumulus convection over an isolated mountain. Part I: observations.
706
Mon. Weather Rev., 141(3), 1061-1078, doi: 10.1175/MWR-D-12-00150.1.
30
707
Figure captions:
708
Figure 1. Scatter plots showing (a) PBL heights computed using 4 K/km (in the x-axis)
709
and 4.5 K/km (in the y-axis) as critical potential temperature gradient threshold (GT),
710
and (b) the PBL heights computed using 4 K/km (in the x-axis) and 3.5 K/km (in the y-
711
axis) as critical GT. The results are based on 5399 soundings across China in summer
712
(May-June-July-August) from 2012 to 2016.
713
Figure 2. Frequency distribution (a) and cumulative frequency distribution (b) of PBL
714
heights for SBL (in black), NBL (in red), and CBL (in blue) at 1400 BTJ in summer for
715
the period of 2012-2016. The number of soundings (N) and mean value at each
716
observed time are also given.
717
Figure 3. Spatial distributions of (a) # of soundings from CMA radiosonde sites and
718
the frequency (in percent) for PBL states classified by atmospheric stability: (b) SBL,
719
(c) NBL and (d) CBL at 1400 BJT in summer for the period of 2012-2016, respectively.
720
Figure 4. Spatial distribution of mean PBL height for (a) all types, (b) SBL, (c) NBL,
721
and (d) CBL at 1400 BJT in summer for the period of 2012-2016.
722
Figure 5. The occurrence frequency of SBL, NBL and CBL in six ROIs, including (1)
723
the North China Plain (NCP), (2) the Yangtze River Delta (YRD), (3) the Pearl River
724
Delta (PRD), (4) the Taklamakan Desert (TKD), (5) the Tibetan Plateau (TBP), and (6)
725
the Sichuan Basin (SCB), at 1400 BJT during in summer (May-June-July-August) for
726
the period of 2012 to 2016, respectively. The bars show the frequency of different PBL
727
types (SBL in black, NBL in gray, and CBL in white). The pie charts show the frequency
728
percentage distribution for each month.
729
Figure 6. The bar charts showing the mean PBL height (a) and the occurrence
730
frequency (b) for three PBL types, including SBL (in gray), NBL (in red), and CBL (in
731
blue) under different cloud cover (CLD) conditions (with a bin size of 20%) in summer
732
for the period of 2012-2016. Note that the error bar in (a) denotes the standard deviation
733
of PBL height. 31
734
Figure 7. The spatial distributions of mean PBL heights at 1400 BJT in summer for the
735
period 2012-2016 for CBL days under clear-sky (0 ≤ CLD ≤ 20% (a) and overcast
736
conditions (80%≤CLD≤100% (b). Panel (c) shows the spatial distribution with respect
737
to the differences of PBL heights between clear-sky and overcast conditions.
738
Figure 8. The box plots comparing such meteorological factors as (a) cloud cover
739
(CLD), (b) surface temperature (Tsfc), (c) relative humidity (RHsfc), (d) 10-m wind
740
speed (WS10), and (e) surface sensible heat flux (SHFsfc) between the days with SBL
741
and those with CBL, as averaged over 67 radiosonde sites with valid SBL observations.
742
Figure 9. The correlation coefficient of PBL heights and meteorological parameters in
743
six ROIs under SBL (in black), NBL (in red), and CBL (in blue) conditions. The
744
meteorological variables include surface temperature (Tsfc), surface pressure (Psfc),
745
surface relatively humidity (RHsfc), 10-m wind speed (WS10), V component of 10-m
746
wind speed (WS(V)10), U component of 10-m wind speed (WS(U)10). The gray
747
shadings indicate the correlations are statistically significant at 95% confidence level.
748
Figure 10. The box plots comparing several meteorological factors between clear-sky
749
days and overcast days, including (a) surface temperature (Tsfc), (b) surface relative
750
humidity (RHsfc), (c) 10-m wind speed (WS10), and (d) surface sensible heat flux
751
(SHFsfc). Note that only the radiosonde sites that have more than 30 observations for
752
both clear-sky and overcast days were considered.
32
753
Table list
754
Table 1. The statistics of mean value and standard deviation (sd) of PBL heights (in
755
unites of m AGL) for SBL, NBL and CBL in six ROIs, including (1) the North China
756
Plain (NCP), (2) the Yangtze River Delta (YRD), (3) the Pearl River Delta (PRD), (4)
757
the Taklamakan Desert (TKD), (5) the Tibetan Plateau (TBP), and (6) the Sichuan Basin
758
(SCB) at 1400 BJT in summer (May-June-July-August) for the period of 2012 to 2016. NCP mean (sd)
YRD mean (sd)
PRD mean (sd)
TKD mean (sd)
TBP mean (sd)
SCB mean (sd)
SBL
109(110)
199(184)
174(163)
114(98)
211(197)
-
NBL
1529(712)
1241(455)
999(330)
1982(1020)
2188(752)
1300 (338)
CBL
1703(739)
1297(474)
1067(365)
2248(1004)
2222 (751)
1317(409)
759
33
(a) Critical GT(4 vs. 4.5)
PBL height(m, GT=4.5)
2000
SBL(R=0.73)
1500 1000 500 0
0
5000
NBL(R=0.98)
4000
5000
3000
3000
2000
2000
1000
1000
500 1000 1500 2000 PBL height(m, GT=4)
0
0
CBL(R=0.99)
4000
1000 2000 3000 4000 5000 PBL height(m, GT=4)
0
0
1000 2000 3000 4000 5000 PBL height(m, GT=4)
PBL height(m, GT=3.5)
(b) Critical GT(4 vs. 3.5) 1500
SBL(R=0.92)
1000 500 0
0
760
5000 4000
NBL(R=0.98)
5000 4000
3000
3000
2000
2000
1000
1000
500 1000 1500 PBL height(m, GT=4)
0
0
1000 2000 3000 4000 5000 PBL height(m, GT=4)
0
CBL(R=0.98)
0
1000 2000 3000 4000 5000 PBL height(m, GT=4)
(c) Subsample of radiosonde profile
762
1000
5000
5000
800
4000
4000
600
3000
3000
200
1000
1000
Figure 1. SBL(R=1) Scatter plots showing (a)NBL(R=1) PBL heights computed using 4 K/km (in the x-axis) CBL (R=1) PBL height (m)
761
and 4.5 K/km (in the y-axis) as critical potential temperature gradient threshold (GT), 400 2000 2000
763
and (b) the PBL heights computed0 using 4 K/km (in the x-axis) and 3.5 K/km (in the y0 0
764
axis) as critical GT. The results are based on 5399 soundings across China in summer
765
(May-June-July-August) from 2012 to 2016.
0
200 400 600 800 1000 PBL height(m)
0
1000 2000 3000 4000 5000 PBL height(m)
766
34
0
1000 2000 3000 4000 5000 PBL height(m)
30
(a)
Relative Frequency(%)
Frequency (%)
25
100 SBL (N=217, Mean=152 m) NBL (N=1404, Mean=1656 m) CBL (N=3778, Mean=1803 m)
20 15 10
80
60
40
20
5 0
0 0
767
(b)
1000
2000 3000 4000 PBL height (m)
5000
0
1000
2000 3000 4000 PBL height (m)
5000
768
Figure 2. Frequency distribution (a) and cumulative frequency distribution (b) of PBL
769
heights for SBL (in black), NBL (in red), and CBL (in blue) at 1400 BTJ in summer for
770
the period of 2012-2016. The number of soundings (N) and mean value at each
771
observed time are also given.
35
(a)
(b) 50
Latitude (°N)
Latitude (°N)
50 40 30 150 - 180 120 - 150 90 - 120 60 - 90 30 - 60
20
75
85
40 30 20
95
105
115
125
15% - 20% 10% - 15% 5% - 10% 0% - 5%
75
135
85
(c)
Latitude (°N)
Latitude (°N)
115
125
135
125
135
50
40 30 80% - 100% 60% - 80% 40% - 60% 20% - 40% 0% - 20%
75
772
105
(d)
50
20
95
Longitude (°E)
Longitude (°E)
85
40 30 20
95
105
115
125
135
Longitude (°E)
80% - 100% 60% - 80% 40% - 60% 20% - 40% 0% - 20%
75
85
95
105
115
Longitude (°E)
773
Figure 3. Spatial distributions of (a) # of soundings from CMA radiosonde sites and
774
the frequency (in percent) for PBL states classified by atmospheric stability: (b) SBL,
775
(c) NBL and (d) CBL at 1400 BJT in summer for the period of 2012-2016, respectively.
36
(a)
(b) 50
Latitude (°N)
Latitude (°N)
50 40 30 20
40 30 400 300 200 100 0 -
20
75
85
95
105
115
125
135
75
- 500 - 400 - 300 - 200 100
85
Longitude (°E)
115
125
135 Unit:m
(d) 50
Latitude (°N)
50
Latitude (°N)
105
Longitude (°E)
(c)
40 30
40 30 20
20 75
776
95
85
95
105
115
125
135
75
Longitude (°E)
85
95
105
115
125
135
3000 - 3200 2800 - 3000 2600 - 2800 2400 - 2600 2200 - 2400 2000 - 2200 1800 - 2000 1600 - 1800 1400 - 1600 1200 - 1400 1000 - 1200 800 - 1000 600 - 800 400 - 600 200 - 400 0 - 200
Longitude (°E)
777
Figure 4. Spatial distribution of mean PBL height for (a) all types, (b) SBL, (c) NBL,
778
and (d) CBL at 1400 BJT in summer for the period of 2012-2016.
37
779
100
59
Frequency (%)
80
28
28
N=468 6
44
19
22
N=171
N=433
N=352
7
18
52
47 53
87
N=70
N=691
30
14
49
37 (%)
60
May June July August SBL NBL CBL
40
20
0
780
NCP
YRD
PRD
TKD
TBP
SCB
781
Figure 5. The occurrence frequency of SBL, NBL and CBL in six ROIs, including (1) the North
782
China Plain (NCP), (2) the Yangtze River Delta (YRD), (3) the Pearl River Delta (PRD), (4) the
783
Taklamakan Desert (TKD), (5) the Tibetan Plateau (TBP), and (6) the Sichuan Basin (SCB), at 1400
784
BJT during in summer (May-June-July-August) for the period of 2012 to 2016, respectively. The
785
bars show the frequency of different PBL types (SBL in black, NBL in gray, and CBL in white). The
786
pie charts show the frequency percentage distribution for each month.
38
PBL Height (m)
4000
(a)
SBL NBL CBL
3000 2000 1000 0 0
Frequency(%)
80
20
40
CLD (%)
60
(b)
80
100
80
100
SBL NBL CBL
60 40 20 0 0
20
40
60 CLD (%)
787 788
Figure 6. The bar charts showing the mean PBL height (a) and the occurrence
789
frequency (b) for three PBL types, including SBL (in gray), NBL (in red), and CBL (in
790
blue) under different cloud cover (CLD) conditions (with a bin size of 20%) in summer
791
for the period of 2012-2016. Note that the error bar in (a) denotes the standard deviation
792
of PBL height.
793
794
39
Latitude (°N)
(a) 50
50
40
40
30
30
20
20 75
Unit:m
(b)
85
95
105
115
125
135
75
Longitude (°E)
3000 - 3200 2800 - 3000 2600 - 2800 2400 - 2600 2200 - 2400 2000 - 2200 1800 - 2000 1600 - 1800 1400 - 1600 1200 - 1400 1000 - 1200 800 - 1000 600 - 800 400 - 600 200 - 400 0 - 200
85
95
105
115
125
135
Longitude (°E)
(c)
Latitude (°N)
50
40
1600 - 1800 700 - 800 600 - 700 500 - 600 400 - 500 300 - 400 200 - 300 100 - 200 0 - 100
30
20 75
795
85
95
105
115
125
135
Longitude (°E)
796
Figure 7. The spatial distributions of mean PBL heights at 1400 BJT in summer for the
797
period 2012-2016 for CBL days under clear-sky (0 ≤ CLD ≤ 20% (a) and overcast
798
conditions (80%≤CLD≤100% (b). Panel (c) shows the spatial distribution with respect
799
to the differences of PBL heights between clear-sky and overcast conditions.
800
40
(a) All sites 100
100 40
20
(a) SBL
0
CBL
(b)
500
WS10(m/s)
2
SHFsfc (W/m )
15 10 5
40
0
SBL
600
(d)
60
20
10
20
20
RHsfc (%)
o
40
0
80
30
60
Tsfc ( C)
CLD (%)
80
CBL
(c) SBL
CBL
(e)
400 300 200 100 0
0
SBL
CBL
-100
SBL
CBL
801 802
Figure 8. The box plots comparing such meteorological factors as (a) cloud cover
803
(CLD), (b) surface temperature (Tsfc), (c) relative humidity (RHsfc), (d) 10-m wind
804
speed (WS10), and (e) surface sensible heat flux (SHFsfc) between the days with SBL
805
and those with CBL, as averaged over 67 radiosonde sites with valid SBL observations.
41
R
0.8 (c)PRD 0.4 0.0 -0.4 -0.8
0.8 (d)TKD 0.4 0.0 -0.4 -0.8
0.8 (e)TBP 0.4 0.0 -0.4 -0.8 Tsfc
0.8 (f)SCB 0.4 0.0 -0.4 -0.8 Tsfc WS(V)10WS(U)10
R
0.8 (b)YRD 0.4 0.0 -0.4 -0.8
R
SBL 0.8 (a)NCP 0.4 0.0 -0.4 -0.8
806
Psfc
RHsfc WS10
Psfc
NBL
CBL
RHsfc WS WS(V) WS(U)10 10 10
807
Figure 9. The correlation coefficient of PBL heights and meteorological parameters in
808
six ROIs under SBL (in black), NBL (in red), and CBL (in blue) conditions. The
809
meteorological variables include surface temperature (Tsfc), surface pressure (Psfc),
810
surface relatively humidity (RHsfc), 10-m wind speed (WS10), V component of 10-m
811
wind speed (WS(V)10), U component of 10-m wind speed (WS(U)10). The gray
812
shadings indicate the correlations are statistically significant at 95% confidence level.
42
40
100
(a)
80 RHsfc (%)
o
Tsfc ( C)
30 20
40 20
Clear-sky
Clear-sky
Overcast
Clear-sky
Overcast
(d)
400
2
SHFsfc (W/m )
WS10(m/s)
500
(c)
10 5 0
0
Overcast
15
813
60
10 0 20
(b)
300 200 100 0
Clear-sky
Overcast
814
Figure 10. The box plots comparing several meteorological factors between clear-sky
815
days and overcast days, including (a) surface temperature (Tsfc), (b) surface relative
816
humidity (RHsfc), (c) 10-m wind speed (WS10), and (d) surface sensible heat flux
817
(SHFsfc). Note that only the radiosonde sites that have more than 30 observations for
818
both clear-sky and overcast days were considered.
819
43