Cent. Eur. J. Phys. • 7(2) • 2009 • 321-326 DOI: 10.2478/s11534-009-0021-0
Central European Journal of Physics
On the topographic and optical properties of SiC/SiO2 surfaces Research Article
Stanislav Jureˇcka1∗ , Mária Jureˇcková2 , Ferdinand Chovanec3 , Hikaru Kobayashi5 , Masao Takahashi4 , Milan Mikula5 , Emil Pinˇcík6 1 DEF FEI Žilina University, Nálepku 1390, 03101 Liptovský Mikuláš, Slovakia 2 Mathematical Institute SAS, Štefánikova 49, 814 73 Bratislava, Slovakia 3 Academy of Armed Forces of Gen. M. R. Štefánik, Demänová 393, 031 01 Liptovský Mikuláš, Slovakia 4 DFCM ISIR Osaka University, Mihogaoka 8-1, Ibaraki, Osaka 587-0047, Japan 5 FCFT, Slovak University of Technology, Radlinského 9, 812 37 Bratislava, Slovakia 6 Institute of Physics SAS, Dúbravská cesta 9, 84511 Bratislava, Slovakia
Received 30 November 2008; accepted 16 February 2009
Abstract:
The roughness of the semiconductor surface substantially influences properties of the whole structure, especially when thin films are created. In our work 3C SiC, 4H SiC and Si/a-SiC:H/SiO2 structures treated by various oxidation a passivation procedures are studied by atomic force microscopy (AFM) and scanning tunnelling microscopy (STM). Surface roughness properties are studied by fractal geometry methods. The complexity of the analysed surface is sensitive to the oxidation and passivation steps and the proposed fractal complexity measure values enable quantification of the fine surface changes. We also determined the optical properties of oxidized and passivated samples by using visual modelling and stochastic optimization.
PACS (2008): 07.79.Cz; 07.79.Lh; 61.72.Cc; 61.82.Fk; 68.55.ag Keywords:
SiC • interface roughness • multifractal systems • AFM, STM • optical properties © Versita Warsaw and Springer-Verlag Berlin Heidelberg.
1.
Introduction
Silicon carbide has excellent physical properties - high thermal conductivity, high breakdown voltage, high saturated electron drift mobility, wide band-gap, etc. It crystallizes in more than 200 different types of lattice struc∗
E-mail:
[email protected]
ture. The most important are 3C SiC with a cubic unit cell and 4H SiC with a hexagonal unit cell structure. SiC is much more chemically stable compared to Si and therefore a higher temperature (above 1100°C) is necessary for conventional thermal oxidation [1–3]. Carbon clusters are formed at the SiC/SiO2 interfaces during this high temperature oxidation and they strongly influence the interface state density, which is greater than one order of magnitude higher than in Si [3–5]. High temperature oxidation degrades the interfacial and surface properties, the sur321
On the topographic and optical properties of SiC/SiO2 surfaces
faces are roughened considerably. The quality of surface can be improved by heat treatment in pure hydrogen at 400°C [6]. For low temperature oxidation of SiC a plasma oxidation method was developed [7]. Thick SiO2 layers on SiC can also be formed by applying a two-step nitric acid oxidation of SiC (NAOS) consisting of a simple immersion in ∼40 wt% HNO3 aqueous solution followed by immersion in 68 wt% HNO3 [8–10]. As well as the hydrogen plasma treatment several other defect passivation methods have been developed (forming gas annealing, deposition of silicon nitride layers, wet chemical passivation, etc.). In the present study the hydrogen plasma treatment passivation was applied to the 3C SiC and 4H SiC surfaces. The a-SiC:H/SiO2 layers formed by the NAOS method were passivated by a cyanide treatment under various experimental conditions [11–14]. We studied changes of the surface roughness during these oxidation and passivation procedures and measured surface properties were used for the optical parameter determination.
2.
Experimental
3C SiC and 4H SiC wafers were cleaned by the RCA method and etched with diluted hydrofluoric acid to remove any possible native oxide layers. The SiC wafers were then heated in a pure hydrogen atmosphere at 400°C for 20 min. AFM measurements were performed in a tapping mode with a KEYENCE VN-800 microscope. The a-SiC:H samples were cleaned by the RCA method, etched with diluted HF (10%), oxidized by the NAOS method, annealed in forming gas and passivated by the CN method [11]. Various oxidation and passivation conditions were used to obtain SiO2 layers with different properties as can be seen in Tab. 1. An x-ray photoelectron spectroscopy (XPS) measurement was performed using a VG Scientific Escalab 220i-XL spectrometer with a monochromatic Al Ka source. Photoelectrons were collected in the surface-normal direction. The XPS spectra were measured in order to survey the Si 2p region. The electron escape depth of Si 2p photoelectrons in the Si and SiO2 layer was used to determine the thickness of thin oxide layer. The spectral reflectance was measured by the Avantes AvaSpec 2048 spectrometer in the wavelength region 400700 nm. To determine the optical properties of the aSiC:H/SiO2 samples we used a numerical method based on visual modelling of the spectral reflectance function followed by the stochastic optimization of this initial estimation by the genetic algorithm (VIMSO) [15]. The structural model of the multilayer system in this method contains information about the surface roughness properties. 322
Table 1.
Intervals of the oxidation and passivation procedures applied to a-SiC:H samples.
series
N1
N3
N5
code
NAOS
CN
n1as
30 min.
-
n1c3
30 min.
3 min.
n1ch
30 min.
30 min.
n3as
180 min.
-
n3c3
180 min.
3 min.
n3ch
180 min.
30 min.
n5as
300 min.
-
n5ch
300 min.
30 min.
Surface properties of a-SiC:H/SiO2 samples were also studied by the STM method in the constant current mode. In this method the tip-surface separation is controlled during the surface scanning by the feedback loop system in order to keep the tunneling current constant. Real semiconductor surfaces measured by the AFM and STM methods obviously contain a large variety of surface objects. The complexity of the rough surface shapes leads to such surfaces often being viewed as a realization of a random process and described by a wide range of roughness scales. The existence of various scales could change the dimension of the surface and its statistical properties. The basic concept to describe the rough surface is the fractal dimension [16, 17]. The complex character of the rough semiconductor surface is often described by more than one fractal dimension. The rough surface usually does not exhibit a form of purely self-similar fractal, the self-similarity is local only. Concentrations of large surface irregularities often occur in a few regions and concentrations of small irregularities in many regions. The more suitable method to describe the real semiconductor surface properties is therefore multifractal analysis. In this study we used the multifractal singularity spectrum function. f(α), to describe the development of the surface fractal properties after the oxidation and passivation procedures. The method used for computing the f(α) spectrum was developed by Chhabra and Jensen [18]. The multifractal analysis describes the statistical properties of the surface in terms of the distribution of the f(α) spectrum corresponding to its singularity strength, α: N X µi (q, δ) log µi (q, δ)
f(q) = lim
δ→0
indexed with exponent
i=1
log δ
(1)
Stanislav Jureˇcka, Mária Jureˇcková, Ferdinand Chovanec, Hikaru Kobayashi, Masao Takahashi, Milan Mikula, Emil Pinˇcík
N X µi (q, δ) log Pi (q, δ)
α(q) = lim
i=1
δ→0
.
log δ
(2)
Function µi (q, δ) in Eqs. (1) and (2) is a one-parameter family of normalized measure, computed from the probability of finding of i-th fragment of the analysed fractal surface region. This probability is defined by the formula Pi (δ) = Ai (δ)/AT (δ), where Ai (δ) is the area in an i−th box with δ scale and AT (δ) is the total area measured in δ scale. The fractal dimension is computed by the formula N P
log DF q
1 = lim q − 1 q→0
i=1
b)
c)
d)
[Pi (δ)]q
log δ
,
(3)
where q ∈ (−∞, ∞), N is total number of boxes necessary for covering AT . We also analysed the development of the lacunarity Λ, which is strongly correlated to the changes in the distribution of the undistorted areas on the fractal surface structures [19]. It quantifies deviations from the translational and rotational invariance of gap areas by describing the distribution of gaps within a set of multiple scales. Fractal dimension and lacunarity are complementary, surfaces with identical fractal dimensions can be distinguished by their lacunarity and vice versa. In this work lacunarity is computed by the regular box counting technique [20]. For the description of the particle size distribution development during the oxidation and passivation procedures we used granularity density function G. The particle size distribution can be extracted from the AFM and STM images by counting the number of pixels corresponding to the morphological structuring elements at the surface. In this study the G values were computed by using particle segmentation based on the binary thresholding technique [21].
3.
a)
Results and discussion
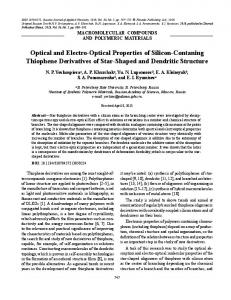
Fig. 1 shows typical AFM images of the 3C SiC and 4H SiC surfaces used in the study of hydrogen treatment. We analysed a large set of experimental structures (more than 100 measurements) and we studied surface structures at various resolutions of the AFM microscope. We observed relatively rough, grainy and lamellar structures of studied sample surfaces as can be seen in Fig. 1. We studied the development of the surface structure after applying the hydrogenization procedure. In order to avoid the tip curvature corruption we checked the AFM probes by the optical microscope and we performed the AFM scans in the semicontact mode. We did not observe
Figure 1.
Typical surfaces of 3C SiC and 4H SiC samples measured by the AFM: a) 3C SiC rough surface, b) 4H SiC with grainy structure, c) 3C SiC with lamellar structure, d) 4H SiC grainy structure after the hydrogen plasma passivation. Surface area is 100×100 µm.
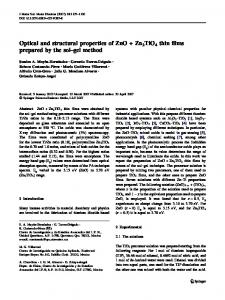
any assymetry of the surface species due to change in the scanning direction and we used low scanning frequencies to avoid data corruption by the measuring system vibrations. Results of the multifractal analysis of sample surface properties are in Fig. 2. Fig. 2i shows the development of the multifractal singularity spectra, f(α), during hydrogen passivation. From the asymmetry of the f(α) curve we can see that the degree of multifractality decreases after the passivation procedure. Some fractal objects diminish and the surface object shapes become less complex. Multifractal features of studied surfaces remain after the passivation. This result is also proved by the analysis of Dq curves behaviour [22]. We also compared experimental f(α) curves with theoretical singularity spectra, obtained by computer simulation of surface structure based on Cantor numbers properties. Cantor numbers are known to have multifractal characteristics [23]. These results (Dq curves and Cantor surfaces) are not included in this paper. Fig. 2ii shows the development of the fractal dimension probability P(DF ) of the SiC surfaces. The peaks at the fractal dimension probability curve can be associated with the existence of fractal objects with corresponding dimensionality DF and indicate the existence of texture at the surface. Objects created at the surfaces after hydrogen passivation have a higher dimensionality, DF , type of surface texture (grainy or lamellar), which is preserved. In Fig. 2iii we observe the development of the particle size distribution at given surfaces. After the hydrogen passivation treatment the fraction of smaller sized 323
On the topographic and optical properties of SiC/SiO2 surfaces
objects is suppressed and objects of larger size are created. Fig. 3 shows results of multifractal analysis of AFM topography of a-SiC:H/SiO2 samples. Asymmetry of the multifractal singularity spectrum in Fig. 3a indicates decreasing complexity of the NAOS oxidized and CN passivated surfaces. The surface structure is simpler, some of the surface objects are suppressed. Fig. 3b shows the development of the fractal object dimensions during oxidation and passivation. With a prolonged oxidation procedure fractal objects with smaller dimensions are created. With a prolonged CN procedure the multifractality of the structure increases again. The NAOS oxidation procedure simplifies the shapes of the surface objects and the CN passivation procedure on the other hand intensively modifies the surface objects and increases the complexity of given surface.
i)
Fig. 4 shows results of multifractal analysis of STM topography of a-SiC:H/SiO2 samples. The multifractal singularity spectrum in Fig. 4a shows increasing complexity of the NAOS oxidized and CN passivated surfaces. Now we observe the electrical properties of a given structure. The most intensive influence on the electrical properties described by the multifractal spectra is the prolonging of the CN passivation procedure. During the CN passivation the newly created Si-CN bonds occur preferentially in areas of relatively complicated shapes. Multifractal spectrum curves sensitively detect an increase of the surface shape complexity. With the prolonging of oxidation and passivation procedures the size of electrically active areas increases and the dominance of small size objects vanishes as can be observed in Fig. 4b. These areas are therefore slightly larger and have more complicated structure.
ii)
Fractal lacunarity values, Λ, are correlated with the amount of undisturbed areas at a given surface. Development of lacunarity values determined from the STM measurements of a-SiC:H/SiO2 samples can be seen in Tab. 2. With prolonging of the NAOS oxidation procedure lacunarity decreases. The size of undistorted areas is systematically reduced. The oxidation procedure intensively modifies the electrical properties of a given structure. With the prolonging of the CN passivation procedure lacunarity of a given surface increases. We can conclude that the surface areas that influence the tunnelling current systematically increase their size in this case. Longer CN passivation causes creation of larger areas with homogeneous electrical properties. These areas are depicted in STM images by more flat shapes. Statistical characteristics of the interface roughness and the thickness of oxide layer obtained from XPS spectra were inserted into the construction of the structural model for the calculation of the optical parameters of a324
iii)
Figure 2.
Results of multifractal analysis of 3C SiC and 4H SiC: i) multifractal spectrum, ii) detail of probability distribution of fractal dimension, iii) granularity density function, a) 3C SiC before hydrogenation, b) 4H SiC before hydrogenation, c) 3C SiC after hydrogenation, d) 4H SiC after hydrogenation.
Stanislav Jureˇcka, Mária Jureˇcková, Ferdinand Chovanec, Hikaru Kobayashi, Masao Takahashi, Milan Mikula, Emil Pinˇcík
a)
a)
b)
b)
Figure 3.
Results of multifractal analysis of a-SiC:H/SiO2 AFM topography: a) multifractal singularity spectrum, b) detail of probability distribution of fractal dimension. Ref denotes RCA cleaned wafer without the oxide layer.
Figure 4.
4. SiC:H/SiO2 samples. The thicknesses of SiO2 layers estimated by XPS measurements ranged from ∼2 nm for the N1 series and increased to ∼5 nm for the N5 series.
The reconstructed spectral dependence of the refractive index of the N5 sample series is in Fig. 5. Similar behaviour (decreasing trend of refractive indices with prolonging of passivation procedure) was observed for all of the above mentioned sample series. The creation of Si-CN bonds influences the photon absorption processes by the passivated structure resulting in decreasing of n values.
Results of multifractal analysis of a-SiC:H/SiO2 STM topography: a) multifractal spectrum, b) detail of granularity density function. Ref denotes RCA cleaned wafer without the oxide layer.
Conclusion
We studied the influence of oxidation and passivation procedures on the surface topography and electrical properties, determined by the AFM and STM methods. For the description of the development of the surface structures we used fractal geometry methods. The multifractal analysis methods provide useful information concerning the structural and electrical property changes during the oxidation and passivation processes. The connection between the fractality of the surface and the physical properties of the given structure, however, has to be studied more deeply in the future. We suppose that information about fractal behaviour of the surface structures can be useful for un325
On the topographic and optical properties of SiC/SiO2 surfaces
Table 2.
Development of lacunarity Λ values during NAOS oxidation and CN passivation of a-SiC:H/SiO2 structures.
Λ sample series
without CN
CN 30 min.
N1
81.55
133.61
N3
34.91
37.32
N5
14.51
39.79
Figure 5.
Refractive index of N5 series of a-SiC:H/SiO2 determined by the VIMSO method.
derstanding the development of the defect states at the surfaces [24, 25].
Acknowledgements This work was supported in part by the Slovak grant agency under grant APVV-0577-07, VEGA 2/7120/27, VEGA 1/0539/08, Japan grant agency grant JSPS/RCI2/06248 and AGA-01-2008 of MoD Slovak grant agency. Author would like to express many thanks to Mr. Mohammad Madani, ISIR, Osaka University, Japan, for the samples preparation and performing the AFM experiment.
References [1] H. Kobayashi, T. Sakurai, M. Takahashi, Y. Nishioka, Phys. Rev. B 67, 115305 (2003) [2] K. C. Chang, L. M. Porter, J. Bentley, C. Y. La, J. Cooper Jr., J. Appl. Phys. 95, 8252 (2004) [3] S. Hazza, S. Chakraborty, P. T. Lai, Appl. Phys. Lett. 85, 5580 (2004) [4] K. Christiansen, M. Bassler, T. Dalibor, R. Helbig, Mater. Sci. Eng. B61/62, 485 (1999) 326
[5] T. Kimoto, Y. Kanzaki, M. Noborio, H. Kawano, H. Matsunami, Jpn. J. Appl. Phys 44, 1213 (2005) [6] S.-S Im, S. Terakawa, H. Iwasa, H. Kobayashi, Appl. Surf. Sci. 254, 3667 (2008) [7] M. Satoh, H. Shimada, T. Nakamura, S. Yanagihara, Jpn. J. Appl. Phys. 41, 1233 (2002) [8] A. Asuha, S. Imai, M. Takahashi, H. Kobayashi, Appl. Phys. Lett. 85, 3783 (2004) [9] A. Asuha et al., Surf. Sci 600, 2523 (2006) [10] S. Imai, M. Fujimoto, A. Asuha, M. Takahashi, H. Kobayashi, Surf. Sci. 600, 547 (2006) [11] H. Kobayashi, S. Tachibana, K. Yamanaka, Y. Nakato, K. Yoneda, J. Apl. Phys 81, 7630 (1997) [12] A. Asano, A. Asuha, O. Maida, Y. Todokoro, H. Kobayashi, Appl. Phys. Lett. 80, 4552 (2002) [13] H. Kobayashi, Y. Kasama, T. Fujinaga, M. Takahashi, H. Koinuma, Solid State Commun. 123, 151 (2002) [14] N. Fujiwara et al., Appl. Surf. Sci. 235, 372 (2004) [15] S. Jureˇcka, E. Pinˇcík, R. Brunner, Appl. Surf. Sci. 254, 3672 (2008) [16] B. B. Mandelbrot, The fractal of nature (Freeman, New York, 1982) [17] J.-F. Gouyet, Physics and fractal structures (SpringerVerlag, New York, 1996) [18] A. Chhabra, R. V. Jensen, Phys. Rev. Lett. 62, 1327 (1989) [19] R. E. Plotnick, R. H. Gardner, W. W. Hargrove, K. Prestegaard, M. Perlmutter, Phys. Rev. E. 53, 5461 (1996) [20] C. Allain, M. Cloitre, Phys. Rev. A 44, 3552 (1991) [21] K. R. Castleman, Digital image processing (PrenticeHall, New Jersey, 1996) [22] S. Stach, J. Cybo, J. Chmiela, Mater. Charact. 26, 163 (2001) [23] T. C. Halsley, M. H. Jensen, L. P. Kadanoff, I. Procaccia, B. I. Shraiman, Phys. Rev. A 33, 1141 (1986) [24] P. Bury, P. Hockicko, V. W. Rampton, Acta Phys. Slovaca 53, 189 (2003) [25] E. Pincik et al., Proc. SPIE 5574, 481 (2004)