build a Site-Specific Forecast Model (SSFM) using a one-dimensional version of the Met. Office Unified .... the surface temperature (Deardorff, 1978; Best, 1998). In practice, this ... mechanism available to treat the settling of fog drop- lets. In practice .... a factor of 2.4 increase in geostrophic drag coefficient). It should be noted ...
Meteorol. Appl. 8, 279–286 (2001)
One-dimensional site-specific forecasting of radiation fog. Part I: Model formulation and idealised sensitivity studies P A Clark and W P Hopwood, The Met. Office, London Road, Bracknell, Berkshire RG12 2SZ, UK
The Met. Office currently operates a high resolution mesoscale model that provides guidance on the likely formation of radiation fog on the spatial scale of 30–40 km. A project has been under way to build a Site-Specific Forecast Model (SSFM) using a one-dimensional version of the Met. Office Unified Model as a basis, with suitable modifications to its surface treatment driven by output from threedimensional NWP models. The SSFM has been applied to the forecasting of radiation fog as part of the European Commission sponsored project 4MIDaBLE (4Dimensional Met. Information DataBase Linked across Europe). The first part of this paper describes the model formulation and discusses its behaviour simulating radiation fog in idealised cases and its sensitivity to geostrophic wind speed and initial humidity. In addition to the expected sensitivity to wind and humidity, it has been found that the treatment of surface exchange processes can have a small but significant impact on the formation of fog, its formation and clearance times and its depth.
1. Introduction The Met. Office in the UK has run an operational mesoscale model for a number of years in order to provide direct numerical forecasts of weather parameters, particularly precipitation, wind, temperatures, cloud, fog and visibility. Since December 1992 the operational mesoscale model has been a configuration of the Met. Office’s Unified Model (UM) system. This system is designed to bring all scales of numerical weather prediction under the same framework in order to take advantage of the commonality between models. Fog forecasts are a product unique to mesoscale forecast models, and so required particular attention. The model currently runs with a grid size of 0.15° × 0.15° (about 16.7 km × 16.7 km) and has been producing useful operational fog forecasts since September 1993. Given the relatively coarse resolution of the model when compared with fog-related phenomena, it can only give regional guidance, and that only in terms of a ‘fog probability’. For very short range forecasting (0–6 h) at higher resolution (5 km) the Met. Office has developed the Nimrod system, which makes use of a higher-resolution analysis in combination with the mesoscale model. The fog and visibility component of this is described by Wright & Thomas (1998). It is not, however, feasible to run the mesoscale model operationally at sufficiently high resolution in either the vertical or horizontal to provide accurate small-scale forecasts for any significant period into the future. Work is therefore under way to develop a Site-Specific Forecast Model (SSFM) which is a one-dimensional model
embedded in the mesoscale model. This will have high vertical resolution and will be used to give more sitespecific forecast guidance. The use of one-dimensional models for fog forecasting is not a new idea, for example see Musson-Genon (1987) and Bergot & Guedalia (1994). However, these models were developed as specific forecasting tools with their parametrisation schemes, particularly turbulence and longwave radiation, adapted for strong stable stratification and high spectral resolution respectively. This paper describes briefly those aspects of the formulation of the UM physics which have most bearing on the formation, development and dissipation of fog. The behaviour of the SSFM in idealised conditions is then presented in order to demonstrate the main sensitivities. The behaviour of the model in real events (driven by mesoscale forecasts) and the impact of initial observations will be discussed in part II.
2. The Met. Office Unified Model 2.1. Overview The Met. Office UM brings together atmospheric, slab ocean and deep ocean models under one framework (Cullen, 1993). At present all atmospheric configurations are based around the same model. This is a gridpoint model solving hydrostatic dynamics on a horizontal latitude/longitude grid. When only a limited area of the globe is covered the grid is rotated so that the equator runs through the model area, minimising the distortion of the grid that occurs near the poles.
279
P A Clark and W P Hopwood Limited area configurations must be run embedded in larger area models to provide boundary conditions. Operationally, the Met. Office runs a global model with resolution 1.25o × 0.83o, and within this a limited area model with resolution 0.442o × 0.442o (approximately 45 km) covering the eastern USA to western Europe. For this study it was this model that provided the boundary conditions for the mesoscale model which has a horizontal resolution of 0.15o × 0.15o (approximately 16.7 km). This means that major upland regions of the UK, such as the Pennines, are well resolved and some of the topographic features which lead to prevalence for fog, such as the Vale of York, are resolved to some extent, but the resolution of fine-scale local orographic features is minimal. This clearly has considerable bearing both on the accuracy of forecasts and on their presentation. A hybrid vertical coordinate system is used. At upper levels there are considerable advantages to using pressure as the independent variable, while near the surface a terrain-following coordinate such as σ (i.e. pressure/ surface pressure) has obvious advantages. The UM uses a generalised linear combination of pressure and σ. Near the surface pure ? coordinates are used. At the top of the model, pure pressure coordinates are used. An analysis correction scheme is used to assimilate data into the model (Lorenc, 1988). The mesoscale model differs from coarser configurations in that substantially more observation types are used. In particular, assimilation of screen observations of both temperature and relative humidity improve performance substantially. For cloud, a separate subsystem, the Moisture Observation Preprocessing System (Macpherson et al., 1996), is used to derive an objective cloud analysis using satellite observations, weather radar and surface observations. This has only minor direct impact in fog cases, although, of course, the correct representation of cloud above any fog layers is essential.
2.2. Model physics The SSFM comprises all of the ‘physics’ subroutines that are used to represent diabatic processes in the full model: boundary layer mixing, surface exchange, longwave and shortwave radiation, cloud diagnosis, largescale precipitation and convection. In addition, we must provide some dynamical forcing for the model. The aspects of the model physics important for fog processes will be described briefly below, together with (small) changes that have been made to attempt to improve the simulation of near surface processes.
(a) Boundary layer The boundary layer is treated using a first order scheme which models fluxes between layers in terms of mixing lengths, the vertical gradient of wind velocity and the local stability measured in terms of the local bulk Richardson number. Mixing lengths are taken to be
280
functions of height, surface roughness length and asymptotic neutral mixing lengths proportional to the boundary layer depth (except in very shallow boundary layers). The scheme is described in detail in Appendix A.
(b) Surface exchange The surface energy and moisture budget, and the surface stress, are of great importance in the formation of fog. Within the UM, the exchange of heat, moisture and momentum between the surface and bottom level of the atmosphere in the model is treated using a conventional drag coefficient approach. The other aspect of the surface energy balance, the soil system, is treated in the UM by a straightforward four-layer heat transfer soil model. Soil moisture is currently treated using a single-layer scheme with a canopy reservoir, and resistance to evaporation from the surface is treated very simply using a fixed resistance. However, in this study a new more sophisticated scheme prior to its inclusion within the UM was employed. This scheme was MOSES I (Met. Office Surface Exchange Scheme), a Penman-Monteith surface exchange scheme implementing multi-layer hydrology with soil moisture freezing and an interactive vegetation model. This scheme was also extended to allow it to become multi-‘tiled’. The scheme is fully described in Cox et al. (1999) but a brief summary can be found in Appendix B. The form of the equations outlined in Appendix B ensures that as the Richardson number becomes very large (very stable) the transfer coefficients decrease but never become zero. This is regarded as desirable behaviour in large model gridboxes, but may be unrealistic locally, and so may result in unrealistically high downward heat and moisture fluxes. For this reason, for the purposes of local simulation we have modified the formulation to leave a conventional scheme derived directly from Monin-Obukhov theory, which does allow a cutoff in turbulent fluxes to occur in sufficiently stable conditions. The modified formulation uses surface transfer coefficients based upon MoninObukhov similarity using Businger-Dyer functions (Dyer, 1974) for unstable and the stable stability function recommended by Beljaars & Holtslag (1991). Comparisons of the parametrisation of surface temperature within the surface exchange scheme with observations over a grass surface at the Meteorological Research Unit (MRU), Cardington (see Best, 1998), have shown that the existing surface exchange scheme does not cool to a great enough degree during nocturnal conditions. In fact the modelled surface does not fall far below the air temperature. This behaviour is typical of a concrete slab and not of a grass surface which commonly cools as far as 5 K below the air temperature on radiation nights (Met. Office, 1993). This will have a large impact on the forecast of whether fog will be formed, due to the insufficient cooling, and its
Radiation fog: model formulation and idealised sensitivity studies formation time due to the decreased cooling rate in comparison to reality. The solution is to introduce a vegetation canopy scheme to the surface temperature parametrisation, which effectively removes the ground flux from the energy balance equation that calculates the surface temperature (Deardorff, 1978; Best, 1998). In practice, this results in surface temperatures on clear radiation nights that agree much better with observations.
(c) Radiation The UM has a full radiation scheme, which treats shortwave and longwave radiation separately. The longwave scheme is based upon that described by Slingo & Wilderspin (1986) and the shortwave scheme on that described by Slingo (1985, 1989). The scheme includes interaction with clouds, using results derived from extensive field measurements, as well as with atmospheric trace gases, but not with aerosols. The radiation scheme is clearly of considerable importance for fog formation (especially longwave cooling) and dissipation, but the subject is too broad to discuss here. The timescale for radiative transfers is dominated by changes in the local cloud cover which is of the order of 600–1800 s. Hence it is acceptable to run the radiation scheme at relatively infrequent time intervals, so long as corrections are made for solar angle at intermediate steps. In the mesoscale model, radiation is called every hour; in the SSFM every 5 minutes. The impact of changing to even shorter radiation timesteps has been tested for fog and low cloud with no significant impact found.
(d) Precipitation The treatment of precipitation is of minor importance to radiation fog, and so will not be described in any detail. However, it should be borne in mind that the scheme in the UM is designed for large-scale forecasting, and so is microphysically very simple. In particular, the formation of precipitation will have an effect on the fog moisture budget, and, at present, is the only mechanism available to treat the settling of fog droplets. In practice, above freezing, the model computes the loss of cloud water by the formation of rain according to the sum of an accretion of cloud by rain falling into a layer, and an ‘autoconversion’ term which represents the formation of rain by coalescence. The latter has been tuned to be representative of precipitating cloud, and should not be expected to be realistic for fog.
(e) Cloud and fog diagnosis The scheme used to diagnose fog and visibility is the same as that in the Nimrod system described by Wright & Thomas (1998). This description shall not be repeated here. The details of the scheme are largely unimportant; essentially, the most important question is whether the model predicts the presence of condensed water at screen level. The UM cloud scheme is used for this. This predicts a cloud ‘fraction’ which
takes into account both fractional cover and fractional filling of model layers in the vertical. Both within and outside such cloud an estimate is made of visibility. Within cloud this is based on the predicted condensed water, outside it depends upon relative humidity. In both cases, particle sizes are estimated using an ‘aerosol’ concentration provided by the mesoscale forecast system. From here a fog probability can be defined as the probability of the visibility falling below a visibility threshold, typically 1000 m. This can equally well be considered as a fog fraction of a visibility below the given threshold. In practice, while these refinements are important, the sensitivity of fog forecasts to model formulation, forcing or initial data can be judged solely from the presence and amount of cloud (Wright & Thomas, 1998).
2.3. Forcing The SSFM must be forced externally with a horizontal pressure gradient and advection terms to represent the effect of larger-scale dynamics. In this paper the model is forced geostrophically where the wind increments are derived with respect to prescribed (constant) geostrophic wind components, and the effects of advection are ignored. The initial profiles of wind, temperature and humidity are either prescribed or provided via the analysis given by the mesoscale model or from observations at the site of interest. In part II of this paper the model is forced from the geostrophic adjustment and advection terms generated by the mesoscale model.
2.4. Vertical resolution The current mesoscale model has 31 levels in total with 28 levels for wet processes and 14 levels treated by the boundary layer (up to about 2200 m). Near the surface, in the region of significance for fog, there are only five model levels at heights above the local surface of approximately 10 m, 40 m, 100 m, 190 m and 300 m. To represent the physics of fog formation and dissipation better this resolution has been enhanced by a factor of four within the region treated by the boundary layer scheme with the new lowest level at 2.5 m. Above the model boundary layer the levels were left unaltered. Mesoscale initial conditions in the model boundary layer were transformed to higher resolution using linear interpolation in log(p).
3. Performance of the SSFM in idealised cases The use of idealised cases – one under summer conditions and one under winter conditions – in the assessment of the SSFM serves to identify the response of the model to systematic changes in variables, such as wind speed and humidity, that critically influence the formation of fog. While the initial profiles were obtained from the three-dimensional analysis, and so were realistic, the runs were idealised in the sense that conditions were not subject to advective processes and there was
281
P A Clark and W P Hopwood no initial cloud cover. The performance assessment was conducted by comparing a ‘control’ model integration with model integrations that, firstly, varied the geostrophic forcing velocity between 2 m s−1 and 15 m s−1 leaving the initial humidity profile constant and, secondly, varied the initial humidity profile between 70% and 110% of the ‘control’ initial humidity profile, with a contant geostrophic forcing velocity of 5 m s−1. The control integration performed for both the summer and winter cases was conducted with the geostrophic forcing velocity found at the top of the model boundary layer in the mesoscale model and, with the initial humidity profile found in the mesoscale model. The ‘control’ summer case produced no fog or low cloud whereas the ‘control’ winter case produced approximately 25% fog cover to a depth of ~200 m. All the integrations were initialised at 1200 UTC and integrated for 24 hours. The sunset and sunrise times were 1550 UTC and 0801 UTC for the winter case and 2105 UTC and 0510 UTC for the summer case.
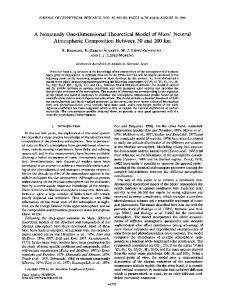
3.1. Impact of wind speed The impact of increasing the geostrophic windspeed is shown in Figures 1 and 2. It shows that the diagnosed minimum bottom level temperature increases due to increased geostrophic wind. This is caused by increased turbulence mixing warm air down towards the surface from aloft offsetting the radiative cooling at the surface. The retention of the surface based inversion in the winter case despite the fog being 200 m deep is probably due to the use of a local mixing scheme; cloud top cooling can lead to local instability, but the resulting increase in mixing takes time to penetrate all the way to the surface. In addition, the model only produces fractional cover, and so allows longwave cooling from the surface to the sky. In the winter case the amount of cloud water (not shown) and hence cloud amount, as shown in Figure 3, were also reduced with increasing geostrophic windspeed. (It should be noted that the cloud amount diagnostic calculated in the cloud scheme is such that it possesses a 1:1 relationship with the Liquid Water Content (LWC).) This caused a delay in the onset of fog formation and once formed, the increased mechanical turbulence generated slightly deeper fog/low cloud layers with less coverage. This case is summarised in Table 1.
Figure 1. Evolution of the temperature profile with geostrophic wind for summer case. 2 m s−1 (solid), 5 m s−1 (dotted), 8 m s−1 (dashed), 10 m s−1 (dot-dash), 12 m s−1 (dot-dotdash).
3.2. Impact of initial humidity The impact of changing the magnitude of the initial humidity throughout the model profile is shown in Figures 4 and 5. As would be expected, the temperature profile in the ‘surface layer’ and predicted surface minimum temperature were decreased, by about 5 K in the summer case and 3 K in the winter case. For the winter case, a delay in the onset of fog formation with decreasing initial humidity profile and the amount of fog were simulated, as shown in Figure 6. This delay was between 2 and 8 hours for integrations carried out
282
Figure 2. Evolution of the temperature profile with geostrophic wind for winter case2 m s−1 (solid), 5 m s−1 (dotted), 8 m s−1 (dashed), 10 m s−1 (dot-dash), 12 m s−1 (dot-dotdash).
Radiation fog: model formulation and idealised sensitivity studies
Figure 3. Evolution of the cloud amount profile with geostrophic wind for winter case. 2 m s−1 (solid), 5 m s−1 (dotted), 8 m s−1 (dashed), 10 m s−1 (dot-dash), 12 m s−1 (dot-dotdash).
Figure 5. Evolution of the temperature profile with initial humidity for winter case. Factor = 1.0 (solid), Factor = 0.9 (dotted), Factor = 1.05 (dashed), Factor = 1.1 (dot-dash).
Figure 4. Evolution of the temperature profile with initial humidity for summer case. Factor = 1.0 (solid), Factor = 0.9 (dotted), Factor = 1.05 (dashed), Factor = 1.1 (dot-dash).
Figure 6. Evolution of the cloud amount profile with initial humidity for winter case. Factor = 1.0 (solid), Factor = 0.9 (dotted), Factor = 1.05 (dashed), Factor = 1.1 (dot-dash).
283
P A Clark and W P Hopwood Table 1. Summary of winter case sensitivity to geostrophic wind. Geostrophic 10 m wind Fog formation Screen level wind (m s−1) speed at T+20 time (hours cloud liquid (m s−1) from forecast water content data time of at T+20 1200 UTC) (g kg−1) 2 5 8 10 12 15
1.8 3.2 4.5 5.3 6.1 7.4
4 6 12 20 Non formed Non formed
0.032 0.015 0.002 0.0 0.0 0.0
with 10%–30% (not shown) reductions in the initial specific humidity profile. The delay in fog formation due to a 30% reduction in the initial humidity profile is approximately equal to the delay invoked by increasing the geostrophic windspeed from 5 m s−1 to 8 m s−1 (i.e. a factor of 2.4 increase in geostrophic drag coefficient). It should be noted that in a mesoscale model forecast the root mean square error in relative humidity is about ±10%. Increasing the initial specific humidity profile causes fog to form proportionately earlier, as expected. Also within the bottom 50 m a 10% increase in the initial specific humidity profile leads to a factor of two increase in the fog amount; however, above this and below the fog top, a 10% increase in the specific humidity profile leads to a factor of four increase in the ‘cloud amount’ (i.e. it forms a layer of stratus). These results imply that the magnitude of the initial specific humidity is a significant factor in the determination of the fog formation time.
3.3. Impact of the surface exchange formulation The impact of using the explicit surface exchange scheme when compared with the Monin-Obukhov exchange scheme, as used in the mesoscale model, on fog formation is quite small. For example, in the winter case fog formation is delayed by 30 minutes to 1 hour. This impact is significant from the point of view of forecast requirements, but the sensitivity of the formation of fog to the method of formulating the surface exchange coefficients is not as significant as the initial specific humidity profile. It should be noted in passing that, in other cases, we have noted an impact on the formation of very shallow fog from using the grass canopy in combination with the Monin-Obokhov surface exchange as a result of enhanced evening cooling, but this will be the subject of future work.
4. Conclusions The above results have demonstrated the ability of the SSFM to simulate radiation fog formation and dissipation processes, and that the model physics shows the (expected) sensitivity to wind speed and humidity as
284
documented by Roach et al. (1976). Model simulations show many of the characteristics expected of radiation fog. The most important parameter, not surprisingly, is the geostrophic wind. The initial humidity and temperature actually have only a secondary effect on the formation of fog: the relative humidity change as temperatures drop is much greater than the uncertainty in near surface relative humidity typical of the mesoscale model. While improved local humidity information may have an effect in critical circumstances, the initial conditions from the mesoscale model analysis are probably sufficiently good for most purposes for defining the near surface humidity. However, in critical circumstances the uncertainties in the humidity and temperature profile themselves may have a much greater impact on the near surface stability and the eventual depth of the fog layer. There are evident problems associated with the use of NWP ‘gridbox’ parametrisations for ‘point’ simulations (especially the cloud and precipitation schemes) but these results suggest that the model may form a useful forecasting tool when coupled to three-dimensional NWP output, and that comparisons with real fog events are worthwhile. This will be attempted in part II of this paper.
Appendix A. Boundary layer formulation The Richardson number is defined by: Ri =
∂B / ∂z ∂u / ∂z
2
where u is the wind speed and the buoyancy gradient is given by: ∂T g ∂qW ∂B ≡ g β T' L + + βQ' ∂z ∂z ∂z c p Here, TL and qW are the liquid water temperature and total water content, defined by: TL = T −
LC (L) LC + LF (F) qC − qC cp cp
qW = q + qC(L) + qC(F) where LC and LF are the latent heat of condensation and freezing, and and are the liquid and frozen cloud water contents respectively. These variables are used because they are conserved in adiabatic cloud formation processes. The β terms give the relative contribution to buoyancy from fluctuations in temperature, water vapour and cloud water. They are computed from: β ′T = β T − α L βC βQ ′ = βQ − α L βC
Radiation fog: model formulation and idealised sensitivity studies where: 1 T
βT = βQ =
The mixing lengths lM and lH are neutral mixing lengths given by the Blackadar formula (Blackadar, 1962):
(
[ (
)
lM ( z ′ ) =
ε −1 − 1
)
1 + ε − 1 q − qC
]
L βQ βC = Cα L β T − 1 − ε c p ∂ qs αL = ∂T
(
)
Here ε is the usual ratio of gas constant of air and water vapour. In dry air the absence of condensation the Richardson number simplifies to the more usual formulation. Formulating the turbulence mixing using the cloud-conserved thermodynamic and water content variables automatically includes the effects of cloud water phase changes on the turbulence. The first order mixing assumption gives the following expressions for the vertical fluxes of momentum, moist static energy and moisture:
lH
( ) k( z′ + z ) ( z′ ) = 1 + k( z′ + z ) / λ 0m
where the von Karman constant, k = 0.4, and λM and λH are asymptotic neutral mixing lengths proportional to the boundary layer depth, zH, except for shallow boundary layers:
λH,M = max( 40.0, 0.15 zH ) Various modifications are made to the unstable formulation to deal with convection and the limit of zero wind, but these have little relevance to fog so will not be detailed.
Appendix B. Surface exchange formulation The surface drag is derived from:
( )
∂qW ∂z
where CD is the drag coefficient, the velocity at the first model level and that at the surface (zero over land). The surface friction velocity, , is defined by: τ u* = s ρs
The turbulent mixing coefficients are given by:
u* = CD
∂u ∂z
The stability functions fH and fM are empirically specified in terms of the Richardson number, Ri. If Ri ≥ 0 then: 1 fH = fM = 1 + f0 Ri
(
)
If Ri < 0 then: Ri G l 1/2 1 + 0 M − Ri EH lH Ri fM = 1 − G0 G l 1/2 1 + 0 M − Ri EM lH Here G0, EH and EM are adjustable parameters currently set to 10, 25 and 4 respectively. In the very stable limit (Ri → ∞) the functions become small but never reduce to zero or cut off all mixing. fH = 1 − G0
τs ρs
1/2
so:
∂u = l f ( Ri ) ∂z 2 M M
KH = lM lH fH ( Ri )
H
2 τs = − u′ w ′ = CD u1 − u0 s ρs
∂T g w ′TL′ = − KH L + ∂z c p
KM
)
1 + k z′ + z0 m / λ M
0m
∂u τ = −u ′ w ′ = K M ∂z ρ
w ′qW ′ = − KH
(
k z′ + z0 m
( )
( )
1/2
u1 − u0
The surface fluxes of sensible heat, Hs, and moisture, Es, are obtained from:
(
Hs = w ′TL′ c pρs
(
) = −C
H
s
g υ1 − υ0 TL1 − Ts + zB cp
)
(
(
))
Es = w ′qW ′ = −y CH υ1 − υ0 qW 1 − qSAT Ts , Ps s rs Here, zB is the height of the bottom model level above the surface on which T = Ts, Ts and Ps are the surface temperature and pressure respectively, and ψ takes account of any deviation of the moisture flux from its ‘potential’ value based upon saturation at the surface. The lower boundary conditions require the wind speed, TL and qW to tend to surface values (0 for wind over land) as z approaches z0h, z0m and z0m respectively, where z0h and z0m are the roughness lengths for heat and momentum. The surface buoyancy flux can be defined as: FBs ρs
=
(
g w ′Tv′ Tv1
) 285
P A Clark and W P Hopwood where Tv is the usual virtual temperature, and a surface layer buoyancy scaling parameter, B*, can be defined by: FB B* = − s ρs u * It is usual to derive the surface exchange coefficients using Monin-Obukhov similarity theory, which, for a horizontally homogeneous surface layer under stationary conditions, describes the vertical profiles of velocity, temperature and moisture, in terms of the above surface scaling parameters and universal functions of only z/L, where L is a length scale (the MoninObukhov length) defined by: u*2 kBs However, use of this requires iteration, since the scaling parameters are defined in terms of the quantities we wish to derive. Furthermore, it is found that using this local theory in models with gridboxes of large horizontal extent can lead to some unrealistic behaviour. Instead, therefore, an explicit scheme is used within three-dimensional NWP runs which is couched in terms of the surface layer bulk Richardson number, RiB. This is defined as above, but using the gradients between the surface and bottom model level. Thus: L=
RiB =
(z + z )∆B 1
0m
u1 − u0
2
where u1-u0 is the wind speed difference between the first model level and the surface and the buoyancy difference is defined by: g ∆B = g β T1 TL1 − Ts + zB + βQ1 ψ qW1 − qSAT Ts , Ps cp The surface exchange coefficients are then derived using explicit relationships:
(
(
( ) (Ri , z , z , z ) = C
))
CD RiB , z1 , z0 m = CDN fm CH
B
1
0m
0h
f
HN h
where the neutral values CDN and CHN are given by the usual neutral log laws. The stability factors fm and fh are defined as follows: If then:
If RiB then:
1 1 + Am RiB
fm =
(
fh =
1 1 + Ah RiB
fm = 1 −
fh = 1 −
(
)
)
Am RiB
(
1 + B − Ri m B Ah RiB
(
1 + B − Ri h B
)
)
1/2
1/2
The A terms here are tunable parameters.
286
Acknowledgement The work described in this paper was supported under the European Commission IVth framework, DGVII AI-95-SC.109.
References Beljaars, A. C. M. & Holtslag, A. A. M. (1991). Flux parametrisation over land surfaces for atmospheric models. J. Appl. Meteorol., 30: 327−341. Bergot, T. & Guedalia, D. (1994). Numerical forecasting of radiation fog. Part I: Numerical model and sensitivity tests. Mon. Wea. Rev., 122: 1218−1230. Best, M. J. (1998). A model to predict surface temperatures, Boundary-Layer Meteorol., 88: 279−306. Blackadar, A. (1962). The vertical distribution of wind and turbulent exchange in a neutral atmosphere. J. Geophys. Res., 67: 3095−3102. Cox, P. M., Betts, R. A., Bunton, C. B., Essery, R. L. H., Rowntree, P. R. & Smith, J. (1999). The impact of new land surface physics on the GCM simulation of climate and climate sensitivity. Climate Dynamics, 15: 183−203. Cullen, M. J. P. (1993). The Unified Forecast/Climate model. Meteorol. Mag., 122: 81−94. Deardorff, J. W. (1978). Efficient prediction of ground surface temperature and moisture with inclusion of a layer of vegetation. J. Geophys. Res., 83: 1889−1903. Dyer, A. J. (1974). A review of flux-profile relationships. Boundary-Layer Meteorol., 7: 363−372. Lorenc, A.C. (1988). A practical approximation to optimal 4dimensional objective analysis. Mon. Wea. Rev., 116: 730− 745. Macpherson, B., Wright, B. J., Hand, W. H. & Maycock, A. J. (1996). The impact of MOPS moisture data in the UK Meteorological Office Mesoscale data assimilation scheme. Mon. Wea. Rev., 124: 1746−1766. Met. Office (1993). The Forecasters Reference Book. Meteorological Office. Musson-Genon, L. (1987). Numerical simulation of a fog event with a one-dimensional boundary layer model. Mon. Wea. Rev., 115: 592−607. Roach, W. T., Brown, R., Caughey, S. J., Garland, J. A. & Readings, C. J. (1976). The physics of radiation fog: I. A field study. Q. J. R. Meteorol. Soc., 102: 313−334. Slingo, A. (ed) (1985). Handbook of the Meteorological Office 11-layer atmospheric general circulation model. Vol 1: model description. DCTN 29. Unpublished report available from the National Meteorological Library, London Road, Bracknell, Berkshire RG12 2SZ, UK. Slingo, A. (1989). A GCM parametrization for the shortwave radiative properties of water clouds. J. Atmos. Sci., 46: 10, 1419−1427. Slingo, A. & Wilderspin, R. C. (1986). Development of a revised longwave radiation scheme for an atmospheric general circulation model. Q. J. R. Meteorol. Soc., 112: 371− 386. Wright, B. J. & Thomas, N. (1998). An objective visibility analysis and very-short-range forecasting system, Meteorol. Appl., 5: 157−181.