Dennis Collentine. Dept. Of Economics,. University .... Catch crop and spring tillage. (reduction). 62. 70. 53. No measures applied. Subsidy. USD/ha. Sandy loam.
One Step at a Time: Incremental implementation of a water quality permit program
Dennis Collentine Dept. Of Economics, University of Gävle, Sweden
Land Use and Discharge Permit Programs {
{
A discharge permit progam which includes nonpoint sources is dependent upon a definition of land use and the property rights associated with that land use. Allowing discharge permits to be tradable increases the potential for cost efficient achievement of environmental targets
TALUC, Washington DC September 2007
Water Quality Trading {
{
“Trading is a way to address the entire needs of a watershed – not just isolated point source discharges…a cost-effective method to solve water quality challenges.” Stephen L. Johnson, Administrator of the U.S. Environmental Protection Agency, at the Second National Water Quality Trading Conference, Pittsburgh, PA on May 24th, 2006. “…not all trading programs are equal. Some designs are better than others. Furthermore, one size does not fit all. Emissions trading programs can and should be tailored to each specific application.” Tietenberg (2006), Emissions Trading: Principles and Practices, p. 207.
TALUC, Washington DC September 2007
What is nutrient trading? {
{
{
A market based approach for protecting and improving water quality that can enhance options available to reduce pollutant loadings. A way to achieve water quality goals cost effectively. Takes advantage of the fact that some pollution sources are easier (and less expensive) to reduce than others. Generates market demand for new, innovative technologies.
TALUC, Washington DC September 2007
What trading is not { { {
{
Not a substitute for regulation; it is a policy tool that can be used alongside regulation. Not a way of letting the market decide the environmental outcome. Does not let polluters off the hook. It does allow sources facing high pollution reduction costs to purchase less costly reductions from other sources; but the reductions must be made and paid for. Does not exclude other policy approaches. Trading can be used in conjunction with other policy tools such as targeted subsidies, mandatory Best Management Practices, or public education campaigns.
TALUC, Washington DC September 2007
Cap and Trade Programs {
Cap z z
{
A limit is set for the total amount of nutrients in a watershed Permits are allocated among sources
Trade z z
TALUC, Washington DC September 2007
Institutional framework designed for allowing trades Abatement measures are invested in by those sources that have the lowest-cost opportunities to reduce pollution
Cap and trade programs have not worked {
Few or no trades z z
{
Most trades have been PS/PS Mostly pilots, many have faded
Why have they not worked? z z z z
TALUC, Washington DC September 2007
allocation problems (quantifying property rights, NPS) low liquidity (inadequate supply and demand) high transaction costs (high information costs, coordination of bilateral trades) low incentives for investment in abatement for non-regulated sources (weak price signals)
Composite Market Model: Offset trading program {
{
Differs from a Cap and Trade scheme in how a cap is determined and how permits are allocated, trading principle is the same Individual pollution generating activities can be regulated and then abated or offset based on expected (modelled) discharges z
TALUC, Washington DC September 2007
since discharges cannot be controlled directly, the control mechanism is with the activities which generate pollution
Property rights and tradable permits {
Trading programs are based on establishing property rights z z
{
there needs to be a right before ownership can be transferred (traded) Allocation assigns property rights
What are these rights? z z
Tietenberg(2007): …it prioritizes the right to access the resource to a specified degree” Collentine (2006): …do not represent a full set of property rights”
TALUC, Washington DC September 2007
Property rights in a composite market program { {
Determined for each pollution generating activity Two possibilities:
z z
i) the right is held by the owner of the activity ii) the right is held by the community/society In the first case, the community must compensate the holder for infringements. In the second case, the would-be user of the right must compensate the community for infringements.
TALUC, Washington DC September 2007
Property rights in a composite market program {
{
{
How are rights determined? By regulation! In a composite market program rights are determined as a baseline of acceptable practices for each polluting related activity. Examples
TALUC, Washington DC September 2007
Example 1: Catch crops {
Alternative 1a: If all producers of crops sown in the spring in Nitrate Vulnerable Zones (NVZ) are expected to sow a catch crop at the same time, then a producer who wished to not sow a catch crop would need to compensate the community for the infringement by paying the social (opportunity) cost for the expected excess discharge. In the composite market program this is calculated as the marginal cost of a comparable reduction from another source, the price of a permit.
TALUC, Washington DC September 2007
Example 1: Catch crops {
Alternative 1b: If sowing catch crops were an elective measure (not required) then society would need to compensate the producer for the infringement by paying the opportunity cost to induce them to choose to sow a catch crop. In a composite market program this generates a discharge credit which could be sold.
TALUC, Washington DC September 2007
Environmental effects {
{
In both of these alternatives the effect of the measure (catch crops) must be calculated, (estimated). In the first case, so that the producer will know the number of permits which must be acquired and in the second case so that the value of the credit can be assessed, the value of the abatement. This quantifies the property right. z
Normalized to the estimated effects on nutrient losses of the activity at the recipient .
TALUC, Washington DC September 2007
Example 2: Fertilization rates {
Alternative 2a: If an acceptable fertilization practice (“good agricultural practice”) for springsown grains was determined to be 100 kg N/ha for land within NVZs then in a composite market scheme a producer who wished to exceed this rate must purchase compensating permits for the estimated excess N losses associated with the higher rate.
TALUC, Washington DC September 2007
Example 2: Fertilization rates {
Alternative 2b: Under the same baseline condition a producer who used less then 100 kg N/ha would have an opportunity to sell the reduced N loss associated with the lower rate. However, this does not mean that a buyer would be found (a credit created).
TALUC, Washington DC September 2007
Composite Market System {
Three integrated markets: z z z
{
a) Primary contract market b) Primary permit market c) Secondary permit market
Different functions for each market z z z
TALUC, Washington DC September 2007
a) Setting permit prices b) Issuing (selling) permits c) Market exchange
Implementation of the Composite Model {
Creating supply z
z
{
Creating demand z z
{
Setting permit prices at the marginal cost of abatement Establishing baselines Regulating activities Establishing baselines
Setting up a trading framework (institution) z
TALUC, Washington DC September 2007
Trading rules
Case study: Rönne River { { {
Setting prices for N permits Creating demand for N permits Numerical analysis z z
TALUC, Washington DC September 2007
BMPs: Catch crops and spring tillage Regulation: Household septic system
Setting Prices for N permits Three steps
1) BMPs: Catch crops, spring cultivation and combination (subsidies) 2) Runoff model: SOILNDB (TRK project), modelled discharge by soil type and subcatchment 3) Estimated MCA: Setting permit prices
TALUC, Washington DC September 2007
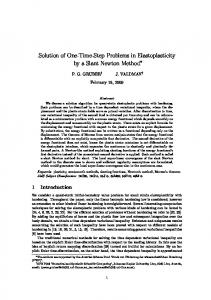
Figure 1. Rönne River basin
96-006
96-007
96-005 96-004
96-003 96-002 96-001
TALUC, Washington DC September 2007
Table 1. Estimated leaching by soil type and BMP (kg/ha) and subsidy.
Loam
Loamy sand
Sandy loam
No measures applied
53
70
62
Catch crop and spring tillage (reduction)
29 (24)
36 (34)
33 (29)
$162.50
Catch crop only (reduction)
38 (15)
51 (19)
44 (18)
112.50
45 (8)
58 (12)
52 (10)
50.00
Spring tillage only (reduction) TALUC, Washington DC September 2007
Subsidy USD/ha
Table 2a: Cost per kg per unit of net leaching reduction (USD/kg) subcat 96-001
subcat 96-002
subcat 96-003
subcat 96-004
subcat 96-005
subcat 96-006
subcat 96-007
loam
$14.40
$16.51
$8.16
$8.36
$8.26
$9.40
$8.06
loamy sand
10.18
11.66
5.76
5.90
5.83
6.64
5.69
sandy loam
11.93
13.66
6.75
6.91
6.84
7.79
6.68
loam
15.96
18.29
9.04
9.26
9.15
10.41
8.93
loamy sand
12.60
14.44
7.14
7.31
7.23
8.23
7.05
sandy loam
13.30
15.25
7.53
7.71
7.63
8.68
7.44
loam
13.30
15.25
7.53
7.71
7.63
8.68
7.44
loamy sand
8.86
10.16
5.03
5.15
5.09
5.79
4.96
sandy loam
10.64
12.20
6.03
6.18
6.10
6.95
5.95
Catch crop and spring tillage
Catch crop only
Spring tillage only
TALUC, Washington DC September 2007
Table 2b: Total potential reduction (in tons). subcat 96-001
subcat 96-002
subcat 96-003
subcat 96-004
subcat 96-005
subcat 96-006
subcat 96-007
loam
0
3.4
45.6
5.9
2.6
11.7
41.4
loamy sand
0
4.8
14.4
4.2
7.4
8.3
19.6
sandy loam
51.3
36.6
104.1
35.4
12.6
35.5
55.6
loam
0
2.1
28.5
3.7
1.6
7.3
25.9
loamy sand
0
2.7
80.2
2.3
4.1
4.7
10.9
sandy loam
31.8
22.7
64.6
22.0
7.8
22.0
34.5
loam
0
1.1
15.2
2.0
0.9
3.9
13.8
loamy sand
0
1.7
5.1
1.5
2.6
2.9
6.9
sandy loam
17.7
12.6
35.9
12.2
4.3
12.2
19.2
Catch crop and spring tillage
Catch crop only
Spring tillage only
TALUC, Washington DC September 2007
1 8
Figure 2. Supply curve for selected BMPs 20 catch crop and spring tillage catch crop only
USD-kg reduction
15
spring tillage only
10 5 0 0
TALUC, Washington DC September 2007
100
200
300
400
500
600
Q net potential N reduction (1000 kg)
Creating demand for N { {
Regulating activities, establishing ”baselines” Household septic systems, function related standard: z z
{
50 % N removal 90% P removal
40% of properties with septic systems are not in compliance with current standards
TALUC, Washington DC September 2007
Estimated gross N loads from septic systems in the Rönneå catchment that do not comply with standards Kommun and group (A,B)
Number of septic systems]
Type of system Sludge seperation Number (gross load)2]
Type of system Infiltration pit Number (gross load)3]
Ängelholm (A)
2914
670 (4080 kg/yr)
612 (4284 kg/yr)
Örkelljunga (A)
1992
124 (755 kg/yr)
42 (294 kg/yr)
Klippan (A)
1732
183 (1114 kg/yr)
74 (518 kg/yr)
Perstorp (A)
722
722 (1145 kg/yr)
31 (217 kg/yr)
7094 kg/yr
5313 kg/yr
Group A gross load Hörby (B)
3170
792 (4823 kg/yr)
136 (952 kg/yr)
Höör (B)
2503
651 (3965 kg/yr)
108 (756 kg/yr)
Group B gross load
8788 kg/yr
1708 kg/yr
Total gross load
15881 kg/åyr
7021 kg/yr
[1] PLC5 (SCB) [2] Estimated loading 7 kg/yr and removal rate(13%), PLC5. [3] Estimated loading 7 kg/yr and removal rate (0%), PLC5. TALUC, Washington DC September 2007
Estimated net N loads from septic systems in the Rönneå catchment that do not comply with current standards Group
Gross load N kg/year
Transport Coefficient
Net load N kg/year
Group A
7094 + 5313
80%
9925
8788 + 1708
45%
4723
Group B Total
*Arheimer et al (2006) estimated this at 17.78 t/yr
TALUC, Washington DC September 2007
14648*
Permit pricing? {
{
What would it cost to reduce N load to the sea by 14.6 tonnes from another source (agriculture?) Answer can be found in Tables 2a and 2b (and in the supply curve for abatement measures)
TALUC, Washington DC September 2007
Table 2a: Cost per kg per unit of net leaching reduction (USD/kg) subcat 96-001
subcat 96-002
subcat 96-003
subcat 96-004
subcat 96-005
subcat 96-006
subcat 96-007
loam
$14.40
$16.51
$8.16
$8.36
$8.26
$9.40
$8.06
loamy sand
10.18
11.66
5.76
5.90
5.83
6.64
5.69
sandy loam
11.93
13.66
6.75
6.91
6.84
7.79
6.68
loam
15.96
18.29
9.04
9.26
9.15
10.41
8.93
loamy sand
12.60
14.44
7.14
7.31
7.23
8.23
7.05
sandy loam
13.30
15.25
7.53
7.71
7.63
8.68
7.44
loam
13.30
15.25
7.53
7.71
7.63
8.68
7.44
loamy sand
8.86
10.16
5.03
5.15
5.09
5.79
4.96
sandy loam
10.64
12.20
6.03
6.18
6.10
6.95
5.95
Catch crop and spring tillage
Catch crop only
Spring tillage only
TALUC, Washington DC September 2007
1 7
Table 2b: Total potential reduction (in tons). subcat 96-001
subcat 96-002
subcat 96-003
subcat 96-004
subcat 96-005
subcat 96-006
subcat 96-007
loam
0
3.4
45.6
5.9
2.6
11.7
41.4
loamy sand
0
4.8
14.4
4.2
7.4
8.3
19.6
sandy loam
51.3
36.6
104.1
35.4
12.6
35.5
55.6
loam
0
2.1
28.5
3.7
1.6
7.3
25.9
loamy sand
0
2.7
80.2
2.3
4.1
4.7
10.9
sandy loam
31.8
22.7
64.6
22.0
7.8
22.0
34.5
loam
0
1.1
15.2
2.0
0.9
3.9
13.8
loamy sand
0
1.7
5.1
1.5
2.6
2.9
6.9
sandy loam
17.7
12.6
35.9
12.2
4.3
12.2
19.2
Catch crop and spring tillage
Catch crop only
Spring tillage only
TALUC, Washington DC September 2007
Permit pricing {
{
TALUC, Washington DC September 2007
The marginal cost for reducing 14.6 tonnes of N to the sea is $5.09 or 40 SEK/kg (spring tillage on sandy loam in subcatchments 96-003,-005,-007). Number of permits which every property owner that does not want to upgrade their septic system to comply with standards must have depends on the type of septic system and subcatchment location.
Estimated N load to the sea by type of septic systems and subcatchment location, annual cost valued at 40 SEK/kg Cost
Subcatchment B Load kg/year
Cost
Type of system
Subcatchment A Load kg/year
Infiltration pit
5,6
224 SEK/yr
3,15
126 SEK/yr
Sludge seperation
4,87
195 SEK/yr
2,74
109 SEK/yr
TALUC, Washington DC September 2007
Comments {
{ { {
{
Permit quantities need to be normalized (one kg N to the sea), number of required permits can be rounded to the nearest kg Administration costs are not included Permits need to be time specified Number of permits refers only to N loads, in the case of septic systems there would also need to be a permit for P loads as well Permit trading? (repurchase?)
TALUC, Washington DC September 2007
Incremental implementation of a water quality permit program { {
One step at a time (partial information) Establishing baselines z
{
Creating demand for permits z
{
Regulating land use for individual activities
Setting permit prices z
{
Individual emission activities
Based on the marginal cost of abatement (dynamic)
Establishing a trading institution
TALUC, Washington DC September 2007
Next steps {
Expanding the information in the abatement supply curve z z z z
{
Institutional design z z z z
{
Phosphorus loss BMPs and modelling! Other BMP measures (wetlands, buffer strips) Other sources of potential abatement (oysters) Reverse auctions for BMPs Scale? Subcatchment, Catchment, Basin Recipient? (N? P? the same?) Administration? Political boundaries (WFD)? Costs?
Legal framework? (regulation, earmarked taxes)
TALUC, Washington DC September 2007
References {
{
{
{
Collentine, D. (working paper). One Step at a Time: Incremental implementation of a water quality permit program. Available at http://www.hig.se/~nisrum/SubmissionTrading.pdf Collentine, D. (2006). Composite Market Design for a Transferable Discharge Permit (TDP) System. Journal of Environmental Management and Planning, 49(6), 929-946. Collentine, D. (2005a). Phase-in of nonpoint sources in a Transferable Discharge Permit (TDP) system for water quality management: setting permit prices. Ambio, 34, 573-578. Collentine, D. (2005b). Including non-point sources in a water quality trading permit program, Water Science and Technology, 51, 3-4.
TALUC, Washington DC September 2007
Thank you for your attention! Questions? Comments?
TALUC, Washington DC September 2007