Ontology-Driven Workflow Management for Biosequence Processing Systems Melissa Lemos1, Marco A. Casanova1, Luiz Fernando Bessa Seibel1, José Antonio F. de Macedo1, Antonio Basílio de Miranda2 1
Department of Informatics, Pontifical Catholic University of Rio de Janeiro, Brazil Rua Marquês de S. Vicente, 225 - Rio de Janeiro,RJ - Brazil - CEP 22453-900 {melissa, casanova, seibel, jmacedo}@inf.puc-rio.br 2
Oswaldo Cruz Institute, Brazil
[email protected]
Abstract. Researchers typically need to combine Bioinformatics processes to perform larger, more complex tasks, expressed as workflows. However, there is a strong indication from users that running complex workflows is an addition burden that must be alleviated. Motivated by this observation, this paper first introduces an ontology that defines classes and instances of Bioinformatics projects, processes, resources and data. Then, it argues that it is fruitful to design the workflow tool around the ontology, thereby creating an ontology-driven Bioinformatics workflow management system.
1 Introduction The ultimate goal of the Human Genome Project is to generate a high-quality reference DNA sequence for the human genome – some 3 billion base pairs – and to identify all human genes. Other important goals include sequencing the genomes of model organisms to interpret human DNA, enhancing computational resources to support future research and commercial applications, exploring gene function, studying human variation, and training future scientists in Genomics [1]. Experimental data in what follows means raw molecular data - DNA or protein sequences - and will be referred as biosequences. Because experimental data carry no meaning, genome projects usually include an annotation phase whose goal is to convert biosequences into biologically relevant information [2]. An annotation is a metainformation or a description of high level features of the biosequence. Useful information includes characteristics of a known gene, such as its name and function[2]. After researchers isolate new biosequences in the laboratory, usually they proceed to analyze and annotate the biosequence with the help of a variety of computer tools or processes. However, given the rate at which researchers now generate biosequences, on one hand, careful human analysis is becoming increasingly difficult and, on the other hand, automatic annotation presents a computational challenge.
One of the main analysis processes used in the annotation phase is to check whether other researchers have already studied biosequences similar to the new biosequence obtained in laboratory. The FASTA [21] and BLAST [3] (Basic Local Alignment Tool) program families are examples of sequence comparison tools. Probably the most widely used computational tool in Biology, BLAST searches databases for all biosequences similar to a target biosequence. Indeed, Molecular Biology databases have been proliferating rapidly. Some databases concentrate on specific molecules or specific functions and provide highly detailed information, while others try to cover broader areas with less detailed information. Researchers therefore need effective tools to mine large sets of biosequences. In addition to biosequence comparison, there are tools for gene prediction, gene classification, comparative genomics, structure prediction, phylogenetic analysis, pattern discovery, pattern recognition, sequence assembly and others. In summary, researchers now have access to a rich set of databases, as well as a variety of data analysis processes. They also need to combine processes to perform larger, more complex tasks. That is, a collection produced by one process can, given the appropriate semantics, act as an input collection to another process. In the context of this paper, process compositions will be expressed as workflows [4]. The public databases are heterogeneous, store large data volumes, are in constant growth, but do not usually have a detailed documentation of the database schema. Also, the analysis programs do not always have good documentation that describes the execution parameters and the input and output data formats, which makes it difficult to integrate them into more complex workflow processes. Therefore, there is a strong indication from users that defining complex workflows is an addition burden that must be alleviated. This context reveals the importance of creating a tool to help users define and execute Bioinformatics workflows. In addition, since the set of Bioinformatics processes and databases is continuously growing, it becomes interesting to design an ontology that captures the major data and process characteristics, including quality properties, and design the tool around the ontology. We call such a tool an ontology-driven [5] Bioinformatics workflow management system. This paper describes the design of the ontology-driven Bioinformatics workflow component of Bionotes [6], a biosequence annotation system under development at the Catholic University of Rio de Janeiro and in use at Oswaldo Cruz Institute [7] and at RioGene [8]. The paper is organized as follows. Section 2 provides a summary of the major requirements for a Bioinformatics workflow management. Section 3 presents the ontology used. Section 4 outlines the ontology-driven Bioinformatics workflow management system. Finally, Section 5 contains the conclusions.
2. Requirements for Workflow Management Systems Briefly, a workflow defines a composition of tasks. We assume that workflows are written in a suitable workflow language, which we leave unspecified for the sake of brevity.
Briefly, a workflow management system should: R1. Include commonly used tasks or processes and offer extensibility mechanisms to accommodate new processes. R2. Guide users throughout the process of workflow definition or re-definition (when intermediate or final results are judged not be useful or interesting) R3. Support workflow validation and optimization. R4. Support workflow execution scheduling. R5. Support unsupervised workflow execution, as well as supervised workflow execution that allows user intervention. R6. Store the provenance of workflow definitions and executions, and of the data generated by workflow executions, and help users access such metadata. R7. Help users analyze workflow results. These requirements are fairly general and apply to most application domains. We comment only on the last two requirements. Briefly, by workflow provenance we mean metadata capturing aspects of workflow definition, such the user who created the workflow, or aspects of workflow execution, such total execution time, the start time, end time, status (finished successfully, finished with errors, in execution, not started). Likewise, by workflow data provenance, we mean metadata indicating what workflow executions generated which data. As for the last requirement, in the context of Bioinformatics, an example would be as follows. In the annotation phase of the genome project of a bacterium, researchers need to identify genes. This may be accomplished using Glimmer, a process designed to identify ORFs – Open Read Frames. Based on the punctuation Glimmer generates for each ORF it detects, researchers may indicate if they believe the ORF is indeed a gene or not. Researchers also typically compare each ORF with the data stored in several databases, with the help of BLAST, to confirm the results from Glimmer. In this case, the system should organize the results produced by Glimmer and by the several runs of BLAST in a way that facilitates comparing ORFs and identifying which of them are most likely genes, as well comparing the results of the several runs of BLAST for the same ORF. A table with a line for each ORF and a column for Glimmer and a column for each BLAST run would be a good candidate for the combined presentation of the results.
3. An Ontology of Bioinformatics Workflow In this section, we outline our proposal for an ontology that drives the Bioinformatics workflow management system. We first describe the overall structure of the ontology and then informally introduce the major classes and their properties. Although we adopt the concepts in [9], a formal definition of the ontology in OWL is beyond the scope of this paper. Our ontology defines classes and instances of Bioinformatics processes, resources, data and projects. It also defines object properties that relate processes to projects, resources and data, and datatype properties that map processes to quality properties. We classify processes as constructive, filter, format transformation and workflow control. Constructive processes build new collections of objects, and include the
Bioinformatics processes. A constructive process is just a process that is actually implemented by the system. A constructive process class is a generic name for a set of process instances or, recursively, a set of process classes, so that process classes and process instances form a hierarchy. For example, the Process View panel in Figure 1 (at the end of the paper) displays the roots of the process class hierarchy and the process class hierarchy rooted at Sequence Alignment process class. BLASTP and BLASTN are examples of process instances. A filter process extracts parts of an existing collection for further processing. A format transformation process applies format transformations to a collection. A format transformation can be simple, such as a mere syntactical transformation, or complex, such as a transformation of a nucleotide sequence into an amino acid sequence. A control process governs workflow execution. Control processes include sequential and parallel composition, stop points and tests to inspect the result of process execution (failure or success). The behavior of a process can be modified by the setting of parameters. In addition, a process may have a description and quality properties. Parameters, descriptions and quality properties are part of the process definition and are included in the ontology with default values, which can be updated. Our ontology includes the following quality properties: performance, which measures the amount of computational resources consumed by the process; popularity, which measures the percentage of the user community that knows and uses the process; cost, which measures the (financial) cost of running the process; default, which indicates if the process is the default option for the process hierarchy it belongs to; fidelity, which is the percentage of “false positives” and “false negatives” (applicable only to certain classes of processes); and availability, which is the percentage of time a service is available (in the context of a process implemented as a Web service). The system can help the user decide what is the best process instance to use, based on quality properties he specifies. For example, suppose the user wants to compute the local alignment of a sequence against a given database. This process may be implemented by variants of BLAST or FAST, depending on the quality properties the user determines. If the user privileges efficiency, the system should use BLAST. If he emphasizes fidelity, the system should choose FAST. The ontology also contains class hierarchies for the genome projects, input and output data and for the resources accepted by the Bioinformatics processes. Genome projects can be classified as EST and Complete. ESTs are typically unedited, automatically processed, single-read sequences produced from cDNAs (small DNA molecules reverse-transcribed from the cellular mRNA population). Libraries of cDNAs are routinely prepared that contain tens of thousands of clones, represent a variety of specific tissues types and represent a snapshot of gene expression during defined developmental stages and following specific biotic and abiotic challenges. The relative cheapness of EST sequencing and its associated automation often makes EST sequencing the most attractive route for eukaryotic genomes, whereas complete projects for prokaryotic genomes [20]. Indeed, EST projects are more appropriated if one desires to focus on the coding sequences, thereby reducing cost and
time, which is the case of eukaryotic genomes, composed mostly of non-coding sequences. Determining the class of the genome project is important because it influences the choice of the processes. For example, Phrap [10] and CAP3 [11] are both fragment assembly processes, but Phrap is the best choice for complete genome projects, whereas CAP3 is the best choice for EST genome projects. By specifying a project, a resource, an input or an output data class, the system can guide users to decide what is the best process instance to use. Data and resource quality properties are somewhat more difficult to define and are typically related to the hierarchy of abstract processes. For example, curatedness and redundancy are resource quality properties. SWISSPROT [12] is a curated database, meaning that it contains data that was manually checked, whereas TrEmbl[19] is not curated.
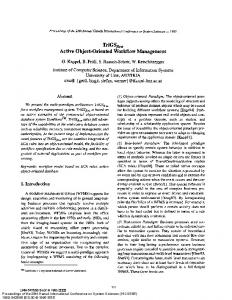
4. Using the Ontology-Driven Workflow Management System 4.1 How the System Works The system is organized as follows. The ontology management module is responsible for storing the ontology and for performing inferences. The module also facilitates updating the ontology to accommodate new classes, properties and rules pertaining to Bioinformatics processes, resources, data and projects. The workflow assistant helps researchers construct workflows by selecting constructive, filter and control process one at a time. The necessary inspection control and format transformation processes are automatically inserted by the system. The optimizer first verifies the coherence of the workflow the user defined. That is, it checks, with the help of the ontology, if the output data class of one process instance is an expected object property of the next process instance. If this checking fails, the optimizer includes a format transformation process to make process instance composition viable. Then, the optimizer applies the optimization rules, discussed in more detail in Section 4.2, to transform the workflow into its final form. The optimizer outputs an XML file which defines the workflow to the last module, the workflow interpreter. The system’s interface, shown in Figure 1, is organized as follows. The rightmost panel, called the workflow view, displays a tree view of the current workflow; the symbols “;” and “//” indicate sequential and parallel composition, respectively. The center panel, called the process view, exhibits the hierarchy of process classes and instances, perhaps pruned as explained below. The leftmost panel is divided into four sub-panels. The topmost sub-panel, called the project view, displays the project classes and instances hierarchy, and the second panel from the top, called the resource view, the hierarchy of resource classes and instances. The last two sub-panels display the input and output data class hierarchies. These are called the input and output views, respectively. The researcher directly access the process view, select a process instance and move it to the current workflow. If he is unsure about which process instance to select, he may use the views on the leftmost panel to prune the process view as follows. If he
selects a specific project class on the project view, the assistant will remove from the process view the process classes and instances that do not apply to the project class selected. Likewise, if the researcher selects a class or instance from the resource view, the assistant will remove from the process view the process classes and instances that cannot use the resource class or instance selected. The assistant will behave similarly when the researcher selects a data class from the input or output views. The researcher may also access the quality properties. He can click on the process class name and the assistant will show, in a window, quality process properties that will help him choose between the process instances. He can also look at a process description clicking on the process name in the Process View. In general, the researcher may modify the default configuration parameters of the process instance to adjust the quality of the results. The system displays all configuration parameters of a process if the user clicks on its name in the Workflow View. The researcher may change the default value of a parameter by clicking on its name. Besides parameter configuration, user can also bind the input, resource and output data instances of the processes to external files or to other process outputs. The system also displays filter parameters as children of their process instances in the Process View. We note that some process instance already have an input parameter that restricts the output and, therefore, do not require an explicit definition of an output filter. Moreover, the researcher can ask the system to verify the coherence of the process instance composition and, if it is necessary, include a format transformation process to make the composition viable. Furthermore, the user can ask the system to insert inspection control processes and optimize the workflow. The final result is an XML file which defines the workflow and will be processed by the workflow interpreter. 4.2 Workflow Optimization Experience has shown that, in the context of biosequence processing systems, workflows are not too complex and, therefore, they are not amenable to complex optimization procedures, such as those found in current object-relational database systems. Yet, several simple optimization procedures can be profitable employed, as discussed in what follows. Again, the optimization rules are part of the ontology and stored in the ontology management module. Process Pipelining. Suppose that the workflow contains a sequential composition of two programs, denoted S1;S2, and that the output of S1 is a set of biosequences (that must then be passed to S2). Then, depending on the semantics of S1 and S2, the system pass to S2 the sequences output by S1, as S1 produces them, without having to wait for S1 to produce the full set of output sequences. For example, consider the composition of Glimmer and BLAST, shown in Figure 1. The ORFs resulting from Glimmer may be immediately passed to BLAST. By contrast, the composition of Phred [13] and Phrap cannot be pipelined because Phrap can assemble the fragments only when Phred generates all reads. Process Parallelization. Suppose now that the workflow contains a sequential composition of two programs, S1;S2, such that S2 does not use any data output by S1. Then, obviously, their execution may be fully parallelized, that is, S1;S2 may be replaced by S1//S2. Note that process pipelining can also be used in combination with
process parallelization, for example, in a workflow fragment of the form S1;(S2//S3), if S1 satisfies the conditions for pipelining with respect to S2 and S3. Data Parallelization. Consider the following simple data parallelization strategy: − Distribute an input sequence set S among different processors, or assume that the input sequence set is already stored in different processors. − Apply the same program P, in parallel, to the sequence sets stored in the different processors, obtaining local results. − Move the local results to a central processor. − Combine the local results, in the central processor, using some combination procedure C, to obtain the final result. The strategy would be correct if the final result is the same as applying P to S. As an example, consider again the scenario of Figure 1. It is viable to distribute a set of contigs among several processors and then run Glimmer in each of them to parallelize ORF discovery. The final result is simply the union of the local results. This is, therefore, an example of a very simple combination procedure. Global Optimization. By global optimization, we mean optimizing together several workflows that work on approximately the same data, at approximately the same time, to reduce the volume of data accesses or data moves across different processors. This might involve simultaneous access to cached data, or even caching data across different transactions, as implemented in object oriented databases. 4.3 An Example of a Workflow Figure 1 depicts the system interface corresponding to the example discussed in this section. As a first step, suppose that a researcher starts with a set of chromatograms and that he wants to identify the bases of the sequences. If the user does not know which process to select, he may select Chromatogram Set (the input data class) in the Input View and then click on the “>” button. The system will show all processes which accept chromatograms as input class in the Process View. In this case, the tree will have the Bases Identification as process class with Phred and Abiview as process instances. The researcher may select one of them or, if he is unsure, he may click on the Bases Identification class process. The assistant will show, in a window, quality process properties that will help him choose between the Phred and Abiview process instances. For example, cost differentiates these process instances since Phred is a free software and Abiview is licensed. If the user indicates that cost is relevant, the assistant will suggest Phred as the best option. In this example, suppose that Phred is selected, as shown in the Workflow View. Next, the researcher has to select a process to obtain contigs by assembling the reads. CAP3 and Phrap are process instances designed to perform this task. The user may select one of these process instances directly from the Processes View or he may indicate the input data class, the output data class and the project class he is working on. If he indicates Read Set as the input data class, the system will list a large number of process classes and process instances which accept this input data class as an object property, direct or indirectly. For example, the system will include Sequence Assembly in the list, since it accepts Read Set as an object property, as well as Sequence Alignment, which accepts any sequence as an object property, including Read Sets. If the user indicates Contig Set as output data class, the assistant will restrict the possibilities and will only display a tree with Sequence Assembly as process class and
Phrap and CAP3 as process instances. If the user is still in doubt, he may indicate the project class he is working on. In our example, the project type is Complete, which implies that Phrap is the best process.
Figure 1 - The workflow management system interface. The goal of the next step is gene prediction, which may be carried out using different process instances, such as Glimmer and ORF Finder. The user may indicate Contig Set as input data class, ORF Nucleotide Sequence Set as output data class and Complete as project type. The assistant will suggest Glimmer as the best option. The next task is to compare the ORFs, generated by the previous step, with NR [14], an amino acid sequence public database. The user has to choose ORF Amino acid Sequence Set as input data class, NR as resource instance (using the Resource View) and Alignment Set as output data class. The assistant will display Sequence Alignment / Global Alignment / ssearch and Sequence Alignment / Local Alignment / BLAST and FAST as possible processes. The researcher will have to choose between global and local alignment. This choice is left entirely to the researcher, i.e., it does not depend on the input/output data class and quality properties. Suppose that the researcher chooses local alignment. Then, he has to decide between BLAST and FAST. The system may help him by displaying the performance and fidelity quality properties, which indeed indicates that BLAST is faster, but it is less precise than FAST. The researcher may indicate weights for each quality property that differentiates BLAST and FAST. The assistant computes the punctuation of each process and indicates the best process class. Suppose that the researcher chooses high for performance and low for fidelity. In this case, the assistant will indicate BLAST, which
has five process instances. As the input data class and the resource class are amino acid sequence sets, the assistant will indicate BLASTP as the best possibility. The researcher may also want to compare the ORFs with the SWISSPROT resource. This comparison may use BLASTP since the input and output data classes are both amino acid sequence sets. To conclude, we observe that the last two comparisons may be executed in parallel, since they use different databases. The workflow optimizer will automatically detect this alternative and modify the workflow appropriately. Additionally, the optimizer may decide to pipeline the composition of Glimmer and BLAST. That is, the ORFs resulting from Glimmer are immediately passed to BLASTP, without having to wait for Glimmer to produce the full set of output sequences.
5. Conclusions We first argued that it becomes interesting to define a Bioinformatics ontology that captures the major Bioinformatics data and process characteristics. This ontology is used to create a workflow management system that will help researchers define, optimize and execute their workflows. This system can be positioned as a new layer over a system that integrates Molecular Biology data resources and processes, such as Bio-AXS [15], that already contain the necessary infrastructure, that is, Bioinformatics process instances and input and output data instances. Large molecular biological ontologies already exist, such as Gene Ontology [16] and EcoCyc [17], which provide consistent definitions and interpretations of biological concepts. In addition, there are Bioinformatics ontologies, such as that discussed in Section 3 or used in the myGrid Project [18], that define knowledge of Bioinformatics processes and their input and output data type. myGrid is a project targeted at developing open source high-level middleware to support personalized in silico experiments in Biology on a (computational) Grid. Our assistant uses an ontology to guide the researcher during the process of workflow definition, whereas the myGrid components use an ontology to classify and retrieve services and workflows registered in the myGrid catalog. Acknowledgments. We would like to thank Paulo Ferreira, Orlando Martins, Marcelo Bertalan, Marcelo Alves and Wim Degrave, for the many discussions. This work was partially supported by CNPq under grant no. 141938/2000-5 for Melissa Lemos.
References 1. D.K.Casey, Human Genome Program, U.S. Department of Energy, Genomics and its Impact on Science and Society: A 2003 Primer, (2003), http://www.ornl.gov/sci/techresources/Human_Genome/publicat/primer/index.shtml. 2. J.Kim, Computers are from Mars, Organisms are from Venus, Computer, 35(7) (2002), 2532.
3. S.F.Altschul, W.Gish, W.Miller, E.W.Myers, and D. J. Lipman, A basic local alignment search tool, Journal of Molecular Biology, 215 (1990), 403-410. 4. Workflow Management Coalition (WfMC), Workflow Management Coalition Terminology and Glossar, Technical Report WFMC-TC-1011 3.0. Brussels, (1999). 5. N. Guarino, Formal Ontology and Information Systems, Formal Ontology in Information Systems, Ed. Amsterdam, Netherlands: IOS Press, (1998). 6. M.Lemos, L.F.B.Seibel, M.A.Casanova, BioNotes: A System for Biosequence Annotation, DEXA Workshops, (2003), 16-20. 7. Department of Biochemistry and Molecular Biology, Oswaldo Cruz Institute, (2004), http://www.dbbm.fiocruz.br. 8. Department of Medical Biochemistry, Federal University of Rio de Janeiro, (2004), http://www.bioqmed.ufrj.br/. 9. OWL Web Ontology Language Overview. W3C Proposed Recommendation 15 Dec 2003. D. L. McGuinness and F. v. Harmelen eds. http://www.w3.org/TR/owl-features/. 10. P. Green, Documentation for Phrap, March 2003, http://bozeman.mbt.washington.edu/phraps.docs/phrap.html. 11. X.Huang and A.Madan, CAP3: A DNA sequence assembly program, Genome Research, 9 (1999), 868-877. 12. B.Boeckmann, et al., The SWISS-PROT protein knowledgebase and its supplement TrEMBL in 2003, Nucleic Acids Research, 31 (2003), 365-370. 13. B.Ewing, et al., Base-Calling of Automated Sequencer Traces using Phred. I. Accuracy Assessment, Genome Research, 8 (1998),175-185. 14. National Center of Biotechnology Information, The BLAST Databases, (2004), ftp://ftp.ncbi.nih.gov/blast/db/. 15. L.F.B. Seibel, S.Lifschitz, A Genome Database Framework, DEXA (2001), 319-329. 16. Gene Ontology, (2004), http://www.geneontology.org/. 17. Encyclopedia of Escherichia coli K12 Genes and Metabolism, (2004), http://ecocyc.org/. 18. R. D. Stevens, A.J.Robinson and C.A.Goble, myGrid: personalised bioinformatics on the information grid, Bioinformatics, 19 Suppl. 1, (2003), (Eleventh International Conference on Intelligent Systems for Molecular Biology). 19. T. Kulikova, et al, The EMBL Nucleotide Sequence Database, Nucl. Acids. Res., (2004) 32, D27-D30. 20. S. Rudd, Expressed sequence tags: alternative or complement to whole genome sequences?, Trends in Plant Science (2003), 8 (7), 321-329. 21. W. R. Pearson and D. J. Lipman, Improved Tools for Biological Sequence Comparison, (1988), PNAS 85, 2444-2448.