Papers in Physics, vol. 10, art. 100004 (2018) www.papersinphysics.org Received: 7 September 2017, Accepted: 1 March 2018 Edited by: A. Mart´ı, M. Monteiro Reviewed by: E. Arribas, Universidad de Castilla La Mancha, Albacete, Spain Licence: Creative Commons Attribution 4.0 DOI: http://dx.doi.org/10.4279/PIP.100004
ISSN 1852-4249
Open-source sensors system for doing simple physics experiments ´ Gonz´alez,2 Manuel A. ´ Gonz´alez3∗ C´esar Llamas,1 Jes´ us Vegas,1 Miguel A. An open-source platform to be used in high school or university laboratories has been developed. The platform permits the performance of dynamics experiments in a simple and affordable way, combining measurements of different sensors in the platform. The sensors are controlled by an Arduino microcontroller, which can be wirelessly accessed with smartphones or tablets. The platform constitutes an economical sensing alternative to commercial configurations and can easily be extended by including new sensors that broaden the range of covered experiments.
I.
Introduction
We have designed and constructed a low cost platform that can be used to do simple physics experiments combining different sensors’ data easily. The purpose of this work consist in implementing a cheap system that can be used in high schools and universities regardless of their budget in diverse experiments, allowing a higher customization than equivalent commercial sets.
II.
System description
The initial requirements of the system are affordability, simplicity, flexibility and extensibility. Under the affordability requirement, we have decided to employ systems that can be easily found on the Internet at low prices. Simplicity means that users ∗ E-mail:
[email protected]
1
Departamento de Inform´ atica, Universidad de Valladolid, 47011 Valladolid, Spain.
2
Departamento de F´ısica de la Materia Condensada, Universidad de Valladolid, 47011 Valladolid, Spain.
3
Departamento de F´ısica Aplicada, Universidad de Valladolid, 47011 Valladolid, Spain.
with little to no training can easily use the system in physics experiments without difficulty, but also, that its construction does not require special skills. Flexibility implies that the system should be portable enough to work on different types of experiments. Finally, its extensibility will allow users to include additional sensors in the platform to enhance its capabilities and to use it in new experiments. In order to obtain an innovative platform as well as to add sharing features to it, almost exclusively open-source hardware and software components are used. Within this approach, the physics teacher community can work in open projects that can be used by other teachers, thus reducing the work of designing experiments with the platform. Following this condition, the characteristics of the system are published under a public GNU license in the GitHub repository [1]. All the technical details of the platform hardware and software are detailed in that repository: software code, assembling diagrams and technical characteristics of the components. We initially decided to include sensors in the platform that measure kinematic magnitudes: accelerometer, gyroscope, distance sensor and lightgate sensors. Other sensors, such as a magnetome-
100004-1
Papers in Physics, vol. 10, art. 100004 (2018) / C. Llamas et al. [2] and they comprise the following elements:
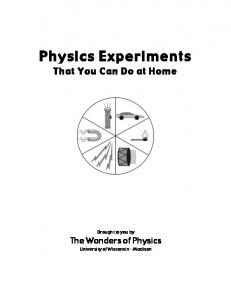
Figure 1: A conceptual diagram showing the main components of the system. It comprises a mobile unit that includes several sensors (su , sv , ...) controlled by an Arduino board and a portable unit with a Raspberry Pi that communicates with the Arduino and establishes a Wi-Fi network. It can also host additional sensors (sx , sy , ...). The measurements of all the sensors can be transferred into the users’ devices as series of vectors M via a web front-end implemented in the Raspberry Pi.
ter, a barometer, a thermometer, etc., can be easily added later. Figure 1 shows a diagram of the use of the platform in a physics experiment: the platform includes a mobile unit, which can be attached to a mobile body, containing sensors (su , sv ,... in the figure) and a portable unit responsible for the Wi-Fi connection that allows the user to access the measured data, but which can also include additional sensors (sx , sy ,... in the figure). Measured data are collected by the portable unit and organized in vectors (M = (ti , xi , ...)) in the figure) also containing the time stamp of the measurements. Whenever it is desirable and possible, the mobile unit can be attached to a body in order to study its movement. Then, the connection between the mobile and the portable units must be based on wireless communications, allowing the studied body and the attached unit to move freely. In our case, communications between the mobile and the portable units are performed via Bluetooth. The design of the mobile and the portable units was based on previous works of embedded systems
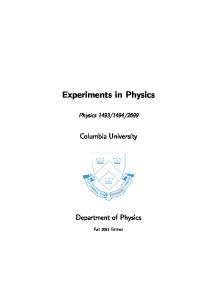
• Mobile unit: An Arduino Nano v3 controls a set of sensors. The version that has been tested in laboratory experiments included an infra-red line tracker, a motion processing unit consisting of 3-axis accelerometer, gyroscope and an ultrasound distance sensor. The ATMEL serial interface of the microcontroller is connected to a HC-SR06 Bluetooth device. A LiPo battery supplies power to all the system. In its current design, the motion processing unit can be replaced by a similar one that also includes a 3-axis magnetometer together with the accelerometer and gyroscope which would permit to have a inertial measurement unit with 9 degrees of freedom. This system is programmed in Arduino 1.6 [3] and it implements a simple protocol through a serial wireless connection, which is established by using Bluetooth connectivity that allows the initialization of the microcontroller as well as starting and stopping data acquisition. The main speed limitation in data measurements of the system is due to the Bluetooth connection. Figure 2 (top) shows an implemented mobile unit used in some physics experiments described below. • Portable unit: It consists of a Raspberry Pi2 with Raspbian Jessie [4] as an operating system. The core process of the unit is programmed in Go [5] and it governs the overall system as well as offering a web front-end. This unit supports the Wi-Fi and bluetooth connections. The data recorded in the measurements are stored in a SD card, constituting the local persistent storage unit. These data can be accessed and retrieved by the users’ laptops or smartphones via Wi-Fi connection. Additionaly, the portable unit can also allocate other wired connected sensors using the GPI of the Raspberry Pi. In the current configuration of the system, four infrared emitter-receivers are connected to it. These can be used, for example, to measure instant speed at different points along the trajectory of a body. The unit can be powered by an ordinary USB battery, allowing to do physics experiments outside the laboratory. Figure 2 (bottom) shows the portable unit.
100004-2
Papers in Physics, vol. 10, art. 100004 (2018) / C. Llamas et al.
Figure 2: Mobile (top) and portable (bottom) units of the system. Portable unit shows the connections of four additional infrared sensors attached to it (connections A, B, C, and D in the figure).
III.
Use in the laboratory
The system described above can be used in different ways in the physics laboratory depending on the users’ skill and knowledge of physics. We have tested the platform in two basic experiments: an air track in order to study an uniformly accelerated movement and a pendulum to analyze periodic motion and to obtain the gravity acceleration. Figure 3 shows the mobile and portable units being used in the air track experiment. In this experiment, the mobile unit included a 3-axis accelerometer, a 3-axis gyroscope and an ultrasonic distance sensor. In addition, four static infrared beacons were placed at fixed points of the trajectory and connected to the portable unit. The sampling frequency was about 25 samples/s (∆t ≈ 0.0394 s). This frequency was the result of a compromise between the measuring capabilities of the Arduino and the data communication limitations between the Arduino board and the Raspberry, using the bluetooth connection. With the arrangement of sensors used in the experiment, users can measure the cart acceleration (accelerometer), average velocities between different points (infrared beacons), and the change in the position with time (ultrasound sensor and infrared beacons). From the data
Figure 3: Photography of an air track experiment using the platform. While the mobile unit is on the moving cart, the portable unit stays on the table with four static infra-red beacons connected to it.
recorded by the different sensors, the user can analyze the uniformly accelerated movement and the relationships between kinematics magnitudes. On the other hand, in a pendulum experiment, users can combine the accelerometer and gyroscope measurements to study the acceleration and speed in different points and the periodic dependence of both magnitudes. Infrared beacons can also be used to measure the passage of time at different points of the pendulum trajectory and enrich the physical measurements. See [6] for more details on an air track experiment. Recorded data are stored in the SD card as a plain CSV file with data of all the sensors used in the experiment. The CSV files are transferred to the users’ computer or mobile devices using the Wi-Fi established by the portable unit. The rows of the CSV file are tagged with the acquisition time, in order to ease the analysis of the data by simply importing the file on any spreadsheet program. Figure 4 shows some results of the measurements with the air track. The measurements of the ultrasound distance sensor and the component of the accelerometer along the direction of the movement are represented as a function of time. From the data shown there, it can be observed how the experimental noise of the ultrasound sensor increases noticeably with the distance to the reflecting screen. We have checked this noise and, according to our exper-
100004-3
Papers in Physics, vol. 10, art. 100004 (2018) / C. Llamas et al.
1
IV.
14 Distance Acceleration az
0.9
Discussion
12
A cheap open-source system to be used in simple experiments has been developed. It comprises the 0.7 hardware and software of a sensorized platform. 8 0.6 The technical characteristics and the control soft0.5 6 ware of the system can be downloaded for free from 0.4 the Github repository [1]. The system permits the 4 0.3 measurement of different magnitudes in the same 2 experiment and the analysis of various phenomena. 0.2 0 The electronic components used in the system can 0.1 average acceleration a=-0.2 m/s be acquired on the Internet by less than 100e, and 0 -2 52 54 56 58 60 62 additional cheap sensors can be also included. Unt (s) like commercial sensor systems, this one constitutes an extensible and customizable platform that can Figure 4: Example of combined data recorded with the be modified by adding other sensors and includplatform in an air track experiment. The dependence ing other software characteristics. The use of the of the distance and the acceleration along with the di- Githup repository also allows the collaboration berection of movement recorded in the same experiment tween users that can add new characteristics to the are shown jointly. platform. 0.8
y=0.8 - (1/2)(0.2)(t-56.75)2
Acceleration (m/s2)
Distance (m)
10
iments, it is due to the air exiting from the air track Acknowledgements - This work has been supholes. Reducing or eliminating the airtrack pumping, that noise drastically decreases, as well as when ported by University of Valladolid teaching innovathe distance between the sensor and the reflecting tion program under grant PID2016 82. screen decreases. This can be seen as a possible limitation of the used sensor, which can be solved ´ ´ using, for example, an optical distance sensor. The [1] C Llamas, J Vegas, M A Gonz´alez, M A Gonz´ a lez, superposition of the data from the accelerometer https://github.com/percomp/OSHIWASP, and distance sensors allows a clear identification of last accessed September 4, 2017. the collision events between the cart and a rubber band at the end of the air track. From the [2] C Llamas, M A ´ Gonz´alez, C Hern´andez, J Vediference in distances reached after consecutive regas, Open source hardware based sensor platbounds (marked as example in the figure) users can form suitable for human gait identification, obtain the restitution coefficient of the collision. Pervasive Mob. Comput. 38, 154 (2017). Complementary, from the accelerometer data, users can obtain the change in speed during each collision [3] https://www.arduino.cc/en/Main/Software, and compare that result to the one obtained by last accessed September 5, 2017. analizyng the maximum distance before and after [4] https://www.raspbian.org/, last accessed the bounce. As an illustrative result, a parabolSeptember 5, 2017. 2 lic curve y = 0.8 − (1/2)0.2(t − 56.75) is shown in the figure. The distance 0.8 was chosen to dis- [5] https://golang.org/, last accessed September place a little the theoretical curve upwards over the 5, 2017. experimental points for clarity. The acceleration ´ Gonz´alez, A G´omez, M A ´ Gonz´alez, 0.2 m/s2 corresponds to the average acceleration [6] M A measured by the accelerometer sensor as shown in Smartphones in the air track, examples and the figure. The agreement between different sendifficulties, (unpublished). sor data can help users to investigate relationships between different magnitudes in an experiment. 100004-4