Open Source Software as Lead User’s Make or Buy Decision: A Study of Open and Closed Source Quality
Jennifer Kuan Stanford Institute for Economic Policy Research Stanford University, 94305 650-724-4371
[email protected]
Abstract: Contributions to open source software are motivated by many different incentives, some of which provide the basis of supporting institutions, and others of which help mitigate free-riding. In this paper, I consider the idea that programmers are driven to write software for their own use. Own use as a motivation helps explain patterns of open source founding and participation at the industry level. The analysis also predicts that when open source programs are founded, software quality will surpass that of comparable closed source programs. This quality prediction is tested, and supported, using bug resolution rates as a proxy for quality, or quality improvement.
Introduction
Open source programmers make their software available, free-of-charge, on the Internet. Some firms, like Microsoft, have reacted by dismissing open source as irrelevant; others firms have been surprised, sometimes unpleasantly, by open source quality. For example, open source Apache has, by some accounts, exceeded Netscape among installed web server programs (Netcraft, 2001), and Apple Computer now uses an open source “kernel” in its famously proprietary operating system. The wide variety of reactions that open source software has drawn from established technology firms reveal not just confusion, but also the growing importance of open source as a source of competition. What drives this important, yet puzzling, phenomenon? A number of reasons have been given for open source “volunteerism”, by economists and by open source developers themselves. As helpful as these various insights are to explaining the stability of open source institutions, I will argue that analyzing the open source phenomenon using a user-innovation framework, as developed by von Hippel (1988), yields useful predictions about open source competition and quality. Because open source institutions help non-competing software users collaborate, user-led innovation takes place on an unprecedented scale, making possible a statistical study of theoretical predictions. In particular, comparing user-led innovation with the closed source business model reveals that open source has an advantage under some, but not all, market conditions. That is, open source will likely appear in certain markets but not in others. Indeed, I argue that it was a change in market conditions, brought on by the widespread
2
use of the Internet, which has caused the recent explosion of interest in a 20-year-old open source model. Also, where open source programs do arise, they will be of higher “quality” than closed source programs would be. Acknowledging the difficulty of defining, measuring, and comparing quality, I nevertheless propose the rate of improvement as a proxy for quality, and provide a statistical comparison between open source and closed source rates of “bug fix” times (or, more precisely, the rate of resolution of service requests). Using three matched pairs of programs, I find support for the hypothesis that open source programs produce higher “quality” than closed source programs.
I.
A brief background on open source
Open source software has also been called “freeware” because it can be downloaded from the Internet free of charge, and also because the users who download the software are free to use the software however they like, which includes being able to modify the software to fit a particular need. However, to change software requires changing its source code, the human-readable version of software that gets compiled into machine-readable object code. The term “open source” thus refers to the source code and distinguishes the open source development of code from proprietary, closed source development, where consumers must purchase a license to execute the object code. Note, also, that open source software is different from “share-ware,” software whose object code is downloadable free of charge. In some cases, individuals write programs and then post them on the Internet for others to use. Along with the program is
3
often a request for $5 or an amount equal to the consumer’s willingness to pay (e.g., McAfee Associates, see Shapiro and Varian, 1999, p. 90). Another common use of shareware is as a marketing tactic. Software producers often put demonstration versions of their software on the Internet for free download, but these “demo” versions are limited in functionality. Allowing users to download this software gives prospective customers a chance to evaluate the software before buying (licensing) it (Shapiro and Varian, 1999). An early, well-documented example of an open source program is GNU, started in 1984 by Richard Stallman. Stallman began his experiment in open source software by writing a printer driver for the MIT computer lab where he was working. He felt that if the printer’s manufacturer had made the driver source code available, he could have modified it to work with his computer, rather than write a new driver. More generally, he reasoned that copyrights, which protect source code (but not its functionality1), restrict users’ freedom to use and modify software. As an alternative to copyrighting, Stallman created the General Public License (GPL), in which he defines “copyleft.” Copylefted software may not restrict users’ ability to use, distribute, or modify software. The one restriction on users is that modifications to software be made publicly available.2 In the modern practice of open source software, programs are available for download from the Internet. Users download, use, and modify programs if they wish, and report bugs to an on-line bulletin board. Modified software gets re-posted to the Internet
1
A copyright is not infringed if a program accomplishes a task, using original, independently created source code. From the Gates Rubber Co. v. Bando Chemical Industries, Ltd. case (1993), “The main purpose or function of a program will always be an unprotectible idea,” (Goldstein, 1997). Thus, a programmer can legally “copy” a copyrighted piece of software by independently recreating its functionality. 2
Heffan (1997) discusses the enforceability of this contract.
4
for others to download and improve further. In this way, improvements and innovations are accumulated in the latest version of the software for everyone to use.
II.
Example: The Apache Group
The history of The Apache Group illustrates the formation and functioning of a more recent open source program, Apache. In 1993, software programmers at the National Center for Supercomputing Applications (NCSA) at the University of Illinois developed the Mosaic web browser as public domain software. A complementary program, a web server, was also being written for the public domain, but was abandoned in mid-1994 before completion. Users of the incomplete web server nevertheless continued to use and fix up the program. In late 1994, a group of eight users got together to assemble all available documentation and bug fixes into a consolidated “patch” to the program. The group named the resulting patched up software “A patchy Web server,” a name that evolved to “Apache”. Co-founder Brian Behlendorf describes the situation this way: Apache started with a group of webmasters sharing patches to the NCSA web server, deciding that swapping patches like so many baseball cards was inefficient and error-prone, and electing to do a separate distribution of the NCSA server with their patches built in...Going back to Apache’s early days: those of us who were sharing patches around were also sending them back to NCSA, hoping they’d be incorporated, or at the very least acknowledged, so that we could be somewhat assured that we could upgrade easily when the next release came out. NCSA had been hit when the previous server programmers had been snatched away by Netscape, and the flood of e-mail was too much for the remaining developers. So building our own server was more an act of self-preservation than an attempt to build the next great web server. (p. 158, Behlendorf, 1999)
5
The Apache Group has since grown in size, and more than ten for-profit companies have sold Apache software bundled with support services. By some accounts, the Apache program has a majority share of the web server market, beating out both Microsoft and Netscape (see the Netcraft survey, http://www.netcraft.com/survey/). While putting the software into the public domain would have kept the software freely available, The Apache Group also wanted to continue incorporating patches, and therefore applied the copyleft idea to Apache. The Group created a web site containing a description of the software and the copyleft, as well as downloadable source and object codes. They also created an electronic bulletin board where people could report bugs, request changes, and post bug fixes. This infrastructure, combined with a well-defined revision process, allows user feedback and improvements to get incorporated into stable releases, starting with Apache 1.0, released on December 1, 1995. From the Group’s web site: Our primary method of communication is our mailing list... We discuss new features to add, bug fixes, user problems, developments in the web server community, release dates, etc. Anyone on the mailing list can vote on a particular issue, but we only count those made by active members or people who are known to be experts on that part of the server. Vetoes must be accompanied by a convincing explanation. New members of the Apache Group are added when a frequent contributor is nominated by one member and unanimously approved by the voting members. Furthermore, Apache is an organic entity; those who benefit from it by using it often contribute back to it by providing feature enhancements, bug fixes, and support for others in public newsgroups. The amount of effort expended by any particular individual is usually fairly light, but the resulting product is made very strong.
In June 1999, the Apache Group was formally incorporated as The Apache Foundation, a not-for-profit corporation.
6
III.
Reasons for volunteerism
The founders of GNU and Apache give some indication as to what drove them to found open source programs. Creating software for one’s personal use, in Stallman’s case, and “self-preservation” in Behlendorf’s words, are among perhaps several different reasons. Some programmers work on open source projects for ideological reasons. For example, Eric Raymond (2000) contributes to open source programs out of a conviction that software should be free, while the founder of open source Gnome, Miguel de Icaza, wants to help users by creating an open source Microsoft competitor (Weber, 2000). Lerner and Tirole (2000) argue that programmers’ volunteer their code in the hopes of getting a well-paying programming job. While many motives for participating in open source projects may exist even within a single individual, I wish to explore, in greater depth, own use. Stallman and the Apache founders wrote or fixed software that they intended to use themselves. Similarly, a survey of Linux developers (Hermann, Hertel and Niedner, 2000) finds that the top reason for contributing to Linux is to “facilitate my daily work due to better software.” Own use seems to motivate the founding of new open source projects and participation in existing open source projects. Examining own use as a motive for open source contribution also has theoretical antecedents. First, von Hippel (1988) gives many examples of user-led innovation, where customers develop innovations that they sometimes share with their suppliers. This idea is later applied to open source software (von Hippel, 2001). The notion of customers producing their own innovations is taken to an institutional level by Kuan (2001), who
7
argues that consumers at times have the information to organize themselves to produce collectively. In particular, buyers sometimes have more information about demand than sellers; information which von Hippel’s examples characterize as “sticky” (von Hippel, 1998). It is at the institutional level where open source takes on competitive importance. Because institutions facilitate the aggregation of open source development effort, open source programs are able to compete directly with products from large firms. Open source institutions such as hierarchy (Metiu and Kogut, 2001; Lee and Cole, 2000), and rules (e.g., copyleft and voting rules) bring order to a seemingly anarchic process. Meanwhile, reciprocity (Lakhani and von Hippel, 2000), and reputation or status (Lerner and Tirole, 2000; Raymond, 2000) encourage participation and help to mitigate freeriding. The resulting open source programs rivals closed source offerings from firms like Sun Microsystems and Microsoft.
IV.
Theoretical predictions based on own use as motive
In von Hippel’s (1988) studies of lead-user innovators and Kuan’s (2001) study of operagoers, consumers act on information that they have but that their suppliers lack. This private information results from proximity to the problem, in von Hippel’s case, and from powerful social institutions that provide wealthy consumers with knowledge about other wealthy consumers, in Kuan’s example. In open source software, formal agreements, like the copyleft, voting procedures, and membership, combine with the technology of the Internet to provide a foundation for
8
programmer communication, interaction and, ultimately, collaboration. In addition, powerful, un-codified, social institutions also contribute to encourage participation, and to some extent, mitigate free-riding. Taken together, open source software institutions give software users a means of producing their own software on a scale that competes with proprietary software.
a. The institutional scale of open source
Indeed it is the scale of production, however, that is important. When Richard Stallman first started his own open source programs 20 years ago, the costs of communicating were higher than they are today, now that Internet access is widespread. “...I put [GNU Emacs] on the anonymous ftp server on the MIT computer that I used. But at that time, many of the interested people were not on the Internet and could not get a copy by ftp...So I announced that I would mail a tape to whoever (sic) wanted one, for a fee of $150,” (Stallman, 1999, p. 58). Increased Internet access has coincided with increased open source activity, among existing programs such as Stallman’s and with new programs like Linux and Apache, because the Internet has lowered communication and collaboration costs. The success of open source efforts is thus due to the enabling technology of the Internet, though this was difficult to predict in the early years of the Internet’s rise. Thus some earlier open source programs were developed by individuals for only their own use, much in the spirit of von Hippel’s lead-users. Raymond (1999) describes the growth of very successful programs as somewhat serendipitous, “[T]he best hacks start out as
9
personal solutions to the author’s everyday problems, and spread because the problem turns out to be typical for a large class of users.” With the means of collaboration now better established, the decision to create software for one’s own use begins to depend also on other potential user-contributors; in particular, how many and how interested in collaborating they are. Behlendorf (1999) recommends a market assessment before launching an open source effort. “So an analysis of the market demand for a particular open-source project also involves joining relevant mailing lists and discussion forums, cruising discussion archives, and interviewing your customers and their peers; only then can you realistically determine if there are people out there willing to help make the project bear fruit.” Dalle and Jullien (2001) simulate this very calculation to better understand what sorts of open source projects are likely to be initiated.
b. The closed source alternative to open source
The fact that some open source programs rival closed source programs suggests another factor in deciding whether to write one’s own software, a factor that open source programmers take for granted: the ability of existing closed source programs to meet one’s needs. Some open source programs start out as solutions to programmers’ problems that have been entirely unanticipated by closed source firms. For example, the printer driver for Stallman’s printer simply did not exist, so he wrote the driver himself. Apache’s founders were using Apache before Netscape’s closed source web server was available. Other open source programs attract users and contributors by better meeting
10
certain needs. Contributors made Linux more “portable” (i.e., able to run on a greater variety of hardware platforms) than existing closed source operating systems, and, by some accounts, more “robust” (i.e., less likely to crash). Thus, before an open source program is even considered, a programmer must encounter a problem to solve. Whether such a problem ever arises depends on closed source software firms, and what they produce. As profit-maximizing firms, closed source providers might well stop short of meeting the needs of all its customers. A profitmaximizer might never write a particular, little-used printer driver, given the willingness to pay of the handful of customers who need the program. A closed source producer of Unix, like Solaris or HPUX, might be uninterested in portability because its software is factory-installed on its computers. On the other hand, some markets for software are large enough to provide closed source firms the incentive to meet the needs of its customers. For example, “application software” firms customize and install a combination of complex programs for their large, corporate customers. Also, “office suite” software serves such an enormous market for spreadsheet and word-processing programs that the profit-maximizing level of quality is high, and at a price that satisfies even potential open source programmers.
c. The open source decision for programmers: where to expect open source programs
If open source software is in large part a phenomenon of users innovating for their own use, then the decision to address a need left unmet by closed source firms is a decision for programmers. This may seem obvious, but in fact, non-programmers do have free access
11
to the resulting open source products, and often contribute to program development by reporting bugs or requesting enhancements. Non-programmers just have no say in the decision to found an open source project. This is not to say that non-programmers never make this “make-or-buy” decision. On the contrary, the large corporate buyer of application software has a make-or-buy decision, just not the open source make-or-buy decision. We therefore consider the programmer’s decision within the context of market demand among other programmers and the quality of existing closed source software, i.e. market demand for closed source software. Analyzing this decision yields predictions about where open source software will arise and clarifies the relative strengths and weaknesses of open and closed source software. While it sometimes seems as though open source programs have sprung up in every possible software category, a closer look reveals a pattern.3 First, a programmer writes code to serve his particular purpose, typically a highly technical problem. Users who have the ability to program for their own use work in job functions that require programming skill, whether designing microprocessors, administering web sites, or programming hardware and software. Thus, if open source is the product of lead users creating for their own use, we would expect open source programs to serve technically sophisticated users who are able to program. Garzarelli (2002) discusses the phenomenon of common professional skills among open source participants.
3
Johnson (2001) offers a formal model of this open and closed source comparison, which yields similar predictions.
12
Second, programmers will choose to solve their own problem with an open source program only when closed source programs fall short. Closed source programs do fall short for many reasons, one of which is weak market demand. The market for a particular program might be small in number or in users’ willingness to pay. (Note that a user’s willingness to pay for software can be lowered by his own ability to program; because he knows he can write a program himself, he is willing to pay less for software than a nonprogrammer). We can therefore also predict that open source programs will be founded to serve fairly small markets that are under-served by closed source firms, at least at the time the open source program is founded. Table 1 lists open source programs which enjoy high demand (as measured by downloads from http://freshmeat.net/, 2000). Clearly, the most popular open source programs serve a technical market. The top four categories of open source programs are scripting languages (that allow users to write high-level “scripts” or programs), software development tools, web server and back-end mail programs, and operating systems. The first two types of programs, scripting languages and software development tools, are used by programmers. Web servers and mail tools are used by web site administrators, who, especially in the early days of the world-wide Web, were highly sophisticated users. Also, the number of users of these programs, while large today, was small when the programs were first established. Finally, operating systems are much more general in their use among software users, but the four programs listed in Table 1 are all Unix-type operating systems, which require a higher level of programming ability from the user than other operating systems, like Windows or MacOS.
13
The size of the market for these programs is much smaller in number than more universally useful programs such as a word-processor, or mail front-end. Moreover, the lack of incentive for profit-maximizers to supply this market is exacerbated by users’ ability to program and thereby serve their own needs. Thus, another set of commonly used open source programs, not listed in Table 1, include tools and libraries for computer hardware design. Users of this type of software number even fewer than users for the programs in Table 1, but they are also usually well-financed. In addition to interpreting patterns of open source success, the lead-user innovation approach also yields another prediction: what types of software will not be open source. Because the decision to found open source projects belongs to the programmer, non-programmers are left with closed source offerings that sometimes fail to meet users’ needs. For example, cost accountants want a spreadsheet program that supports three-dimensional spreadsheets. But if the market for three-dimensional spreadsheets is small, profit-maximizing closed source firms may choose not to supply that functionality. Here again is a case of small markets for a product and the failure of closed source firms to address a need. But since open source programmers have no use for three-dimensional spreadsheets, they will not produce an open source solution. Having just predicted that certain types of software will not be open source, either because closed source firms have sufficient incentive to produce high quality or because programmers have no interest, I must now address the fact that certain open source programs defy my predictions. For example, a firm called Helix Code produces open source office-suite software, including Gnome, a program to make Linux look like
14
Windows, Evolution, a Microsoft Outlook-like program, and Gnumeric, a spreadsheet program. Because the founder of Helix Code is motivated by ideology, the projects he has undertaken fall outside my predictions based own use as driving motivation. According to founder de Icaza, “We are going to level the playing field. This is about helping the consumer. This is for everybody,” (Weber, 2000). Certainly, programmers are motivated by many different incentives, including ideology. However, own use not only explains the broad patterns of open source development, it also suggests how open source development is financed. For example, Helix Code plans to generate revenues through support services for its open source code, while investors finance the code development. Ordinarily, a fine business plan, except that Helix Code’s product competes with a high-quality program for technically unsophisticated users, whereas Linux, for example, competed for sophisticated users. Should Helix Code’s revenues become a problem, investors will depart, taking with them their staff of programmers. Open source programs developed for own use do not face these prospects because contributors get paid to design microprocessors, but write open source code in the process.
d. “Quality”: A Prediction
Analyzing open source software in terms of innovation for own use allows for yet another prediction. In Kuan’s analysis of performing arts firms, consumers who organized to produce their own good achieved greater economic efficiency than a profit-maximizer
15
would because they had private information about demand. One interpretation of this improved economic efficiency is higher quality.4 In the context of performing arts, where consumer production results in a nonprofit organization, the prediction of efficiency and quality are very surprising. But such predictions in an open source context are somewhat less counter-intuitive, since the open source community has many vocal enthusiasts who make claims of both efficiency and quality (e.g., Raymond, 1999). Of course, the performing arts analysis cannot be applied to open source software without modification, since all performing arts firms are nonprofits, while all software is not open source. Nevertheless, it is still reasonable to predict higher quality by the “nonprofit” over the for-profit when the “nonprofit” exists, since the higher quality results from users’ ability to organize efficiently and exploit private information. In the next section, I offer an empirical test of this quality prediction, recognizing in advance the difficulty of defining, measuring, and comparing such a difficult characteristic as “quality.” High quality has many definitions, depending on the user. Some users want flexibility, others speed, ease-of-use, portability, robustness, and more. Different types of users are willing to trade off quality in one dimension for quality in others, and “quality” for one user might be entirely different from “quality” for another. Even if every important dimension of quality could be identified and measured, comparing programs could prove difficult. Is an easy-to-use but slow program “better” than a hard-to-use but flexible one? Because of the difficulties in comparing quality levels, I propose comparing rates of change in quality. In some sense, the comparison of rates of change amounts to a 4
In Kuan (2001), greater economic efficiency results in a higher level of production. However, the good is non-rival. One, though by no means the only, interpretation of this higher level of production is higher
16
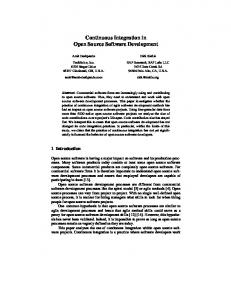
comparison of quality levels over time, which is interesting even if static quality levels could be compared. As a proxy for the rate of software improvement, I measure the rate of service request resolution, i.e., speed with which “bugs” get resolved. The term “bug” usually refers to a problem with a program’s functionality, but a large number of bugs are requests for adding functionality. So the length of a bug list itself is not a good measure of quality. Also, a long list of bugs might be a reflection of active bug discovery. By contrast, bug resolution rates are useful for comparison because bug databases, which are used to manage revisions, document the changes to a program from one revision to the next. Figure 1 illustrates the software improvement process, beginning with bug discovery, continuing with bug resolution, and finishing with the integration of bug fixes into the released version of software. The end-result of this process is the object of interest, the software’s “quality”, difficult to define, measure, and compare.
Bug Discovery
Integration Into Software
Bug Resolution
Quality
Figure 1: Software Improvement Process
Interestingly, both open and closed source projects use the same revision management techniques. This is perhaps not surprising since open source contributors are
quality.
17
often professional software or hardware developers and have carried over practices that help manage large development projects. This is not to say that open and closed source development is identical. Raymond (1999) describes closed source development as top down, its construction like that of a cathedral, and open source development as more horizontal, where participation is likened to a bazaar. However, revisions of both open and closed programs are formally stabilized and controlled using the same techniques, and involving bug databases. Mockus, et al (2000) documents the process for Apache, and Lee and Cole (2000) discuss the Linux process. Because open and closed source projects have important differences, a comparison, even of analogous processes, can be difficult, though I will argue, not necessarily invalid. One concern might be that closed source programs could be larger and more complex than open source programs, so adding a feature might be more laborintensive. This difference in the ease of improving a program relates to the architectural differences described by Raymond, between a cathedral and a bazaar, and is therefore endogenous to the organizational form, open source or closed source. Indeed one of the mechanisms by which open source software achieves superior quality might be its decentralized, modular structure. A second concern is that the bug discovery process is not measured, but the rate and quality of bug discovery might well affect the quality of the end-product. Actually, open and closed source bug discovery processes differ as much as open and closed source architectures. The closed source bug discovery process involves software developers testing the software, attempting to anticipate users’ needs. Open source bug databases include only problems (or requests) that users actually encounter. Thus, even though the
18
bug databases allow us to measure the bug discovery process (e.g., see Figures 2 and 3), the more relevant issue is how well the bug discovery processes address quality problems of users. In this regard, the open source process is at least as good as the closed source process, since the open source process uncovers bugs (or requests) that actual users care about, while the closed source process is only an approximation of actual user need.
V.
Empirical test
To compare open and closed source response rates, I assemble six separate bug databases from three pairs of software programs, including an open and closed source Unix operating system, an open and closed source web server, and an open and closed source user-interface program. In order to minimize the problems of comparability, I compare only similar programs, using a hazard rate model to estimate response rates.
a. Data
The six programs in my study were selected on the basis of data availability, limited mostly by what was available for open source programs on the Internet (web sites are listed in References). These include FreeBSD, an open source Unix operating system, Apache, a web server program, and Gnome, a graphical user-interface for Unix operating systems. The data from FreeBSD and Apache are a census of bugs found over the lifetime of the program, while the data from Gnome include only the bugs that were fixed over a (rolling) 12-month period. The closed source bug data come from proprietary
19
sources that produce software with the same functionality as the open source programs in the study: a Unix operating system, a web server program, and a graphical user-interface for Unix operating systems. Table 2 lists the time periods for which data was available. As a class of programs, web servers are relatively young. The data for web servers covers the life of both open and closed source programs, and both of which are of similar vintage: work on Apache started in early 1995 and on the closed source program six months later. Similarly, both open and closed source operating systems were spun off from the original Berkeley Unix, though at different times. All data for FreeBSD going back to 1994 was available, but for the closed source program, only data from the latest major revision was available. The data from the user-interface programs is somewhat less complete, and perhaps less comparable. First, only data on fixed bugs are available from the open source program, and less information is available about the history of the closed source program. The open and closed source programs were almost certainly initiated at very different times, with the closed source program enjoying a big head start. While differences exist in the bug resolution process, both across firms and between open and closed source, certain similarities remain that make that data comparisons meaningful. First, in all six databases, each bug is assigned a priority rating and a severity rating by the bug’s initiator. Ratings are on a scale of one to three (or one to four), with guidance given by each program regarding the value of the rating. For example, priority ratings include “high”, “medium”, and “low”; severity ratings are described as “critical”, “serious”, “non-critical”, and “wish-list”. Often, definitions further clarify ratings; for example, “critical” might be further defined as “important and
20
no work-around”. In addition to the specific guidance given by each program, open source contributors are usually well acquainted with closed source practices and so apply ratings consistently across projects. Figures 2 and 3 summarize bug counts for web servers and operating systems, showing the number of bugs found in each quarter for open and closed source programs and distinguishing among severity ratings. Thus far, I have argued that bug fix rates are a reasonable proxy for quality, and especially quality improvement, and that the data for open source and closed source bugs can be compared because they capture very similar processes for very similar products. These processes are documented for open and closed source and are similar for both. Also, contributors of bugs and their fixes often straddle open and closed source worlds and apply the same standards for ratings and systematic bug tracking for both types of projects. Therefore, what the data captures, the life of a bug from the moment it enters the database, is the same for open and closed source projects. Differences in bug response rates therefore arise from differences between differences between open and closed source systems, the former a response to users’ own needs, the latter an outcome of profit-maximization. Nevertheless, the bug counts in Figures 2 and 3 show how very different the open and closed source bug discovery processes are. First, notice that closed source bugs are more numerous than open source bugs. This difference cannot be interpreted unambiguously, because many bugs might indicate many problems with a program but they might instead suggest more thorough debugging. Also, as mentioned above, open source bugs are encountered only by use, while closed source bugs are found by
21
debuggers. Second, closed source bug discovery appears to be much more volatile than the low but steady open source rate. This volatility might have to do with the closed source business model, in which software upgrades contain batches of bug fixes and are released periodically.
b. Statistical Model
To compare bug life expectancies, I use a Cox proportional hazard model and do three pair-wise comparisons; one for each program type. The hazard is assumed to be h(t) = ho(t) exp (β1x1 +β2x2) where ho is the baseline hazard, xi are dummies for priority and severity, and βi are coefficients of xi. For each pair of programs, I graph the open and closed baseline hazards and produce a table of coefficients for the covariates, priority and severity, for open and closed programs. A high hazard rate indicates that bugs get fixed quickly, while a low hazard rate indicates that bugs get fixed slowly. A coefficient of greater than unity indicates that more severe bugs get fixed sooner than less severe bugs, and higher priority bugs are resolved more quickly than lower priority bugs.
c. Results
Figure 4 shows the baseline hazard rates of open and closed source web server programs. The baseline hazard of the open source program (darker line) is higher than the baseline hazard of the closed source program, suggesting that open source bugs are resolved more
22
quickly than closed source bugs. From Table 3, the coefficients of the covariates, we see that more severe bugs get fixed more quickly than less severe bugs. (There was no variation in priority ratings in the data for this program, with priority ratings all set at the default level). Figure 5 graphs the open source and closed source baseline hazards for operating systems. The baseline hazard curves for operating systems cross, with the open source curve (darker line) starting out above the closed source curve. This indicates that open source operating system bugs get fixed more quickly than closed source bugs to a point. Open source bugs that have been left unresolved for a long time are slower to get fixed than closed source bugs. (Note that data from the closed source program do not go back as many years as the open source program, so only open source data appear in the tail of the graph). Table 4 shows the coefficients for the two covariates, priority and severity. As in the case of web servers, the open source priority and severity, and closed source priority, coefficients are less than unity, indicating that higher priority and more severe bugs get fixed more quickly than lower priority and less severe bugs. However, for the closed source operating system, the coefficient for severity is greater than one, so more severe bugs take longer to fix than less severe bugs. The data available for the open source user-interface program is, unfortunately, much less comprehensive than that for the other two programs. My sample for the open source user-interface program contains only bugs that were fixed within the past 12 months. While I have a census of bugs for the corresponding closed source program, I select from that database only bugs that were fixed in the twelve-month period covered
23
by the open source data. Moreover, unlike the data for the web servers and operating systems, these data do not include bugs that have not yet been fixed; i.e. these data are not right-censored. Figure 6 shows the open source and closed source baseline hazard rates for userinterface programs (open source is the darker line). Here the closed source program has a higher baseline hazard rate than the open source program, suggesting that closed source bugs get fixed more quickly than open source bugs. Table 5 shows that there is no variation in the priority levels for the open source program, and that the priority level is not significant for the closed source program. The severity level coefficient for the open source program is less than one, indicating that more severe bugs get fixed more quickly than less severe bugs. However, the closed source coefficient for severity level is greater than one, as with the closed source operating system, suggesting that more severe bugs are fixed more slowly than less severe bugs. In summary, evidence from web servers and operating systems suggests that service requests for open source programs tend to be resolved more quickly than for similar closed source programs. The evidence from user-interface programs seems to indicate the opposite, with the closed source project responding more quickly than its open source counterpart. However, the data for user-interface programs are less complete than for the other two programs, and so the results are slightly less reliable.
VI.
Conclusion
24
The success of open source software has provided a number of intriguing questions for business scholars and economists. The rich documentation of several open source projects and the recent rapid development of new, supporting institutions allow us to observe in real time the creation of a new business model. Yet novelty does not prevent us from understanding and analyzing open source software. In fact, our understanding of lead-user innovation at the individual and institutional level allows us to predict the behavior of a seemingly anarchic and chaotic activity. I argue that open source programmers are motivated by many different incentives, but that writing software for one’s own use helps explain industry-level phenomena. In particular, I suggest that open source software should arise in technically sophisticated niches because people who write software for their own use most likely have jobs that require programming ability. Non-programmers face a more traditional make-or-buy decision; for example, large, non-technical firms hire application software firms to produce customized software. At the same time, open source programmers will eschew other software niches because they have no use for certain kinds of software or because other software needs are met by closed source software. I also predict open source programs to compete well against similar closed source programs because open source projects, where they arise, produce high quality. Practitioners often make this prediction of high quality, but here, quality stems from the economic efficiency of users organizing around private information to produce a good for themselves. I test this prediction using bug resolution data from three matched pairs of programs and find some support for the hypothesis that open source service requests get
25
resolved more quickly than closed source service requests, after controlling for priority and severity of each request. The evidence of superior open source quality raises interesting questions about the role of intellectual property rights in the innovation process. In the traditional view, patent law encourages inventors to disclose their innovations and thus provide a public good. Also, the monopoly rights conferred by a patent give inventors an incentive to invent, possibly leading to patent races (e.g., Gilbert and Shapiro, 1990). And weak property rights are blamed for the slow growth of the packaged software industry in Japan (Baba, et al, 1996). Yet this study of open source software presents an example of higher production without monopoly rights than with monopoly rights. Finally, institutional similarities between open source software and academic research have been documented (Tuomi, 2000). For example, both rely on peer review, status, and reputation. If open source software can be understood in terms of individuals creating for their own use, should also university-based research be? Such an analysis would inevitably affect how we view the university’s relationship with industry and government.
26
References Baba, Yasunori, Shinji Takai, and Yuji Mizuta “The User-Driven Evolution of the Japanese Software Industry: The Case of Customized Software for Mainframes.” In David C. Mowery, ed., The International Computer Software Industry. Oxford University Press, 1996. Behlendorf, Brian “Open Source as a Business Strategy.” In Chris DiBona, Sam Ockman, and Mark Stone, eds., Open Sources: Voices of the Open Source Revolution. Sebastapol: O’Reilly and Assoc., 1999. Dalle, Jean-Michel and Nicolas Jullien, “’Libre’ Software: Turning Fads into Instiuttions?” mimeo, 2001. Garzarelli, Giampaolo, “Open Source Software and the Economics of Organization,” mimeo, January 13, 2002. Gilbert, Richard and Carl Shapiro, “Optimal patent length and breadth.” RAND Journal of Economics, Vol. 21, (1990). Goldstein, Paul, Copyright, 2nd Edition. Little, Brown, 1997. Heffan, Ira “Copyleft: licensing Collaborative Works in the Digital Age.” Stanford Law Review, Vol. 49 (1997). Hermann, Stephanie and Guido Hertel and Sven Niedner, 2000, http://www.psychologie.uni-kiel.de/linux-study/writeup.html. http://apache.org/ http://freshmeat.net/ http://www.bugs.apache.org/index http://www.bugs.gnome.org/ http://www.freebsd.org/support.html\#gnats http://www.netcraft.com/survey/ Johnson, Justin P. “Economics of Open Source Software.” Mimeo, Johnson School of Business, Cornell University, May, 2001. Kiefer, Nicholas M. “Economic Duration Data and Hazard Functions.” Journal of Economic Literature, Vol. 26 (1988), pp. 646-679.
27
Kuan, Jennifer, (2001a) “The Phantom Profits of the Opera: Nonprofit Ownership in the Arts as a Make-Buy Decision,” Journal of Law, Economics, and Organization, 17(2). Lakhani, Karim and Eric von Hippel “How Open Source software works: “Free” user-touser assistance.” MIT Sloan School of Management Working Paper \#4117, May, 2000. Lee, Gwendolyn K. and Robert E. Cole “The Linux Kernel Development As A Model of Knowledge Creation.” Mimeo, University of California at Berkeley, October, 2000. Lerner, Josh and Jean Tirole “The Simple Economics of Open Source.” NBER Working Paper 7600, March, 2000. Metiu, Anca and Bruce Kogut, Distributed Knowledge and the Global Organization of Software Development, mimeo, February, 2001. Mockus, Audris, Roy T. Fielding, and James Herbsleb “A Case Study of Open Source Software Development: The Apache Server,” Proceedings of the 22nd International Conference on Software Engineering, ACM (2000), pp. 263-272. Netcraft, http://www.netcraft.com/survey/, 2001. Raymond, Eric “The Cathedral and the Bazaar.” http://www.tuxedo.org/~esr/writings/cathedral-bazaar/, 1999. ---, 2000 “Homesteading the Noosphere.” http://www.tuxedo.org/~esr/writings/cathedralbazaar/, 2000. Shapiro, Carl and Hal R. Varian, Information Rules. Harvard University Press, 1999. Stallman, Richard “The GNU Operating System and the Free Software Movement,” in Chris DiBona, Sam Ockman, and Mark Stone, eds. Open Sources: Voices of the Open Source Revolution. Sebastapol: O'Reilly and Assoc., 1999. Summerville, Ian, Software Engineering, Fourth Edition. Addison-Wesley, 1992. Tuomi, Ilkka “Learning from Linux: Internet, innovation and the new economy.” Mimeo, University of California at Berkeley, February, 2000. Valloppillil, V. “Open Source Software: A (New?) Development Methodology.” http://www.opensource.org/halloween/halloween1.html, 1998. Varian, Hal R. “Sequential contributions to public goods.” Journal of Public Economics, Vol. 53 (1994), pp. 165-186. von Hippel, Eric, The Sources of Innovation. Oxford University Press, 1988.
28
---, “’Sticky Information’ and the Locus of Problem Solving: Implications for Innovation,” Management Science, 40:4 (April), 429-439. ---, “Open Source Shows the Way: Innovation By and For Users—No Manufacturer Required!” Sloan Management Review, Summer, 2001. Weber, Thomas E “Here’s a Plan to End Microsoft’s Dominance (No Lawyers Needed).” Wall Street Journal, May 15, 2000.
29
Table 1: List of Successful Open Source Programs
Scripting Languages
Software Development Tools
• Perl
• GNATS
• PHP
• LessTif
• Python
• GCC • Emacs
Web server and Non-Front End Mail-Related Programs
• RPM
• Apache
• GDB
• Sendmail
• CVS
• BIND
Operating Systems
• Fetchmail
• Linux
• SMTP
• FreeBSD
• POP
• OpenBSD
• IMAP
• NetBSD
30
Table 2: List of Software Bug Data Availability
Program Type
Open Source Data
Closed Source Data
Web Servers
All bugs found 3/96 – 12/99
All bugs found 1/97 – 10/99
Operating Systems
All bugs found 9/94 – 2/00
All bugs found for a single version 1/97-6/99
User-Interfaces
All bugs fixed 2/99-1/00
All bugs found for a single version 1/97 – 6/99
31
Table 3: Hazard Covariate Coefficients for Web Servers
Severity Open
Priority
.926***
# of obs. 4853
(0.019) Closed
.863***
.922***
(0.014)
(0.025)
32
14538
Table 4: Hazard Covariate Coefficients for Operating Systems
Open
Closed
Severity
Priority
# of obs.
.911*
.875***
861
(0.050)
(0.045)
1.186***
.750***
(0.033)
(0.023)
33
1834
Table 5: Hazard Covariate Coefficients for GUIs
Severity Open
Priority
0.883**
# of obs. 1812
(0.052) Closed
1.121***
0.948
(0.030)
(0.033)
34
236
Figure 2: Web Server Bug Counts by Severity Rating Web Server Bug Counts by Severity Rating (First series closed source, second series open source) 3000
2500
2000
Severity 3 Severity 2
1500
Severity 1
1000
500
0
Quarter
35
Figure 3: Operating System Bug Counts by Severity Rating Operating System Bug Counts by Severity Rating (First series closed source, second series open source) 350
300
250
200
Severity 3 Severity 2 Severity 1
150
100
50
0
Quarter
36
Figure 4: Baseline Hazard Rates for Web Servers
37
Figure 5: Baseline Hazard Rates for Operating Systems
38
Figure 6: Baseline Hazard Rates for GUIs
39