Proceedings of the First International Conference on Automotive User Interfaces and Interactive Vehicular Applications (AutomotiveUI 2009), Sep 21-22 2009, Essen, Germany
Open Vehicular Data Interfaces for In-Car Context Inference Matthias Kranz and Eduard Weber
Korbinian Frank and Daniel Hermosilla Galceran
Technische Universität München Institute for Media Technology Arcisstrasse 21, 80290 Munich, Germany
German Aerospace Center (DLR) Institute of Communications and Navigation Oberpfaffenhofen, 82234 Wessling, Germany
[email protected]
[email protected]
ABSTRACT
We present three ways to access in-vehicle sensor data: first, using the standardized vehicle diagnostic bus, providing only limited data which can be used e.g. as ground truth (e.g. for the vehicle speed), second, using our developed general purpose data interface and third, using vision-based OCR of the vehicle’s debug system. The latter is part of nearly all vehicles and is intended to provide an easier-touse access than the vehicle manufacturer’s full diagnostic tool set. We integrate data from all three interfaces to develop context-sensitive driver user interfaces. So far, nearly all user interface components in a vehicle are static: the tachograph (even if displayed on a pixel-based screen instead of being an analog meter), the gear information, and many more. The set of information is never adapted, e.g. in case of potentially hazardous situations, such as driving at high speeds and using the high beam lights at the same time which could indicate another driver changing lanes and obstructing the way for the ego vehicle. Neither is the sound volume of the stereo adapted, nor the telephone muted and incoming calls silently blocked. Kern et al. [8] showed the benefits of integrating context information in the driver assistance systems for providing better user interfaces. We extend this concept to different types of sensors and a broader application range.
In this paper, we present a concept for an open vehicular data interface and describe it’s components and architecture. We discuss the enabled applications in the context of advanced driver assistance systems with a focus on humanmachine interfaces, vehicle-to-x (V2X) communication and context inference systems. We conclude by a presentation of the initial implementation and deployed system.
Categories and Subject Descriptors H.4 [Information Systems Applications]: Miscellaneous; H.3 [Information Storage and Retrieval]: Systems and Software
General Terms Algorithms, Measurement
Keywords vehicular interfaces, context awareness, context inference
1.
INTRODUCTION
Modern vehicle comprise hundreds of sensors, various communication busses and significant processing power, comparable to a modern personal computer. These systems have immense untapped potential for advanced driver assistance systems (ADAS) and context-aware systems and many more innovative automotive applications. Unfortunately, access to the in-vehicle sensors requires the knowledge of restricted information, such as the CAN matrix. This information is only available to vehicle manufactures and not the the general research community. We therefore are investigating how interested researchers could interface their research vehicles without the need of a full CAN access. This, we think, significantly leverages research in the area of automotive user interfaces and V2X communication.
2.
ACCESS TO RAW DATA
In this section, we introduce three ways of open data access in vehicles that can be used to elicit sensor information.
2.1
OBDII Interface
OBDII and EOBD [13] are standardized interfaces for vehicle diagnostic. Tab. 1 summarizes selected sensors and their meaning w.r.t. to vehicle diagnostics. As we will see later, more meaning and context information can be elicited from this data. The inferable meaning is additionally enlarged by incorporating additional information, as described in the following two sections.
2.2
General Purpose Data Interface
Even though many functions of modern vehicles are managed by microcontrollers, in the end, there is either a a sensor or an actuator controlled, such as the light or the front wiper. This means at some point, there is current flowing and voltage present. We use this fact to create a general purpose data interface to elict information from the vehicle, without the need of the CAN matrix which is usually
Permission to make digital or hard copies of all or part of this work for personal or classroom use is granted without fee provided that copies are not made or distributed for profit or commercial advantage and that copies bear this notice and the full citation on the first page. To copy otherwise, to republish, to post on servers or to redistribute to lists, requires prior specific permission and/or a fee. AutomotiveUI 21 - 22 September 2009, Essen, Germany Copyright held2009 by author(s) Copyright 200X ACM X-XXXXX-XX-X/XX/XX ...$5.00. AutomotiveUI'09, September 21-22, 2009, Essen, Germany ACM 978-1-60558-571-0/09/009
57
Proceedings of the First International Conference on Automotive User Interfaces and Interactive Vehicular Applications (AutomotiveUI 2009), Sep 21-22 2009, Essen, Germany
confidential not accessbile for researchers in general. Fig. 1 shows an overview on the the developed system. Information Engine Load Engine Speed Sensor Coolant Temperature Throttle Position
Intake Air Temperature Battery Voltage
Oxygen Sensor
Initial Meaning Computed from Air Flow Rate into the engine and Intake Manifold air pressure Reported by the Crankshaft Position Reported by the engine coolant sensor, a thermistor that varies its resistance according to the engine coolant temperature Throttle position sensor creates a voltage signal that varies in proportion to the throttle valve opening angle Measured by another thermistor located in the Mass Air Flow Sensor unit affects the speed at which the fuel injectors open and must be taken intoaccount in computing the fuel injectorpulse length, or injector open time The oxygen density in the exhaust emissions is detected and generates a control signal back to the ECU indicating the burned air to fuel ratio.
Figure 1: General Purpose Vehicle Data Acquisition Architecture. A set of self-describing components acquire data from analog signal wires and convert the input data and provide pre-processed data over three optional outputs. In case of serial communication, the data is read and re-sent over a socket. The self-description of the node is used for correctly producing the outputs for the data consumers: a driver HMI, a 802.11p-based V2X communication unit and a Bayesian network for context inference.
2.3
Visual Diagnostic Screen Recognition
Our PriCARVe research vehicle enables us, due to the availability of the CAN matrix [14] to access the in-vehicular sensor systems directly. With an additional video-in-motion modification using a VAIS tech CAN module faking a present DVD player on the AVC-LAN bus, we can use the built-in factory touch screen for our adaptive user interfaces. This enables, for example, to reproduce the results of Coroama et al. [3] without the need of any additional external sensing equipment.
Table 1: The On-Board Diagnostics interface, mainly targeted at maintenance, provides information about several sensors that can be used to assess the vehicle’s context. The table give a list of the most useful information for context inference http: //www.4x4wire.com/toyota/4Runner/tech/OBDII_ECU/. The data is currently used by three systems in the vehicle: first, a simple HMI component, shown in Fig. 6 that visualizes the state of one interface to the driver. This will in future be an fully graphic interface, replacing all other user interface information components, such as the tachograph. While local sensor information alone is very important, esp. for context inference, we also explore options of integrating this data directly in the ongoing research efforts on vehicle-to-vehicle and vehicle-to-infrastructure communication, subsumed as vehicle-to-x (V2X) communication. The goal of V2X communication is, by cooperative communication, to increase safety, traffic efficiency, and provide novel services [1]. Again, researchers are in need for the in-vehicle sensor data and are relying on the cooperation with a vehicle manufacturer. This might limit options for exploring ideas. By providing a general approach to vehicular sensor data, we think that here, too, research is fostered by our approach. The output connector for V2X communication enables the collaborative sharing of local data, allowing the near-by vehicles to get a notion of the context of the other surrounding vehicles. Our system is the local correspondent of the distributed collaborative CODAR (Cooperative Object Detection and Ranging) architecture [9, 10].
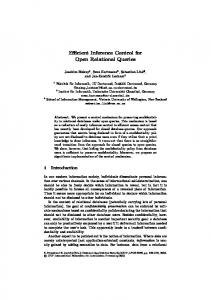
Figure 2: Debug Information System: Factory debug system of the 2006 Toyota Prius in our PriCARVE, the Prius Context-Aware Research Vehicle. In addition to the general purpose interface, sophisticated CAN BUS access complements the input data. The debug screen shows speed, the status of the car (ignition, powered), the driving direction (rev is currently off ), the status of the vehicle’s light and the parking brake. In the context of this research, we use the availability of
58
Proceedings of the First International Conference on Automotive User Interfaces and Interactive Vehicular Applications (AutomotiveUI 2009), Sep 21-22 2009, Essen, Germany
relevant to the interaction between a user and an application, including the user and applications themselves. In particular high-level context information like the danger of a situation is of importance for context aware applications in cars. The process of generating this information from the available data described in the last section is called context inference. The high-level information we are interested in given the available data is the profile of the track where the car is currently driving (e.g. tunnels, hills, intersections, high-ways), the danger of a situation or the car’s status or actions like parking, lane changing or normal driving. Among others we can seen the following dependencies: ∙ If the blinking lights are on, we receive a GPS signal and are driving at relatively low speed, this might indicate that we are approaching an intersection. ∙ If on the other side lights are on and we do not receive any GPS signal, we are most probably in a tunnel.
Figure 3: Debug Information System: The debug information system of the Mercedes G400 delivers battery and audio status, the coordinates as measured by the in-vehicle navigation unit, the driving direction as set by the automatic gear and the current speed as measured by the odometry.
∙ If one is driving backwards at relatively low speed, we can assume that the car is parking. ∙ If the engine load is different than usual at the same speed or your current speed differs from your normal speed profile you are probably driving up- or downhill.
the real data as ground truth and can thus directly compare the information to the one computed by the combination of OBDII, general purpose data interface and the visual diagnostic screen. Visual diagnostic screens, ranging from LED segment displays to fully graphic displays are standard in modern vehicles. They enable the garage to quickly check the main functions of the vehicle, without the need of fully wiring the manufacturer’s diagnostic computers to the vehicle. Fig 2 and Fig 3 show two examples of secretly built-in diagnostic screens. The first shows an example of the Toyota Prius’ screen, the second an example of a Mercedes G400. The contents of the screen are only dynamic w.r.t. the data values, the position of the information is static. Using a fixed digital video camera, such as an webcam, we can grab images of the screen. As the a-priori knowledge of the information locations are known, optical character recognition software can extract the information from the images several times per second. We are planning to explore the options of video analysis, though feel more than 5 updates per second are not necessary. This is also the envisoned update rate of EU V2X systems.
3.
∙ Blinking lights at constant speed indicate a lane change maneuver on a motorway. ∙ With a high wiper level and lights switched on, one can assume an environmental condition with low sight. From those dependencies we can model inference rules that are evaluated in real-time while the car is driving. Active Safety Applications can access these data from a predefined interface and enhance the overall traffic safety.
4.
CONTEXT INFERENCE WITH BAYESIAN NETWORKS
There are different ways to perform inference, among others logical reasoning with all different types of logics (like Propositional Logics, Description Logics, First and Second Order Logics and many more), context history based approaches and probabilistic algorithms. Probabilistic inference e.g. with Bayesian Networks (BN) resulted to provide the best trade off between expressivity, ease of modeling and inference performance [5]. Over the last 15 years, BNs [12] have evolved as a major tool in a wide area of scientific disciplines requiring sound statistical analysis, automated reasoning or exploitation of knowledge hidden in noisy data. These range from fields in medical research, genetics, insurance analysis, and fault handling to automation and intelligent user interaction systems. BNs combine techniques from graphical models with those from Bayesian analysis to provide a formal framework where complex systems can be represented and analyzed. A BN encompasses a set of random variables (RV) that represent the domain of interest and the BN encodes many of the important relationships between these variables, such as causality and conditional dependence and conditional independence. Specifically, their structure bears information about the qualitative nature of these relationships whereas
FROM RAW DATA TO SAFETY RELEVANT CONTEXT
Active Safety Application are any application that try to prevent accidents and therefore have to intervene at the first indication of a potential accident situation (in the remainder also called hazardous situation). To detect these hazardous situations applications have to collect the available context information. To be precise, when we use the term ”context”, we follow the definition given by Dey in [4]: Context is any information that can be used to characterize the situation of an entity. An entity is a person, place, or object that is considered
59
Proceedings of the First International Conference on Automotive User Interfaces and Interactive Vehicular Applications (AutomotiveUI 2009), Sep 21-22 2009, Essen, Germany
Current Speed
Action
Track Profile
Engine Load Change
Direction
Reverse_Lights
Danger
GPS_Signal
Engine Load
Visibility
Blinking Lights
Wiper Level
Speed Change
Lights
Time of the Day
Brake
Brake Lights
Figure 4: A complete Bayesian Network linking the information that is available through the sensors. Nodes represent Random Variables that model the raw data sources (top and bottom rows) and inferred concepts (in the middle). The target random variables, that represent the value added information for drivers are represented in bigger font size and thicker frame. The directed edges represent causal influence in the direction of the arrow. The ”Direction” you are driving to influences for instance the status of your ”Reverse Lights”. their network parameters encode the quantitative probabilistic relationships among the variables of interest. Figure 4 shows a BN, that models the status of a car based on the available information described in section 2. It may seem simplistic, but represents a fair trade-off between complexity and quality of the results. This trade-off can even be learnt by automatic processes like in [11] that create structure and transition probabilities of BNs from a given data set. As any inference rule or ontology, it represents a relevant part of the reality, abstracting from the general complexity. For context inference now, we can represent any inference rule by a BN and evaluate them by calculating the conditional probabilities. RVs represent context attributes of a specified user. Context inference takes into account sensed values for context attributes in the BN as evidence and computes the conditional probability of the target context attribute. The most probable value of this context attribute will be returned together with its probability as confidence level. This computation of the conditional probabilities can for example be done in a message passing algorithm [7], that first transforms the graph into a tree structure of cliques (=combinations of random variables) and then, if evidence is added, passes the new probabilities as messages through the whole tree, so the evidence takes effect in every related node. Among the proposed evaluation algorithms for Bayesian networks, this one offers exact inference, and a well-described implementation that is more efficient than a straight-forward evaluation of conditional probabilities. It can be shown however that the general problem of inference in a BN is NP-hard in the number of nodes [2], that’s why we developed the concept of Bayeslets [6]. In these, the concepts of ”divide and conquer” as well as object orientation are applied to BNs. Inference is only applied to
sub-networks that are thematically closely linked. Only on demand for a higher inference goal, several Bayeslets can be joint. This offers faster inference as only necessary nodes are evaluated taking into account only available sensors. With the predefined interfaces contents of Bayeslets can be shadowed as long as the outcome is applicable to Bayesian inference. Bayeslets furthermore ease personalization and dynamic incorporation of other users’ context, which is particularly desirable in large scale highly dynamic environments like in road traffic. In Figure 5 we show the evaluation of a Bayeslet, i.e. of a part of the BN from Figure 4. The result shows that based on the causal influences defined in section 3 we can infer the current track profile taking into account possible ambiguities, fault rates of sensors and general uncertainty.
5.
TEST ENVIRONMENT
Our test environment comprises two equipped vehicles, a Mercedes model G400 and a Toyota Prius model 2006. They are equipped with an automotive computer from DSM that automatically powers up when the car is turned to ignition. It has a connection to the three above named interfaces, OBDII, general purpose data interface and debug screen. We are using the information data sources and information summarized in Tab. 2 in the current state of our system. The automotive computer acquires the data from the different interfaces and processes, when necessary, the corresponding output, e.g. for the debug screen. Every input that can be read then digitally available and provided over sockets, allowing flexible information exchange between the producers and consumers of the data, using a client/server model. Fig. 6 shows a first visualization of the vehicle’s state,
60
Proceedings of the First International Conference on Automotive User Interfaces and Interactive Vehicular Applications (AutomotiveUI 2009), Sep 21-22 2009, Essen, Germany
Current Speed Current Speed Zero_km_h
0%
until_10_km_h
0% 0%
over_100_km_h
0%
normal
off
left_or_right 100%
00%
both
0% 0%
0%
Reverse_Lights
reverse
80%
higherThanUsual 17%
0%
lowerThanUsual 3%
GPS_Signal
off 100%
on 100%
on
off
0%
Engine Load Change normal
forward 100%
lowerThanUsual 5%
Blinking Lights
0%
0%
over_100_km_h
Direction
72%
higherThanUsual 23%
0%
0%
until_100_km_h
Engine Load Change
Direction forward 100%
hts
0%
Track Profile straight_standard 20% multiple_lanes 14% 34% tunnel 5% hill_up hill_down 3% 25% intersection
Track Profile straight_standard 30% multiple_lanes 21% tunnel 0% 7% hill_up hill_down 4% 38% intersection
reverse
0%
until_10_km_h
until_50_km_h 100%
until_50_km_h 100% until_100_km_h
Zero_km_h
Blinking Lights
0%
off
0%
0%
left_or_right 100%
0%
both
0%
Reverse_Lights
GPS_Signal
off 100%
on
on
off 100%
0%
0%
Figure 5: Based on the inference network of Figure 4, the measured information is taken into account and the current ”Track Profile” is evaluated. This representation of BNs shows the possible values in the ranges of a RV associated with their probabilities. The measured data have been introduced into the sensor nodes as evidence and propagated throughout the network to calculate the probabilities of ”Track Profile”. In the left sub-figure you can see that with the blinking lights set to either left or right and relatively low speed, the most probable current track profile is a street ”intersection”. If the system knows in addition that there is no GPS signal receivable at the moment like in the right sub-figure, the highest probability switches to ”tunnel” for the current Track Profile.
Source OBDII General Purpose Data Interface Visual Diagnostic Screen Recognition
Data speed, engine load, fuel tank level front and back wiper speeds, fog, front and rear lights, brake status GPS coordinates, driving direction, phone status
to the current situation. For instance, when driving at high speeds, the amount of UI elements could be reduced, and important elements such as the tachograph could be enlarged, the amount and type of feedback could be changed, e.g. from visual to audio or tactile output. This closes the loop to improving traffic safety. As with the proposed system no legal or insurance aspects are concerned, e.g. with interference with safety-critical systems, such as vehicle stability control (VSC), real world test can be conducted in real traffic contexts on public roads.
Table 2: Data source and information acquired in our system. Data from all three sources is combined and evaluated by a Bayesian network and for adaptive human-machine interfaces.
6.
CONCLUSION AND OUTLOOK
We proposed and implemented an open-access vehicular data interface for in-car context inference and adaptive automotive human-machine interfaces. We used one existing standardized interface and proposed and implemented two additional, simple and transferable interfaces. Thereby, researchers are enabled to modify vehicles into research objects, without the burden of acquiring a CAN matrix and thus leveraging research in this field. Based on the proposed architecture, we presented an initial user interface as basis for context-aware user interfaces
based on the developed general purpose data acquisition system. The goal of the data acquisition is to infer the vehicle’s and the driver’s context and adapt the user interface to the situation. As example, in case of driving at high speeds and when using the high beam lights, the audio could be muted as a potentially hazardous situation could arise and the driver’s attention should not be distracted by any radio or CD audio signals. Using context information from the driver and the vehicle, a later user interface could adapt
61
Proceedings of the First International Conference on Automotive User Interfaces and Interactive Vehicular Applications (AutomotiveUI 2009), Sep 21-22 2009, Essen, Germany
[2]
[3]
[4] [5]
Figure 6: HMI Visualization of selected vehicle signals. This initial bird’s eye visualization of the Mercedes G400 model currently visualizes the state of selected signal wires. The information from this and further general purpose data units can be combined and form the basis of later context-aware adaptive user (driver) interfaces.
[6]
and developed a Bayesian network for determining the vehicle’s and thus driver’s context. We thereby verified the validity and potential of our approach. The connections underlying the Bayesian network have been developed based on our experiences as vehicle drivers. We in the next step will collect real world data sets and analyze the performance of the network with respect to the accuracy of the connections and the reliability of the context predictions. For our future research, we will explicitly focus on nonGNSS (global navigation satellite system) based driving. We want to elaborate on different questions, e.g. w.r.t. map building: does driving slowly, blinking and speed allow us to correctly infer an intersection? Using the history information of the data sets, can we infer deviations from normal driving behavior, such as making a short stop at the mall when driving home? Using GNSS information, we will explore if we can improve digital map information with e.g. road profile information, update missing intersections and tunnels and in general improve the quality of community-based free geoinformation systems by applying our research.
[7] [8]
[9]
[10]
[11] [12]
ACKNOWLEDGEMENTS
[13]
The research leading to these results has received funding from the European Community’s Seventh Framework Programme [FP7/2007-2013] under grant agreement no. 215098 of the Persist (PERsonal Self-Improving SmarT spaces) Collaborative Project.
[14]
REFERENCES [1] Car-to-Car Communication Consortium. Manifesto. Technical report http://www.car-to-car.org/
62
fileadmin/downloads/C2C-CC_manifesto_v1.1.pdf, Car-to-Car Communication Consortium, 2007. G. F. Cooper. Probabilistic inference using belief networks is NP-hard. Technical Report KSL-87-27, Medical Computer Science Group, Knowledge Systems Laboratory, Stanford University, Stanford, CA, May 1990. V. Coroama. The smart tachograph - individual accounting of traffic costs and its implications. In K. P. Fishkin, B. Schiele, P. Nixon, and A. J. Quigley, editors, Pervasive, volume 3968 of Lecture Notes in Computer Science, pages 135–152. Springer, 2006. A. K. Dey. Understanding and using context. Personal and Ubiquitous Computing, 5:4–7, 2001. K. Frank, M. R¨ ockl, P. Gallego Hermann, and M. T. Morillas Vera. Knowledge representation and inference in context-aware computing environments. In J. Lloret Mauri et al., editor, The Second International Conference on Mobile Ubiquitous Computing, Systems, Services and Technologies (UBICOMM08), pages 89 – 95. IEEE Computer Society Conference Publishing Services (CPS), 09 2008. K. Frank, M. R¨ ockl, and P. Robertson. The bayeslet concept for modular context inference. In J. Lloret Mauri et al., editor, The Second International Conference on Mobile Ubiquitous Computing, Systems, Services and Technologies (UBICOMM08), pages 96 – 101. IEEE Computer Society Conference Publishing Services (CPS), 05 2008. C. Huang and A. Darwiche. Inference in belief networks: A procedural guide. International Journal of Approximate Reasoning, 15(3):225–263, 1996. D. Kern, A. Schmidt, M. Pitz, and K. Bengler. Statusund kontextinformationen f¨ ur die telekommunikation im auto. In T. Gross, editor, Mensch & Computer, pages 119–128. Oldenbourg Verlag, 2007. M. Kranz, A. Franz, M. R¨ ockl, A. Lehner, and T. Strang. CODAR viewer - a situation-aware driver assistance system. In Pervasive 2008 Demonstration, volume 236 of Advances in Pervasive Computing, pages 126 – 129. Austrian Computer Society, May 2008. M. Kranz, M. R¨ ockl, A. Franz, and T. Strang. CODAR viewer - a V2V communication awareness display. In Pervasive 2008 Late Breaking Results, volume 236 of Advances in Pervasive Computing, pages 79 – 82. Austrian Computer Society, May 2008. K. P. Murphy. Dynamic bayesian networks : representation, inference and learning. PhD thesis, 2002. J. Pearl. Causality: Models, Reasoning, and Inference. Cambridge University Press, 2000. Society of Automotive Engineers (SAE International). On-board diagnostics system. en.wikipedia.org/wiki/OBD-II_PIDs,http: //en.wikipedia.org/wiki/On_Board_Diagnostics, 2003. A. Vass. Toyota Prius CAN Project. http://www. vassfamily.net/ToyotaPrius/CAN/cindex.html, 2004.