blueprint of the EC2 network topology which resem- bles VL2 [7] ... design a simple language called CloudTalk that allows applications to ... we found out that there are actually two edge routers for each ... same machines, but the addresses reported were coming ... with 1.7GB of RAM and 5 EC2 computing units hosting.
Opening Up Black Box Networks with CloudTalk Costin Raiciu
Mihail Ionescu University Politehnica of Bucharest
Abstract
Dragos, Niculescu
are seemingly stuck: optimizing distributed applications requires in-depth topology knowledge that providers are understandably reluctant to give away.
Optimizing distributed applications in the cloud requires network topology information, yet this information is kept confidential by the cloud providers. Today, applications can infer network properties and optimize accordingly but this is costly to get right. The cloud can optimize the network via load balancing, but the scope is limited to moving traffic between the available paths. In this paper we challenge this status quo. We show that network topology information is not confidential in the first place by conducting a study of Amazon’s EC2 topology, and we show how such information can have a big impact in optimizing a web search application. We propose that applications and the network should break the silence and communicate to allow better optimizations that will benefit both parties. To this end we design CloudTalk, a very simple language that allows apps to express traffic patterns that are then ranked by the network. The ranking helps application pick the right way to implement its tasks. We provide a proofof-concept implementation of CloudTalk showing that it is expressive enough to capture many traffic patterns and that it is feasible to use in practice.
In this paper we challenge this status quo. First, we seek to understand just how private network topology information is in practice by conducting a measurement study on Amazon’s EC2 Infrastructure-as-aService cloud. We find that hiding the network topology is rather difficult: our measurements give a clear blueprint of the EC2 network topology which resembles VL2 [7] (see Section 2). To understand whether topology information does help optimizing applications, we deploy a distributed web-search application on 100 servers. We run several configurations of this application, one of which has been optimized using the inferred topology. The results show that substantial benefits can be had when topology information is used (Section 3). Our practical experiments show that the topology information cannot be hidden, and that optimizing applications requires such information. How should networks and applications communicate to help optimizations? One way transfer of information from the network to the applications is difficult to get right: either the information accurately describes the topology but violates the operator’s confidentiality requirements, or the information is somehow anonymized and certain optimizations are not possible anymore.
1 Introduction Many organizations are running large-scale distributed applications in the cloud, benefiting from the abundance of resources and the attractive pay-per-use billing model. Cloud users want their apps to finish as quickly as possible, and they should be able to use the many optimizations that have been proposed to this end [8, 4, 10]. Optimizations often require detailed knowledge of the cloud topology and its resources. In particular, network topology information is crucial to getting good performance as the network is often the bottleneck. Meanwhile, the datacenter operators keep topology information confidential. This status quo is suboptimal: application optimizations either ignore the network or profile it continuously to get accurate information. The former results in disgruntled customers and low network utilization and the latter wastes traffic. Network-only optimizations are limited to load-balancing traffic between available paths. We
In Section 5 we propose an alternative where both applications and the network provide information. We design a simple language called CloudTalk that allows applications to succinctly specify network tasks—each containing related network transfers—and submit them to the network. The network responds with task finish time estimates. These are used for optimizations: applications will choose between different equivalent ways of doing the same computation. We have implemented a proof-of-concept implementation of CloudTalk and applied it to optimize web search and MapReduce apps. Initial results show that CloudTalk is expressive enough to optimize interesting applications and feasible to implement in practice. 1
2 Inferring Cloud Topology Information Cloud providers such as Amazon EC2 or Microsoft Azure do not disclose any information regarding network topology. Nevertheless, a great deal of information can still be inferred by running measurements on cloud instances. We analyzed the topology of Amazon EC2’s us-east-1d datacenter by acquiring many “instances” and using well known network diagnosis tools such as ping, traceroute and iperf. We only describe our main findings here due to space constraints. Amazon EC2 instances are virtual machines running on top of Xen [3] hypervisor. On each physical machine there is a special VM called Dom0 and many tenant VMs. Dom0 controls the tenant VMs’s access to the network and acts as an IP hop and the default router for the guest machines. Because of this we can only infer L3 topology information. We ran ping and traceroute between all our instances and identified several situations:
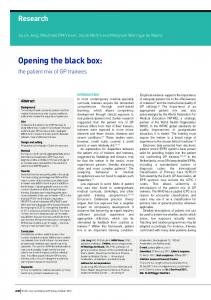
Figure 1: EC2 US-EAST Availability Zone D Topology as inferred by measurement in December 2011
subnets, and providing full redundancy. The available bandwidth is still 1Gb/s, confirming anecdotal evidence that EC2 has full bisection bandwidth. An interesting situation surfaced during these tests. The data from traceroute and ping -R was not quite in sync, showing different IP addresses for the same routes. We hypothesized that the actual routers were the same machines, but the addresses reported were coming from different router interfaces. We proved this true by employing a well-known technique for interface disambiguation [2]. The main idea is that a router, when transmitting an ICMP message back, will use the source address of the outbound interface on which the packet is sent. Therefore, one can transmit a UDP packet to an unused port at each of the interfaces I1 and I2 (suspected to be on the same physical machine) from the same source. If the returned ICMP packet comes from the same I3 , it means that I1 and I2 belong to the same router. We present in Figure 1 the topology for EC2’s us-east1d datacenter as resulting from our experiments. While we cannot be absolutely sure that this is 100% accurate, it correctly explains all behavior we noticed during our tests, as well as anecdotal information gathered from various informal meetings with people from Amazon. The topology is very similar to the VL2 topology [7].
1. The instances (or Virtual Machines, VMs) are on the same physical machine. In this case, there is only one hop between the two VMs, the packets go from V M1 – Dom0 – V M2 . The IP addresses of the VMs are usually very close to each other, in the same /24 address space. Using iperf we find that the available bandwidth between such VMs is pretty high at around 4Gb/s. 2. The VMs are in the same rack. We assume the existence of a top of the rack switch (ToR), but this only functions at L2. There are two hops between the VMs: V M1 – Dom01 – Dom02 – V M2 . The IP addresses of the VMs are in the same /24 address space. The available bandwidth is 1Gb/s. 3. The VMs are in the same subnet. We found out that a subnet contains machines with addresses of the form 10.n.x.x and 10.n+1.x.x; for example 10.194.x.x and 10.195.x.x will be in the same subnet. In this case, there are three hops: V M1 – Dom01 – EdgeRouter – Dom02 – V M2 . We run the experiments 100 times between each pair of machines and we found out that there are actually two edge routers for each subnet, and it seems that Dom0 (or, less likely, the ToR switch) is load balancing traffic to the routers dynamically. The available bandwidth is 1Gb/s.
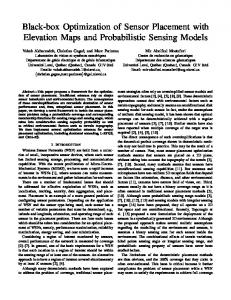
3 Optimizing Web Search Web search is a classical distributed application which uses a “scatter-gather” workflow. Nodes are organized in a hierarchical structure. The query is sent by the frontend towards the leaves, while the results go in the opposite direction. The architecture we used for our experiments has two levels of aggregators and is shown in Figure 2. Each aggregator has around 50 nodes underneath. For our implementation, we used Apache Solr on top of the Apache Tomcat web server. This combination is considered by many as the state of the art in open source search engines. Solr naturally supports aggregation on multiple levels using the concept of sharding,
4. The VMs are in different subnets. In this case, there are five intermediate hops: V M1 – Dom01 – EdgeRouter – CoreRouter – EdgeRouter – Dom02 – V M2 . Running the experiments multiple times, we found that there are two groups of core routers, each of them connecting all edge routers from the different 2
Frontend Aggregator
Aggregator
Servers
Servers
Figure 2: Web Search architecture with two levels of aggregation
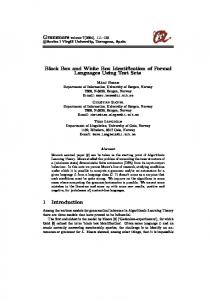
Response Time (s)
100
10
1
0.1
Single 1 level 2 levels worse 2 levels best
0.01 10
20
30
40
50
queries per second (qps)
Figure 3: Web search performance
60
Figure 4: Simple MapReduce optimization: who should run the two reduce jobs?
other had 20 machines in the same rack, 10 machines in the same subnet and 18 in different subnets. The results show that the effects of incast are smaller compared to the single aggregator scenario. Further, when traffic increases, the performance for the “best” scenario gets substantially better than the “worst” case, even by a factor of 3 to 1. We conjecture this is because the RTT distribution is more varied in the best case; we confirm this effect via simulation in Section 6.
where an instance can be configured to return aggregated results from its own data together with results from other servers. Each machine is a High CPU medium instance, with 1.7GB of RAM and 5 EC2 computing units hosting the content of roughly 5 Million indexed URLs for a total of around 4GB of data (the web pages are from a 2.5TB snapshot of the .uk domain taken in 2009). We measured the performance of the system in multiple configurations and present the results in Figure 3. First, we measure the raw performance of one machine searching its part of the index — this the baseline for the distributed measurements. Second, we measured with only one aggregator contacting all 100 servers. When traffic was low, the system was behaving correctly but with obviously higher delays compared to the singlemachine baseline.
4 The Need for Cloud Talk We have shown that “confidential” topology information can be inferred and is key to getting good performance in datacenters. While applications and networks could go on like this, the status quo is suboptimal for all parties. Take the example shown in Figure 4 of a scheduler that must schedule two reduce jobs and it can choose between machines A, B and C that have just finished running map jobs. If asked, the network would advice it is best run the reduce jobs on A and B because C’s downlinks are congested. In practice, the application will start the reduce jobs on two random machines, and perhaps reschedule if one lands on C and becomes a straggler; however this takes time and wastes resources. Once the scheduler assigns the reduce job, the network can only load balance flows onto its core links for small improvements. It therefore seems inevitable that the network and the applications should collaborate to reap mutual benefits. Although there are many ways to design the information flow between the network and its applications, solutions must provide a number of desirable properties including: expressiveness to capture complex application data patterns, efficiency to allow constant use, dynamicity to allow optimizations on short timescales and finally reduced information leakage. The most obvious solution is to have the datacenter operator provide each requesting application the real network topology together with buffer sizes. This violates the confidentiality requirement, and does not capture any dynamic information the network may have, for instance the list of congested links or current buffer usage.
Once the traffic exceeds 35 queries per second (qps), the aggregator software started crashing. We believe that the effect is due to TCP incast[13]: each server sends bursts of packets containing query replies to the corresponding aggregator via a single TCP connection. The limited network buffer available on the aggregator’s port in the ToR switch is overrun, losing many packets. Each TCP connection has few packets in flight so fast retransmit is not triggered, resulting in a costly timeout. Meanwhile, unserviced requests pile-up at the frontend until the server runs out of memory and crashes. The last two tests were done in a configuration similar with the one presented in Figure 2. The only difference among the two tests was the location of the aggregators. We kept the frontend and the nodes constant and we varied the location of the aggregators, using the inferred topology information presented in the previous section. For the first case (called “worst”), we placed the aggregators such that each aggregator and its corresponding nodes were in different subnets. For the second case (called the best), each aggregator was placed in such a way to to maximize the number of servers close to the aggregator. For the actual machines we had, this meant that one aggregator had 14 machines in the same rack, 15 in the same subnet and 18 in different subnets, while the 3
Another solution is to adopt ideas from IETF ALTO (application-layer traffic optimization) Working Group [12]. ALTO aims to help network operators and endpoints to communicate to solve the following tussle: BitTorrent clients draw most traffic from the best peers, but in the process they create a lot of costly upstream traffic for their ISPs. ALTO servers run by the operator provide requesting applications with a network map and a cost map. The network map is essentially a clustering of IP addresses into groups called PIDs, and the clustering is performed by the operator according to its own routing policy. The cost map provides routing costs between PIDs. The applications use this information to select the most desirable peers from the point of view of the network and the application. The ALTO model offers better confidentiality than the solution above, but it is not as expressive as we need it to be in a datacenter: it does not capture costs in manyto-one (e.g. example above) or many-to-many cases, and does not capture dynamic information.
Task B’s description is similar. The application submits both task descriptions to the network, and the network ranks them according to their performance. This description model is very simple yet it can capture most of the traffic patterns we care about in practice. One-to-one communication is trivial to express, and many-to-one or many-to-many interactions can be easily described with tasks similar to the one above. The strength of the model stems from the fact that it includes time explicitly: apps can tell the network which flows are parallel and which depend on other flows. For the latter part, the f inish(ID) operator is used. The start time of a task is an arithmetic expression using scalars and other f inish operators, as well as max/min functions. This allows us to express synchronization barriers, such as those seen at the end of the shuffle phase of MapReduce computations. To allow more concise representations, traffic patterns that include multiple sources or destinations can be specified as long as all transfers send the same amount of bytes. In such cases identifiers are assigned sequentially. The model also contains the bandwidth operator that allows the applications specify more complex communication patterns. One example is daisy-chaining that is used by distributed file systems to store data simultaneously on a chain of hosts, with all intermediary hosts sending data out as soon as it is received. A model of daisy chaining can leverage the bandwidth operator to limit the throughput on link i + 1 in the chain to be always smaller than or equal to the throughput of the predecessor link i. To decide replica placement, a distributed filesystem can use the following task description:
5 CloudTalk Language We propose a simple solution where applications explicitly ask the network for advice by providing a request which includes a number of equivalent network tasks. The network ranks these alternative tasks using its detailed knowledge of the topology and possibly the current traffic load. The application will then use the most efficient task as told by the network. This type of interaction relieves the network from having to provide potentially verbose, confidential data. The application provides little confidential information beyond what the network could already find by looking at the traffic. A task is a set of interrelated network transfers specified by the application; the task finishes when the last transfer of that task finishes. For each individual transfer, the application specifies a task-unique identifier, the source, the destination, the size and the start time of the transfer. All times are given as wall-clock seconds and are relative to the start of the task. Additionally, start times can refer to the finish times of other transfers. Let’s consider an application wishing to run a scattergather task. The data can be queried from hosts A or B, and the data resides on hosts C and D. Which of A and B should be used? The application will create two tasks, one running scatter-gather from host A and one from host B. The description of Task A is: ID From To 1 A C 2 A D 3 C A 4 D A
ID From To 1 A B 2 B C Constraint:
Size Start 64MB 0 64MB 0 bandwidth(2)