Metronome: Operating System Level Performance Management via Self–Adaptive Computing Filippo Sironi1,2 , Davide B. Bartolini1 , Simone Campanoni3 , Fabio Cancare1 Henry Hoffmann2 , Donatella Sciuto1 , Marco D. Santambrogio1,2 1
Politecnico di Milano, 2 Massachusetts Institute of Technology, 3 Harvard University {sironi, bartolini}@elet.polimi.it,
[email protected],
[email protected] [email protected], {sciuto, santambrogio}@elet.polimi.it
ABSTRACT In this paper, we present Metronome: a framework to enhance commodity operating systems with self-adaptive capabilities. The Metronome framework features two distinct components: Heart Rate Monitor (HRM) and Performance– Aware Fair Scheduler (PAFS). HRM is an active monitoring infrastructure implementing the observe phase of a self– adaptive computing system Observe–Decide–Act (ODA) control loop, while PAFS is an adaptation policy implementing the decide and act phases of the control loop. Metronome was designed and developed looking towards multi–core processors; therefore, its experimental evaluation has been carried on with the PARSEC 2.1 benchmark suite.
Categories and Subject Descriptors C.4 [Performance of Systems]: Measurement techniques, Performance attributes; D.4.1 [Operating Systems]: Process Management—Scheduling; D.4.8 [Operating Systems]: Performance—Measurements, Monitors
General Terms Design, Management, Measurement, Performance
Keywords
system and application developers. This is even more evident in the embedded systems domain, where capabilities may present huge variations among different system configurations. Moreover, embedded systems might be required to operate continuously for years in possibly uncertain conditions where some of the environmental characteristics might affect the behavior of the system. As an example, consider a mobile phone: it must consume the least possible amount of battery power while operating at different signal strengths and perhaps with different signal types (i.e., GSM, EDGE, 3G, etc.). The amount of requirements and constraints is gigantic. One approach to simplify the duty of application developers is the adoption of autonomic or self–adaptive computing [20] through self–adaptive hardware [19, 7] and self– adaptive software [21]. Self–adaptive systems (i.e., systems employing either self-adaptive hardware or software) rely on control loops to adjust their behavior to internal and environmental changes. Such systems are required to observe themselves and the environment, decide on a sequence of actions to perform, and apply them in order to optimize their operations. The process of observing, deciding, and acting is referred to as either Observe–Decide–Act (ODA) or Monitor–Analyze–Plan–Execute with Knowledge (MAPE– K) control loop. In this paper we make the following contributions: • We present Metronome, a framework for self-adaptive computing constituting an implementation of the ODA control loop to enhance commodity operating systems. The reference implementation of Metronome is publicly available as free software1 . • We compare our active monitoring infrastructure, i.e., Heart Rate Monitor (HRM), with an open source, state– of–the–art solution designed over the same concept, namely Application Heartbeats [16]. We show a considerable reduction of the worst-case overhead by a factor greater than 160×, thanks to our efforts in considering multi–core processors–related issues such as synchronization and cache sharing. • We present an adaptation policy, called Performance– Aware Fair Scheduler (PAFS), to implement the decide and act phases of the ODA control loop. PAFS is an adaptive scheduling infrastructure relying on HRM to take informed decisions and actions. We experimentally evaluated PAFS through concurrent runs of a subset of the PARSEC 2.1 benchmark suite [6].
Self-Adaptive Computing, Operating Systems, Performance Management
1. INTRODUCTION In the recent years, the demands in terms of computing performance, functionality, reliability, availability, and serviceability has grown exponentially, raising the overall complexity of the hardware/software execution stack [15]. Hardware developers multiply the amount of resources (i.e., cores count, memory size, etc.), making them more and more heterogeneous and posing an ever–increasing burden on both
1
http://www.changegrp.org/acos/.
The remainder of this paper is organized as follows. Section 2 discusses related work. Section 3 presents the proposed solution to implement the ODA control loop to enhance a commodity operating system. Section 4 and Section 5 describe respectively HRM and PAFS. Finally, Section 6 concludes the paper.
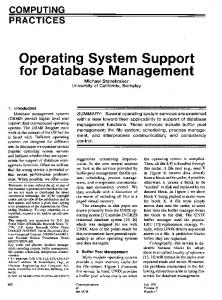
Measures Goals & Constraints Decide Adaptation Policies
2. RELATED WORK
Apps
Monitoring Infras. Observe
Act
At the beginning of 2000, IBM published the autonomic computing manifesto, proposing a vision [20] into which computing systems manage themselves according to user– defined goals and system–defined constraints; lately, autonomic computing systems have been referred to as adaptive or self–* computing systems. The big idea is to ease the work of system and application developers in exploiting the available amount of resources in accordance with user–defined goals and system–defined constraints. Software implementations include a language and compiler for algorithmic choice with auto–tuning capabilities [4], a framework to statistically guarantee the Quality of Service (QoS) trading performance for energy and vice versa [5], a self–tuning scheduler to guarantee the QoS for soft real–time applications [12], a framework for adaptive data structures and algorithms selection [24], and a self–adaptive synchronization library [14]. More recently, a set of more comprehensive solutions like PowerDial [18] and SEEC [17] were presented. Examining to a greater extent the self–adaptive computing literature, the observe phase of the ODA control loop received a lot of attention and contributions. With the recent advances, processors significantly improved the capabilities of Performance Monitoring Units (PMUs). However, alongside with capabilities, the complexity of PMUs rose too, making the tasks of understanding and using them progressively more difficult [23]. Various approaches using PMUs [9, 23] are inadequate to capture user–defined goals and system–defined constraints; in addition, they are also difficult to port between platforms and operating systems. Performance and Evaluation Monitoring (PEM) [10] is an enabling technology for autonomic computing systems and Continuous Program Optimization trying to abstract and extend PMUs. On one hand, the proposed infrastructure is complete (i.e., potentially supporting multiple programming languages) and has been successfully ported on the K42 research operating system [22]. On the other hand, PEM poses a notable burden on system and application developers, who must provide both an XML specification of the events they want to track and the code to handle the event. Application Heartbeats [16] is an active monitoring infrastructure designed and developed for self–adaptive computing. It provides application developers a way to expose user–defined performance goals and a method to signal execution progresses; both the performance goals and measures are then made available to system developers. Application Heartbeats has the unquestionable advantage of being extremely simple with respect to other solutions.
we refer to those applications that do not provide such information as legacy applications. A monitoring infrastructure is an entity equipped with sensors able to gather information from applications or from the system. Within this context, it is important to notice that goals and constraints are defined using data measurable by means of a monitoring infrastructure. An adaptation policy is an element whose purpose is to observe applications through monitors, decide on a strategy to change the overall behavior of applications or the system, and act via a set of predefined actuators, with the objective of meeting goals and satisfying constraints. A self-optimizing application is a special kind of application in which the roles of application and adaptation policy coexist. The three distinct classes of components cooperate to establish the ODA control loops as highlighted in Figure 1. Two distinct roles take shape: application developers and system developers. Application developers create applications and, if required, instrument them to provide userdefined goals and execution progresses to the self-adaptive system. System developers design and implement monitoring infrastructures and adaptation policies; monitoring infrastructure can be either active (i.e., requiring to manually instrument the applications) or passive, and allow the selfadaptive system to collect as much information as possible, while the adaptation policies provide as many ways as possible to change the behavior of the self-adaptive system. We propose Metronome, a framework capable of exploiting the availability of user-defined performance goals and measures collected through Heart Rate Monitor (HRM) to enhance the scheduling infrastructure of a commodity operating system by means of Performance–Aware Fair Scheduler (PAFS). PAFS is an adaptation policy demonstrating the applicability of the methodology over the Completely Fair Scheduler (CFS), the scheduling infrastructure of the Linux kernel. Extending a commodity operating system kernel such as Linux comes naturally, since it is widespread and natively collects most of the information to take informed decisions and actions.
3. METHODOLOGY
4.
Our methodology requires partitioning the components that make the system self-adaptive in three distinct classes: applications, monitoring infrastructures, and adaptation policies. An application is an element capable of making one or more entities of the system aware of its goals and progresses;
The ideas behind Heart Rate Monitor (HRM) resemble those at the base of Application Heartbeats and exploit the well–known idea of heartbeat, already used in the past for measuring performance and signaling both progresses and availability [11]. Hoffmann et al. [16] proposed the Applica-
System
Figure 1: System architecture diagram showing the relations incurring among system, applications, monitoring infrastructures, and adaptation policies.
HEART RATE MONITOR
tion Heartbeats Application Programming Interface (API). It is a simple yet effective interface [14, 18, 17] for application developers to express both performance goals and execution progresses and for system developers to retrieve performance measures. The open source implementation of the Application Heartbeats API [1] is a simple and portable user–space active monitoring infrastructure. However, the implementation is mostly unaware of multi–core processors, lacking support for diverse parallelization models and using synchronization, causing serialization, when expressing execution progresses. HRM is an active monitoring infrastructure integrated within Linux. HRM borrows from the generic Application Heartbeats API providing a multi–core processors aware implementation supporting diverse parallelization models and avoiding synchronization. The design of HRM makes its porting to new platforms a negligible task2 without losing in functionality. HRM comes with a slightly modified API with respect to the Application Heartbeats API. However, it still allows application developers to easily instrument applications and system developers to build both user and kernel– space adaptation policies. The interaction model between applications and adaptation policies can be seen, similarly to PEM [10], as a producer/consumer model in which applications work as producers and adaptation policies work as consumers, with the monitoring infrastructure in the middle.
4.1 Definitions This section provides a set of definitions to better understand the remainder of this paper. A running instance of a program, including both its code and data, is called a process; a unique Process IDentifier (PID) identifies a process in Linux. A thread is a finer grained unit of execution and conceptually exists within a process, sharing both the code and the data with other sibling threads; in Linux, a unique Thread IDentifier (TID) identifies a thread. A task is any unit of execution, being either a process or a thread. Given these definitions, an application can be defined as a set of tasks pursuing a set of objectives (e.g., encoding an audio/video stream). Being a set of tasks, an application can be single–threaded, multi– threaded, multi–processed, or any combination of them and a monitoring infrastructure should account for this. A heartbeat is a signal emitted by any task of an application at a certain point in the code indicating execution progresses. A hot–spot is a performance–relevant portion of code executed by any task of an application and usually abstracts the most time consuming portion of an application. It is useful to define the concept of group 3 ; a group is a subset of an application’s tasks pursuing a common objective (e.g., encoding a video stream in audio/video encoder). Groups are non–intersecting subsets meaning a task belongs to only one group at a time. It is important to notice how such a constraint does not neglect the existence of multi–grouped applications (e.g., a group encoding the audio stream and a group encoding the video stream in an audio/video encoder), a case Application Heartbeats completely neglects. The concept of group is key to support diverse paralleliza2 The design of HRM makes the porting process from Linux to other kernels (e.g., BSD kernels) a straightforward task. 3 This definition of group does not relate to any other group currently supported in Linux nor in other UNIX–like operating systems.
tion models, the only thing needed is to link a task, being it a process or a thread, to a group. Within HRM, a unique Group IDentifier (GID) identifies a group. Given the definitions of hot–spot and group, it is possible to define a many– to–one relations between such entities. Each of the tasks belonging to a group executes the same hot–spot, which is characterized by its heartbeats count, performance measures, and performance goal. The heartbeats count is linked to the number of times the hot–spot is executed. Performance measures are expressed in heartbeats per second and capture the concept of heart rate, which is the frequency at which tasks emit heartbeats. The performance goal is expressed as a desired heart rate range, delimited by a minimum heart rate and a maximum heart rate.
4.2
Evaluation
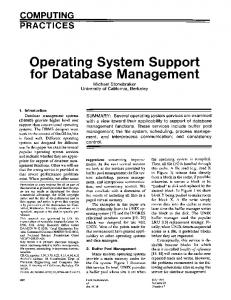
The implementation of HRM is an extension of Linux. In the remainder of this section, we compare HRM to the open source implementation of the Application Heartbeats API [1] looking towards efficiency. Experimental results were collected on a workstation equipped with a single Intel Core i7–870 quad–core processor running at 2.97 GHz featuring 8 MB of shared LLC (L3), 4 GB of DDR3–1066 non– ECC RAM, and a 500 GB 7200 RPM SATA2 hard disk. Advanced features such as Intel Hyper–Threading Technology, Intel Turbo Boost Technology, and Enhanced Intel SpeedStep Technology were disabled. The AMD64 version of Debian 6.0, alias “squeeze”, was configured to run the Linux kernel [3] 2.6.35.13 extended with HRM. We evaluated the overhead of the two monitoring infrastructures through a multi–threaded micro–benchmark. The micro–benchmark allows specifying the level of parallelism (i.e., the number of threads to spawn) and the amount of heartbeats to emit. Since the hot–spot of this application is a tight loop emitting heartbeats, the heart rate (i.e., the throughput) quantifies the overhead of the employed monitoring infrastructure: the higher the throughput, the lower the overhead. Figure 2 shows the throughput emitting 1 million heartbeats varying the amount of parallelism from 1 to 8 threads. The experimental results yield evidence of how HRM outperforms the open source implementation of the Application Heartbeats API. HRM scales almost perfectly with the number of threads. As expected, the peak performance of HRM is obtained with 4 threads, which saturate the quad–core processor of the workstation. According to the experimental results, HRM poses a worst–case overhead between 1 and 2 orders of magnitude (up to a 160× factor) lower than the open source implementation of the Application Heartbeats API. We argue the advantage is due to the multi–core processor aware design accounting for issues such as synchronization and cache sharing [25]. The open source implementation of the Application Heartbeats API employs a protected shared data structure; synchronization guarantees its consistency. The emission of heartbeats requires synchronization among threads, imposing their serialization, potentially compromising applications scalability and it is synchronous with the performance measures computation. Moreover, time–consuming boundary crosses between user and kernel–space occur when retrieving the wall–clock time. Conversely, HRM adopts a data structure distributed among all the threads of a group and across the user and kernel–space boundary. The emission
Throughput [heartbeats/s]
Application Heartbeats API open source implementation
Heart Rate Monitor
109 108 107 106 1
2
3
4 5 Threads
6
7
8
Figure 2: Average micro–benchmark throughput emitting 1 million heartbeats with 1 to 8 threads over 1000 executions. The Y–axis is log–scaled. Higher is better. of heartbeats reduces to an atomic increment of a cache line–aligned per–thread counter, while a kernel–space high– precision timer handler computes the performance measures asynchronously, with a MapReduce–like model [13]. The asynchronous computation avoids time–consuming boundary crosses.
5. PERFORMANCE–AWARE FAIR SCHEDULER Within an operating system, the scheduling infrastructure is the component in charge of determining the allotment of the available computational resources to the running tasks. The choice of the policy or policies ruling the scheduling infrastructure can highly impact the behavior of the system, favoring either run time (i.e., throughput), latency (i.e., response time), or overall fairness (i.e., wait time). This trade– off can usually be statically tuned in commodity operating systems. Due to its high impact on the behavior of the system, the scheduling infrastructure represents a suitable component in which adaptive capabilities can be embedded, enabling it to pursue user-defined performance goals. Performance–Aware Fair Scheduler (PAFS) is an adaptation policy extending the scheduling infrastructure of Linux; more precisely, it enhances Completely Fair Scheduler (CFS), which is one of the subclasses of the hierarchical scheduling infrastructure found in Linux. PAFS exploits the information provided by HRM (i.e., performance measures and user-defined performance goals) to introduce performance– awareness, a new factor that is taken into account when defining fairness. At first glance, PAFS can be misleadingly considered a sort of (soft) real–time scheduling infrastructure [8] with a QoS definition based on the user–defined performance goals. However, since we extended a best–effort scheduling infrastructure without altering all of its desirable properties (e.g., management of both legacy and non–legacy applications, non-starvation, absence of admission control, etc.), PAFS cannot provide any guarantees on matching user–defined performance goals.
5.1 Design The definition of fairness of CFS regards processor time; the basic idea is simple: being fair in providing processor
time to tasks. When the time for tasks is out of balance (i.e., one or more tasks are not given a fair amount of time relative to others), then those out-of-balance tasks should be given time to execute. CFS maintains the amount of processor time provided to a given task in what is called the virtual run–time. The smaller a task’s virtual run–time the higher its need for the processor4 . All runnable tasks are sorted in a time–line implemented with a red–black tree5 according to the key value reported in Equation (1), where i represents the i–th task, vruntimei is the virtual run–time of the i–th task, and vruntimemin is minimum virtual run–time within the time–line. vruntimei − vruntimemin
(1)
Tasks with the gravest need for processor time (i.e., lowest virtual run–time) are located toward the left side of the tree while tasks with the least need for processor time (i.e., highest virtual run–times) are located toward the right side of the tree. The scheduling infrastructure always picks up the left–most task in the time–line; the task makes use of its processor time, its virtual run–time is updated, and then it is put into the time–line again. In this way, tasks on the left side are given processor time and tend to migrate to the right side. The virtual run–time is updated as reported in Equation (2), where i represents the i–th task, ∆exectimei is the execution time spent by the i–th task, wi is the weight associated with the nice value of the i–th task, and w0 is the weight associated with nice value 0. vruntimei = vruntimei +
∆exectimei × w0 wi
(2)
PAFS harnesses this infrastructure and, at each update of the virtual run–time of a non–legacy application’s task, it weighs the execution time using a performance–aware indicator, according to Equation (3), g(i) represents the group (i.e., the HRM group) containing the i–th task, Πg(i) is the performance–aware indicator of the g(i) group, heart rateg(i) is the current heart rate of the g(i) group, and heart rateg(i) is computed according to Equation (4) and represents the user–defined performance goal. In Equation (4) min heart rateg(i) and max heart rateg(i) are respectively the lower bound and the upper bound of the desired heart rate window. heart rateg(i) Πg(i) = (3) heart rateg(i) min heart rateg(i) + max heart rateg(i) 2 (4) The performance–aware indicator is greater than 1 when the g(i) group’s current heart rate is over the middle of the desired heart rate window), it is bounded between 0 and 1 when the g(i) group’s current heart rate is below the middle of the desired heart rate window. When the g(i) group is either over (i.e., heart rateg(i) > max heart rateg(i) ) or under (i.e., heart rateg(i) < min heart rateg(i) ) performing, the virtual run–time of tasks belonging to non–legacy heart rateg(i) =
4
The definition of fairness of CFS also accounts for sleeping tasks (e.g., tasks waiting for I/O operations); sleeping tasks receive a fair amount of processor time when they eventually need it. 5 A red-black tree is a self–balancing binary tree where the left–most leaf has the smallest key value.
vruntimei = vruntimei +
∆exectimei × Πg(i) × w0 (5) wi
Weighing the execution time spent by tasks belonging to non–legacy application through the performance–aware indicator either speeds up or slows down the migration of task from the left side to the right side of the time–line according to their performance measure and performance goal. Moreover, the non–starvation property of CFS is preserved, since we impose a minimum value grater than 0 for the performance–aware indicator.
5.2 Evaluation The implementation of PAFS is an extension of CFS of Linux. Experimental results were collected using the same workstation described in Section 4.2; the AMD64 version of Debian 6.0, alias “squeeze”, was configured to run Linux 2.6.35.13 extended with both the HRM and PAFS. We evaluated PAFS with 3 different workloads, each synthesized using two 4–threaded applications from the PARSEC 2.1 benchmark suite. The first workload (i.e., mix 1 ) comprised facesim and ferret. Facesim is a virtual reality application simulating the underlying physics of a human face and generating corresponding frames. Ferret is a content–based similarity search application. The second workload (i.e., mix 2 ) consisted of blackscholes and swaptions. Blackscholes is an application to price portfolios of options using partial differential equations. Swaptions is an application to price portfolios of options using Monte Carlo experiments. The third workload (i.e., mix 3 ) embodied facesim and fluidanimate, which is a virtual reality application simulating the underlying physics of an incompressible fluid. We ran each workload with CFS (i.e., legacy execution) and PAFS (i.e., non–legacy execution). Regarding the non– legacy execution, we defined reachable performance goals, advantaging either one application or the other. Table 1 reports the execution time for each application and workload; PAFS consistently ends the execution of the entire workload before CFS. Figure 3 highlights how PAFS constantly reduces the normalized mean squared error between the performance measure (i.e., the current heart rate) and the performance goal (i.e., desired heart rate window). Figure 4 provides insights regarding the first workload and PAFS behavior. The execution time of facesim is higher than the execution time of ferret; when ferret ends its execution, the performance measure of facesim grows with both CFS (see Figure 4a) and PAFS (see Figure 4b). The weighing of the virtual runtime is not enough to constrain the performance measure of an application when there is little to no contention. This behavior explains the high values of the normalized mean squared error reported in Figure 3 for both facesim and, consequently, mix 1.
6. CONCLUSIONS This paper presented Metronome, a framework to enhance Linux with self–adaptive computing capabilities. Metronome features a monitoring infrastructure, namely HRM, and an adaptation policy, namely PAFS. HRM computes
1.0 Norm. Mean Squared Error
applications is updated as reported in Equation (5), while it is still updated as reported in Equation (2) if the g(i) group is performing within the desired heart rate window (i.e., min heart rateg(i) < heart rateg(i) < max heart rateg(i) ).
0.8 0.6 0.4 0.2 0
m rret ix 1 oles ions ix 2 sim ate ix 3 fe m ksch apt m face anim m c sw id bla flu
esi
fac
Figure 3: Normalized mean squared error between the performance measure and the performance goals of the non–legacy executions with PAFS where 1.0 is the normalized mean squared error of the legacy execution with CFS. Lower is better. performance measures for non–legacy applications and allows them to expose user–defined performance goals. PAFS drives non–legacy applications towards meeting user–defined performance goals, modifying the scheduling infrastructure of Linux. HRM represents an improvement with respect to Application Heartbeats, an open source, state–of–the– art monitoring infrastructure, both in terms of functionality and performance. In addition, the methodology at the very base of Metronome decouples non–legacy applications from adaptation policies, which become completely transparent to them thanks to the presence of monitoring infrastructures, leaving a lot of space for further improvements.
7.
REFERENCES
[1] Application Heartbeats. http://code.google.com/p/heartbeats/. [2] Linux Programmer’s Manual. http://kernel.org/doc/man-pages/. [3] The Linux Kernel. http://www.kernel.org/. [4] J. Ansel, C. Chan, Y. L. Wong, M. Olszewski, Q. Zhao, A. Edelman, and S. Amarasinghe. PetaBricks: A Language and Compiler for Algorithmic Choice. In Proceedings of the 2009 ACM SIGPLAN Conference on Programming Language Design and Implementation, 2009. [5] W. Baek and T. M. Chilimbi. Green: A Framework for Supporting Energy–Conscious Programming using Controlled Approximation. In Proceedings of the 2010 ACM SIGPLAN Conference on Programming Language Design and Implementation, 2010. [6] C. Bienia. Benchmarking Modern Multiprocessors. PhD thesis, Princeton University, 2011. [7] R. Bitirgen, E. Ipek, and J. F. Martinez. Coordinated Management of Multiple Interacting Resources in Chip Multiprocessors: A Machine Learning Approach. In Proceedings of the 41st Annual IEEE/ACM International Symposium on Microarchitecture, 2008. [8] S. A. Brandt, S. A. Banachowski, C. Lin, and T. Bisson. Dynamic Integrated Scheduling of Hard Real–Time, Soft Real–Time and Non–Real–Time Processes. In 24th IEEE Real–Time Systems Symposium, 2003. [9] S. Browne, J. Dongarra, N. Garner, G. Ho, and P. Mucci. A Portable Programming Interface for Performance Evaluation on Modern Processors. International Journal of High Performance Computing Applications, 14(3), 2000. [10] C. Cascaval, E. Duesterwald, P. F. Sweeney, and R. W.
Completely Fair Scheduler Std. Mean [s] Std. Deviation [s]
Application
mix 1
facesim ferret
250.890 163.337
0.169 0.247
240.310 131.402
0.237 0.126
mix 2
blackscholes swaptions
92.819 131.931
0.059 0.028
108.659 103.431
0.037 0.017
mix 3
facesim fluidanimate
237.206 184.537
0.673 0.444
227.559 212.766
0.679 0.405
facesim
3
ferret
2
1
0
Performance–Aware Fair Scheduler Std. Mean [s] Std. Deviation [s]
Workload
0
50
100 150 Time [s]
200
250
(a) Legacy executions with CFS.
Norm. Heart Rate [heartbeats/s]
Norm. Heart Rate [heartbeats/s]
Table 1: Standard mean and standard deviation of the execution time for each application and workload run with CFS and PAFS over 100 executions
facesim
3
ferret
2
1
0
0
50
100 150 Time [s]
200
250
(b) Non–legacy executions with PAFS.
Figure 4: Normalized current heart rates for mix 1 where [0.95, 1.05] is the normalized performance goal (i.e., gray–shaded area). Nearer the gray–shaded area is better.
[11]
[12]
[13]
[14]
[15] [16]
[17]
Wisniewski. Performance and environment monitoring for continuous program optimization. IBM Journal of Research and Development, 50(2.3), 2006. W. Chen, S. Toueg, and M. Aguilera. On the Quality of Service of Failure Detectors. IEEE Transactions on Computers, 51(1), 2002. T. Cucinotta, F. Checconi, L. Abeni, and L. Palopoli. Self–tuning Schedulers for Legacy Real–Time Applications. In Proceedings of the fifth European Conference on Computer Systems, 2010. J. Dean and S. Ghemawa. MapReduce: Simplified Data Processing on Large Clusters. In Proceedings of the 6th USENIX Symposium on Operating Systems Design and Implementation, 2004. J. Eastep, D. Wingate, M. D. Santambrogio, and A. Agarwal. Smartlocks: Lock Acquisition Scheduling for Self–Aware Synchronization. In Proceedings of the seventh International Conference on Autonomic Computing, 2010. S. Fuller and L. Millett. Computing Performance: Game Over or Next Level? Computer, 44(1), 2011. H. Hoffmann, J. Eastep, M. D. Santambrogio, J. E. Miller, and A. Agarwal. Application Heartbeats: A Generic Interface for Specifying Program Performance and Goals in Autonomous Computing Environments. In Proceedings of the seventh International Conference on Autonomic Computing, 2010. H. Hoffmann, M. Maggio, M. D. Santambrogio, A. Leva, and A. Agarwal. SEEC: A Framework for Self–aware Management of Multicore Resources. Technical Report MIT–CSAIL–TR–2011–016, Massachusetts Institute of Technology, Computer Science and Artificial Intelligence Laboratory, 2011.
[18] H. Hoffmann, S. Sidiroglou, M. Carbin, S. Misailovic, A. Agarwal, and M. C. Rinard. Dynamic knobs for responsive power–aware computing. In Proceedings of the 16th International Conference on Architectural Support for Programming Languages and Operating Systems, 2011. [19] E. Ipek, O. Mutlu, J. F. Mart´ınez, and R. Caruana. Self–Optimizing Memory Controllers: A Reinforcement Learning Approach. In Proceedings of the 35th Annual International Symposium on Computer Architecture, 2008. [20] J. O. Kephart and D. M. Chess. The Vision of Autonomic Computing. Computer, 36(1), 2003. [21] M. Salehie and L. Tahvildari. Self–Adaptive Software: Landscape and Research Challenges. ACM Trans. Auton. Adapt. Syst., 4(2), 2009. [22] D. D. Silva, O. Krieger, R. W. Wisniewski, A. Waterland, D. K. Tam, and A. Baumann. K42: An Infrastructure for Operating System Research. SIGOPS Oper. Syst. Rev., 40(2), 2006. [23] B. Sprunt. Managing The Complexity Of Performance Monitoring Hardware: The Brink Andabyss Approach. International Journal of High Performance Computing Applications, 20(4), 2006. [24] N. Thomas, G. Tanase, O. Tkachyshyn, J. Perdue, N. M. Amato, and L. Rauchwerger. A Framework for Adaptive Algorithm Selection in STAPL. In Proceedings of the Tenth ACM SIGPLAN Symposium on Principles and Practice of Parallel Programming, 2005. [25] E. Z. Zhang, Y. Jiang, and X. Shen. Does cache sharing on modern CMP matter to the performance of contemporary multithreaded programs? In Proceedings of the 15th ACM SIGPLAN Symposium on Principles and Practice of Parallel Programming, 2010.
APPENDIX A. HEART RATE MONITOR This section explains the design and implementation of HRM (see Appendix A.1) and shows additional experimental results gathered during the evaluation of HRM (see Appendix A.2).
kthread x
A.1 Design and Implementation
A.1.1
User–space
The user–space partition of HRM is implemented through a library, namely libhrm, exposing the API for both producers (i.e., applications) and consumers (i.e., adaptation policies). The complete API is reported in Table 2. The API exposes a function to attach the current task to the group identified by GID as either a producer or a consumer: hrm_attach; this function involves multiple boundary crosses since it switches from user to kernel–space to setup data structures, memory, and timers. Once the virtual memory is mapped, the current task can set the user–defined performance goal making it system–wide available through: hrm_set_min_heart_rate, hrm_set_max_heart_rate, and hrm_set_window_size. These three functions respectively set the lower bound over the performance measure, the upper bound over the performance measure, and the amount of sample to use to compute the window heart rate. As highlighted in Table 2, the functions to set the user–defined performance goal are accessible to producers only, while consumers are allowed to call the functions to retrieve the user– defined performance goal: hrm_get_min_heart_rate, hrm_get_max_heart_rate, and hrm_get_window_size. Performance measures can be retrieved, like the user–defined performance goal, by either producers or consumers through: hrm_get_global_heart_rate and hrm_get_window_heart_rate. HRM provides both a global performance measure and a window performance measure because different applications may be concerned with either long or short–term trends. The global performance measure is supposed to catch long–term trends since it averages the whole execution of an application while the window performance measure is meant to capture short–term trends being a moving average. Short–term trends should be intended as variable– length trends since the length is controlled by the window size, which is part of the user–defined performance goal, and the timer period, which is a kernel compile time parameter controlling the update frequency for the performance measures. The most important function exported by libhrm is heartbeat. Calls to this function are inserted within the hot–spot of an application to signal progresses in the execution; the amount of progresses can be specified through the integer parameters the function accepts.
kthread y
group
HRM is an active monitoring infrastructure designed to be simple, effective, and efficient. Simplicity is achieved through a very compact API; effectiveness comes with the support of diverse parallelization models through groups and the support of both user and kernel–space adaptation policies; finally, efficiency is achieved thanks to the partitioned design between user and kernel–space accounting for multi– core related issues such as synchronization and cache sharing.
kthread z
counter pages
measures goal page
Figure 5: Data structure involving the linked–list of groups and the linked–list of producers and consumers (per group), set of pages to store per thread counters, and single page to store both the performance measures and the performance goal.
A.1.2
Kernel–space
The kernel–space partition of HRM is implemented as an extension of the Linux kernel and can be considered the core of the active monitoring infrastructure. The basic data structure behind HRM is a linked–list of groups, shown in Figure 5. The linked–list of groups is protected by a global spinlock, which is needed to guarantee consistency when modifying the linked–list (i.e., group addition or deletion). More common operations involving a single group are not required to own the global spinlock; instead, they may be required to own the members read– write lock (read/write lock). A read/write lock was chosen instead of a spinlock because of the unbalance between read and write operations over the linked–lists of producers and consumers. Each group allocates a set of pages to store per thread counters (i.e., default 1 page up to 16 pages6 ) and a single page to store both the performance measures and the performance goal as depicted in Figure 5. As Figures 6 and 7 shows, pages are shared across the kernel and the user address spaces; moreover, since HRM supports diverse parallelization models through the concept of group, pages may be shared across multiple user address spaces since each of the user thread may belong to a different process. Figure 6 gives a more accurate view of the layout of the pages storing the counters; as the least significant portion of the addresses highlight, each counter is aligned to the size of the cache line. Cache line alignment results in a slightly less efficient use of the available memory; however, we argue the performance improvements due to cache line alignment on multi and many–core processor and especially on multi–processor systems, which necessitate off–chip communication to maintain cache coherency, is such that more memory can be allocated, being an increasingly available resource in modern computing systems. The content of the 6
The limit of 16 pages to store per thread counters is completely arbitrary and can be boosted through the Linux kernel configuration utility.
Table 2: libhrm API1,2 Function
Description
hrm_attach(int gid, bool_t consumer) hrm_detach()
Attach the current task to the group identified by gid as either a producer or consumer Detach the current task
hrm_set_min_heart_rate(uint32_t min_heart_rate)3 hrm_set_max_heart_rate(uint32_t max_heart_rate)3 hrm_set_window_size(size_t window_size)3
Set the minimum heart rate in the user–defined performance goal Set the maximum heart rate in the user–defined performance goal Set the window size in the user–defined performance goal
hrm_get_min_heart_rate(uint32_t *min_heart_rate) hrm_get_max_heart_rate(uint32_t *max_heart_rate) hrm_get_window_size(size_t *window_size)
Get the minimum heart rate from the user–defined performance goal Get the maximum heart rate from the user–defined performance goal Get the window size from the user–defined performance goal
hrm_get_global_heart_rate(uint32_t *global_heart_rate) hrm_get_window_heart_rate(uint32_t *window_heart_rate)
Get the global heart rate from the performance measure Get the window heart rate from the performance measure
int heartbeat(uint64_t n)3
Emit n heartbeats
1
Every function receive an additional parameter of type hrm_t * pointing to the underlying data structure Every function return a value of type int containing either 0 or an error number 3 Every task attached as a consumer is not allowed to call this function
2
kthread 1
thread 1
kthread 1
thread 1
thread 2
kthread 2
thread 2
0x…0000
kthread 2
0x…0040
0x…0000 0x…0FC0
0x…0040
0x…1000 0x…1040
kthread n
0x…1FC0
thread n
Figure 6: Memory layout and access pattern of the pages storing per thread counters.
pages devoted to store the counters is the most critical to HRM since it can be concurrently accessed at a high rate by both the kernel and user threads. Distribution avoid synchronization among user threads, while heavy weight synchronizations between kernel and user–space are avoided by adopting atomic operations; hence, a function call to heartbeat reduces to an atomic increment of a per–thread counter. Due to cache line alignment, the number of counters is architecture–dependent; the reference implementation of HRM allocates standard sized pages whose size is 4 kB, while the size of cache lines of x86 and x86–64 processors is 64 bytes, with such parameters, each page can contain up to 64 counters. Figure 7 shows the single page each group allocates to store both the performance measures and the performance goal; conversely to what happens with the counters, the performance measures and the performance goals are not distributed across the group. As reported in Section 4, HRM provides both a global heart rate (i.e., long–term performance measure) and a window heart rate (i.e., short–term performance measure); they are respectively computed according to Equations (6) and (7) in which g indicates the group, t is the current time stamp, t0 is the group creation time stamp, and tw is the time stamp at which win-
kthread n
thread n
Figure 7: Memory layout and access pattern of the page storing the performance measures and the performance goal. dow started. The performance measures are asynchronously updated by the kernel in the context of a High–Resolution (HR) timer after acquiring the members read–write lock in read mode; the adoption of asynchronous updates for performance measures avoids boundary crosses to retrieve the current time stamp. The period of the HR timer can be tuned through a kernel compile time parameter. P i cnti (t) ghrg (t) = (6) t − t0 P i cnti (t) − cnti (tw ) whrg (t) = (7) t − tw The performance goal is made up of a lower and an upper bound defining a heart rate range; moreover, the performance goal contains also the window size to compute the window heart rate. HRM extends the proc(5) process information pseudo– file system (procfs) [2] to provide all the necessary entry points to attach (detach) threads to (from) a group and mmap(2) [2] the pages storing per thread counters and both the performance measures and the performance goal.
HRM
4x
HRM (optimized)
HRM (optimized)
1.5x Speedup
Speedup
3x 2x 1x 0x
HRM
2.0x
1.0x 0.5x
1
2
3
4 5 Threads
6
7
0x
8
1
2
3
4 5 Threads
6
7
8
Figure 8: Speedup on the throughput of the optimized vs. non–optimized implementation of HRM with 1 to 8 threads over 1000 executions. Peak performance should be reached with 4 threads since the workstation features a quad–core processor. Higher is better.
Figure 9: Speedup on the throughput of the optimized vs. non–optimized implementation of HRM with 1 to 8 threads over 1000 executions. Peak performance should be reached with 2 threads since the workstation features a dual–core processor. Higher is better.
A.2 Evaluation
and the heart rate computation period was set to 100 ms. Table 3 put forth evidence that HRM imposes low monitoring overhead on real applications, with a maximum of 1.26% for facesim.
As reported in [25], cache sharing is an important factor in modern multi–core processors and, we add, in multi– processor systems. The initial implementation of HRM did not adopt any smart page layout, allowing more than one per–thread counter to reside in a single cache line. False sharing of cache lines resulted in an unexpected contention over the memory hierarchy and suboptimal performance. Figure 8 shows the speedup thanks to page layout optimization; experimental results were collected on the same workstation and with the same procedure described in Section 4.2 using the non–optimized and the optimized implementations of HRM; note how HRM scales almost perfectly reaching 3.7× speedup with 4 threads. The same experiment was repeated on a second workstation equipped with a single Intel Pentium D 820 dual–core processor running at 2.80 GHz featuring 1 MB of core private LLC (L2) per core, 2 GB of DDR2–800 non–ECC RAM, and a 250 GB 7200 RPM SATA hard disk. Enhanced Intel SpeedStep Technology was disabled. The AMD64 version of Debian 6.0, alias “squeeze”, was configured to run the Linux kernel 2.6.35.13 extended with HRM. Due to the per– core private last–level cache, cache coherency necessitate off–chip communication through the Front–Side Bus (FSB) and the northbridge; this limitation makes the workstation more similar to a multi–processor system instead of a multi– core processor system. Figure 9 shows the speedup due to the page layout optimization when costly off–chip communication is employed to maintain cache coherency. When 2 threads are employed, the non–optimized implementation of HRM incurs in a sensible slowdown while the optimized implementation of HRM scales almost linearly (i.e., speedup near 2×) showing the real advantage of the smart page layout. To further investigate the implications of HRM, experimental results were collected on the same workstation described in Section 4.2 using 5 out of 13 applications of the PARSEC 2.1 benchmark suite. For the non–legacy applications, HRM was setup to provide only the global heart rate
B.
PERFORMANCE–AWARE FAIR SCHEDULER
This section provides insights regarding the second and the third workloads described in Section 5.2, whose results were reported in Table 1 and Figure 3 (see Appendix B.1).
B.1
Evaluation
Figure 10 explains the very low normalized mean squared error reported in Figure 3 for the first workload. Both blackscholes and swaptions are fairly regular applications; as Figure 10b shows, their behavior is simple to anticipate and control and they can be driven towards their performance goal. Figure 11 provides insights regarding the third workload and PAFS behavior. Facesim is not as regular as either blackscholes or swaption; in fact, the third workload is more complicated to control for PAFS, even though the presence of fluidanimate in place of ferret makes it simpler with respect to the first workload. As Figure 11b shows, the amount of available resources is greater than the amount required to satisfy the performance goals of both the application (i.e., the performance measure of fluidanimate is constantly past the upper bound of the performance goal). Although on a smaller scale, the third workload shows the same behavior of the first in which one of the application (i.e., fluidanimate) ends its execution before the other application (i.e., facesim) whose performance measure starts to increase due to the absence of resource contention. In conclusion, these experiments show how PAFS is able to drive applications’ performance towards a user–defined performance goal in presence of contention over the computational resources (i.e., in this case, processor time).
Application
Legacy Std. Mean [s] Std. Dev. [s]
Non–Legacy Std. Mean [s] Std. Dev. [s]
Overhead
blackscholes facesim ferret fluidanimate swaptions
69.745 140.645 114.856 103.052 83.989
70.541 142.419 114.903 103.088 84.220
1.14% 1.26% 0.04% 0.03% 0.27%
blackscholes
3
0.178 0.810 0.079 0.061 0.128
swaptions
Norm. Heart Rate [heartbeats/s]
Norm. Heart Rate [heartbeats/s]
Table 3: Standard mean and standard deviation of the execution time over 100 consecutive runs of the benchmark suite. The overhead is computed using the ratio between standard mean of the non–instrumented version execution time and the standard mean of the instrumented version execution time
2
1
0
0
20
40
60
80 Time [s]
100
120
140
(a) Legacy executions with the CFS.
0.205 0.716 0.110 0.067 0.124
blackscholes
3
swaptions
2
1
0
0
20
40
60
80 Time [s]
100
120
140
(b) Non–legacy executions with the PAFS.
facesim
3
fluidanimate
2
1
0
0
50
100 150 Time [s]
200
(a) Legacy executions with the CFS.
250
Norm. Heart Rate [heartbeats/s]
Norm. Heart Rate [heartbeats/s]
Figure 10: Normalized current heart rates for mix 2 where [0.95, 1.05] is the normalized performance goal (i.e., gray–shaded area). Nearer the gray–shaded area is better.
facesim
3
fluidanimate
2
1
0
0
50
100 150 Time [s]
200
250
(b) Non–legacy executions with the PAFS.
Figure 11: Normalized current heart rates for mix 3 where [0.95, 1.05] is the normalized performance goal (i.e., gray–shaded area). Nearer the gray–shaded area is better.