for data transmission and power supply to the optical modules. The optical ... bottom network of electro-optical cables and junction boxes. Following the strategy ...
EPJ Web of Conferences 121, 05010 (2016)
DOI: 10.1051/epjconf/201612105010
RICAP-2014
Operation and results of the prototype KM3NeT detection unit Simone Biagi1,2,a on behalf of the KM3NeT Collaboration 1
2
Dipartimento di Fisica e Astronomia dell’Università di Bologna, Viale Berti Pichat 6/2, 40127 Bologna, Italy INFN Sezione di Bologna, Viale Berti Pichat 6/2, 40127 Bologna, Italy Abstract. KM3NeT will be a km3 -scale neutrino telescope in the Mediterranean Sea. The detector will consist of blocks of about one hundred detection units. Each detection unit will host 18 digital optical modules, connected along a 700 m-long vertical structure. Electro-optical cables allow for data transmission and power supply to the optical modules. The optical module comprises 31 photomultiplier tubes of 3�� , instruments to monitor environmental variables and electronic boards to communicate onshore and operate the photomultipliers. A prototype detection unit has been deployed in May 2014 at the KM3NeT-It installation site 80 km SE offshore of Capo Passero, Sicily. This prototype allowed to test the deployment procedures, the mechanics and the electronic of the apparatus, the data taking and analysis procedures. A general description of the detector and some results of the prototype are presented. The first detection unit of the KM3NeT neutrino telescope will be deployed and become operative by the end of 2015.
1. Introduction KM3NeT [1] is a deep-sea research infrastructure hosting a neutrino telescope with a volume of several cubic kilometres currently under construction in the Mediterranean Sea. The pilot projects ANTARES [2], NEMO [3] and NESTOR [4] paved the way to the design, construction and operation of the KM3NeT telescope. It will be composed by thousands of digital optical modules (DOMs), consisting of a 17-inch diameter glass pressure sphere containing 31 3-inch photomultiplier tubes (PMTs) and the front-end electronics (Fig. 1 left); the total photocathode surface is 1260 cm2 [5]. The multi-PMT design provides a large photocathode area, very good separation between single-photon and multiple-photon hits and information on the photon direction. In addition, a single PMT loss minimally degrades the performance. These features improve the track reconstruction performance in a cost-effective way with respect to the use of single PMTs. The detection principle exploits the observation of the Cherenkov light induced by charged particles produced by the interaction of neutrinos with matter inside or in the vicinity of the KM3NeT detector. A group of 18 DOMs distributed over a 700 m mooring line constitutes a detection unit (DU) of the telescope. The DUs are connected to shore via a seabottom network of electro-optical cables and junction boxes. Following the strategy adopted
a Now at INFN Laboratori Nazionali del Sud, via S. Sofia 62, 95123 Catania, Italy; e-mail: simone.biagi@bo. infn.it
� C The Authors, published by EDP Sciences. This is an Open Access article distributed under the terms of the
Creative Commons Attribution License 4.0 (http://creativecommons.org/licenses/by/4.0/).
EPJ Web of Conferences 121, 05010 (2016)
DOI: 10.1051/epjconf/201612105010
RICAP-2014
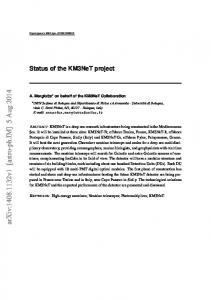
Figure 1. Left: a drawing of the digital optical module. 31 PMTs and the electronics are contained in a glass sphere – see text for details. Right: graphical representation of the PPM-DU installed in the deep water (vertical and horizontal dimensions not in scale). An electro-optical cable, represented with the cyan line marked VEOC, connects the DOMs to the base container; the latter is connected to the onshore station through a jumper cable.
by ANTARES, all data collected by PMTs are sent to shore where they are filtered according to trigger algorithms; no underwater data filtering is implemented. A prototype DOM has been installed in the ANTARES site, 40 km offshore the French coasts close to Toulon, on one ANTARES line [6]. The Pre Production Model Digital Optical Module (PPM-DOM) was deployed in April 2013 and it is operating since its deployment. This qualification project validated the DOM technology and demonstrated the capability to select hits from muons looking for coincidences in time between PMTs inside the DOM.
2. The detector The Pre Production Model Detection Unit (PPM-DU) was deployed during the night between May 6 and 7 2014 at the site located 80 km offshore Capo Passero, Sicily (latitude 36◦ 17� 50�� N, longitude 15◦ 58� 45�� E), at 3457 m depth. It is composed by three DOMs spaced by 36 m and kept vertical by two empty glass spheres that provide buoyancy, see Fig. 1 right. The PPM-DU is 160 m long; the full DU with 18 DOM will be 700 m long. The PPM-DU base is connected with the onshore station through an electro-optical cable of about 100 km length. DOM 1 and DOM 2 are equipped with ETEL D783FLA PMTs, while DOM 3 contains Hamamatsu R12199-02 PMTs. There are small differences in the global efficiency of the two kinds of PMTs that result in a slightly higher counting rate for Hamamatsu PMTs. In addition to the PMTs, each DOM also contains (Fig. 1 left): • a power board to feed the electronics providing the needed voltage levels; • a Central Logic Board (CLB) to operate the PMTs and transmit data to the onshore system; 2
EPJ Web of Conferences 121, 05010 (2016)
DOI: 10.1051/epjconf/201612105010
RICAP-2014 • • • • •
two “Octopus boards” to power the PMTs and connect them with the CLB; a LED beacon pointing upward for time calibrations between PMTs and DOMs; a piezo sensor for acoustic measurements; a compass and tiltmeter for relative positioning; a temperature and relative humidity sensor to monitor the environmental conditions inside the DOMs.
The PPM-DU is installed on the sea bed using a mechanical spherical structure that houses the full line. Once on the sea bottom, an acoustic release allows the unfurling of the line, and the mechanical spherical structure can be recovered at the sea surface. With the help of a Remotely Operated Vehicle (ROV), the electro-optical cable is then connected with the base of the PPM-DU, providing power supply and allowing communication with the onshore station. The detector was successfully operated from its deployment until its decommissioning in July 2015.
3. Calibration and data analysis The PPM-DU provides useful information to characterise the marine site and to better understand the properties of the DOM. An interesting parameter that is taken under control is the counting rates measured on every PMT. Mean rates show whether the PMTs are well calibrated and give information on the total PMT efficiency. Single hit rates for the PMTs of the three DOMs are shown in Fig. 2 left. For every PMT, the mean rate is evaluated from the distribution of time differences between consecutive hits. The tail of the time difference distribution is fitted with an exponential: f (�t) = p0 · e−p1 ·�t where p0 is a scaling factor, p1 is the single hit rate and �t is the time difference. The values in the plot are evaluated from one run of 30� . Two PMT channels are switched off: channel 14 in DOM 2 due to hardware problems, channel 27 in DOM 3 due to anomalous high counting rates. All PMTs appear to be well calibrated since the mean rates are all about 5–6 kHz. This value is compatible with the expected hit rate due to the radioactive decay of 40 K present in sea water [7]. It was checked that these values are stable over time scales of months. The relative time calibration of the detector is done through the evaluation of the time offsets between PMTs and between DOMs. The time offsets can be classified in: • Intra-DOM time offsets (between PMTs) – they depend on the electronics inside the DOM and the PMT properties; • Inter-DOM time offsets (between DOMs) – they mainly depend on the cable lengths and slightly on the electronics. The travel time of light in sea water must be taken into account in this calibration procedure. The intra-DOM time offsets are evaluated studying the local coincidences between DOMs inside the same DOM. These local coincidences are correlated with the signal from 40 K decay. A �2 minimisation procedure is applied to coincidences between all PMT pairs in a DOM, in order to obtain the relative time offsets, the PMT detection efficiencies and the intrinsic time-spreads of all PMTs. The inter-DOM time calibration is performed using the DOM with the flashing LED beacon and the DOM directly on top of it. The LED beacon installed in each DOM has a wavelength of 470 nm and is positioned in the top half of the DOM pointing upwards. LED beacons are controlled with adjustable frequency and intensity in order to illuminate the next DOM of the line without invoking a High Rate Veto of the PMTs. The time accuracy 3
EPJ Web of Conferences 121, 05010 (2016)
DOI: 10.1051/epjconf/201612105010
RICAP-2014
Figure 2. Left: single hit rates for the 31 PMTs of the DOMs. Rates are evaluated from a 30’ run – see text. DOM 3 has slightly higher vales because it contains Hamamatsu PMTs that show a higher global efficiency respect to ETEL ones, mounted in DOM 1 and DOM 2. Right: distribution of differences in time between correlated hits in DOM 1 and DOM 2 for data and MC.
achieved is of the order of ∼ 2 ns. Some tests have been done with PPM-DU LED beacons in coincidence with the laser beacon located in the base of the prototypal tower detection unit, installed in the site at a distance of about 60 m from PPM-DU [8]. A dedicated MC simulation framework, based on the ANTARES software [9], has been modified for the PPM-DU geometry. The simulation chain consists of the generation of atmospheric muons and their propagation in rock and sea water, the generation of Cherenkov light and the digitisation of the PMT signals. The PMT characteristics and the optical water properties measured at the Capo Passero site [10] are taken into account in the simulation. Data taken in June-July 2014, corresponding to 80 hours of equivalent livetime, are compared to Monte Carlo (MC) simulations to double check the results of the time calibrations. The L1 trigger is defined as a time coincidence between two hits from different PMTs in the same DOM within 10 ns. Data and MC are triggered in order to have at least one L1. The time differences between DOM 1 and DOM 2 for events that trigger both corresponding DOMs are shown in Fig. 2 right. The MC is normalised to data. The time of the data is corrected with the relative time offsets obtained through the intra-DOM and inter-DOM calibration procedures. A good agreement is found showing the accuracy of the entire procedure. A search for coincidences between PMTs and DOMs is optimised to select atmospheric muon events. A multiple coincidence is defined as all hits inside a DOM taken in time window of 130 ns around L1 triggers. Figure 3 left shows the rate of multiple coincidences for the three DOMs in the period June-July 2014, corresponding to 52 hours of equivalent livetime. The first filled bin is for multiple coincidences equal to two, i.e. events with only one L1. According to MC simulations, the blue region identifies the contribution due to muons. The clear change of shape at ≥ 8 identifies the region in which muons are dominant over the optical background due to 40 K. Events selected with at least one L1 trigger in each DOM are essentially background free, as they are all muons. The data-MC comparison shown in Fig. 3 right demonstrates the good agreement with the muon simulations, triggering at least one L1 coincidence on each DOMs. The histogram is filled with hits of the selected events as a function of the orientation of the PMTs inside the three DOMs. 158 runs taken in June–July 2014 are used, corresponding to 80 hours of equivalent livetime. MC is normalised to data. MC simulations contain only muon events. Events due to the 40 K decay only are not simulated. As 3-DOM-triggered events, they are only muons; the contribution from the optical background is negligible. Furthermore, the
4
EPJ Web of Conferences 121, 05010 (2016)
DOI: 10.1051/epjconf/201612105010
RICAP-2014
Figure 3. Left: frequency of multiple hit coincidences for the three DOMs from data taken in June-July 2014. The blue area represents events from muons. Right: distribution of hits as a function of the PMT id for events with one L1 trigger on each DOM. The cyan arrows are oriented as the zenith angle of the PMTs inside the DOM.
asymmetry between the upper and lower part of the DOMs seen in Fig. 3 right is a clear evidence of the downward direction of the atmospheric muons.
4. Conclusions The Pre Production Model Detection Unit was active and took data since its deployment in the Mediterranean Sea until its decommissioning. The complete marine operations for the installation of the DUs (DU deployment on the sea bed, submarine connections with ROV, unfurling procedures) were tested successfully and proved reliable. This prototype project validated the DU structure and provided a test bench for the operation and data handling tools. The calibration procedures developed for the km3 -scale detector were tested and optimised. The PPM-DU helped to improve our knowledge of the marine site, through a long term evaluation of the optical background. This qualification project leaded the way to the forthcoming installation of 24 detection units and 8 towers in the Capo Passero area (KM3NeT-IT) and 7 detection units at the Toulon site (KM3NeT-FR). The electronics inside the DOM for the complete DU has been redesigned in order to improve general performances and achieve an absolute timing of < 1 ns [11]. The detector construction is starting with the installation of the fist DU by the end of 2015. References [1] [2] [3] [4] [5] [6] [7] [8] [9] [10]
http://www.km3net.org M. Ageron et al. (ANTARES Collaboration), Nucl. Instrum. Meth. A 656, 11 (2011) A. Capone et al. (NEMO Collaboration), Nucl. Instrum. Meth. A 602, 47 (2009) P. A. Rapidis, Nucl. Instrum. Meth. A 602, 54 (2009) S. Adrián-Martínez et al. (KM3NeT Collaboration), JINST 8, T03006 (2013) S. Adrián-Martínez et al. (KM3NeT Collaboration), Eur. Phys. J. C 74, 3056 (2014) C. M. F. Hugon, Nucl. Instrum. Meth. A 787, 189 (2015) S. Aiello et al. (NEMO Collaboration), Astropart. Phys. 66, 1 (2015) J. Brunner et al., Proceedings of the First VLVnT Conference, Amsterdam (2003) KM3NeT Technical Design Report, http://www.km3net.org/TDR/TDRKM3NeT. pdf. [11] S. Biagi and A. Orzelli, JINST 9, C12033 (2014) 5