Hindawi Journal of Advanced Transportation Volume 2017, Article ID 2130385, 13 pages https://doi.org/10.1155/2017/2130385
Research Article Operational Efficiency Evaluation of Intersections with Dynamic Lane Assignment Using Field Data Jing Zhao, Jiao Yao, Shengxue He, and Yin Han Department of Traffic Engineering, University of Shanghai for Science and Technology, 516 Jungong Road, Shanghai, China Correspondence should be addressed to Jing Zhao; jing zhao
[email protected] Received 2 October 2016; Accepted 15 December 2016; Published 11 January 2017 Academic Editor: Sunder Lall Dhingra Copyright © 2017 Jing Zhao et al. This is an open access article distributed under the Creative Commons Attribution License, which permits unrestricted use, distribution, and reproduction in any medium, provided the original work is properly cited. The dynamic lane assignment at signalized intersections is a possible countermeasure to address the traffic demand variability problem. However, the operational efficiency is affected by the unfamiliarity of the drivers. This paper evaluates the operational efficiency of the intersections with dynamic lane assignment using field data collected at five intersections in China. A total of 63488 vehicles were captured, which were divided into four groups according to the lanes they drive on: Group 1, the variable approach lane; group 2, the lane adjacent to the variable lane with the same lane-use; group 3, the lane adjacent to the variable lane with different lane-use of the variable lane; and group 4, the lanes with the same lane-use as the variable lane at other approaches of the intersection. The statistical analysis was conducted to identify the difference of saturation flow rate among the four groups. A saturation flow rate adjustment model was established accordingly. Results indicate that the using of the dynamic lane assignment decreases the saturation flow rate of the variable lane and the adjacent lane with different lane-use 22.86% and 9.80%, respectively. For the variable lane, the reduction of the saturation flow rate comes from three aspects: the unequal distribution of traffic (8.9%), the mandatory lane-changing (10.7%), and the lane blockage (4.9%).
1. Introduction In many cities, congestion at intersections continues to worsen as the direct result of ever-increasing traffic demand. Moreover, real-world travel demands are intrinsically fluctuating, and traffic flows at intersections may vary significantly even for the same time of day and day of week [1]. The variability in volumes of turning movements exacerbates the perennial problem of congestion [2]. As one of numerous possible countermeasures to address the traffic demand variability problem, the concept of dynamic lane assignment at signalized intersections was proposed and has been carried out in practice [3, 4]. Different from the commonly used signal timing method, the dynamic lane assignment method directly changes the lane-use dynamically according to the traffic demand. Therefore, it is designed to accommodate situations in which the relationship between supply and demand varies significantly [5]. To date, many lane assignment optimal models have been established to produce the best operational strategy for the
intersections. At the beginning, the lane assignment was designed on a trial-and-error basis. The design scheme was revised by the engineer according to his/her experience until the performance of the intersection was satisfactory. This method, however, may not always produce the optimal set of lane markings [6, 7]. Then an integrated model with mixinteger program was proposed to minimize the sum of flow ratios of all the phases [6]. Results show that substantial improvement in intersection performance can be achieved by combining the design of lane markings and signal timings into a unified framework. Along the same line as the integrated design method, Wong et al. [7–9] further developed lane assignment optimization models using the lane-based approach. In these lane-based models, all key design variables were given on a lane basis. This simplifies the expression of the set of constraints as linear equations and thus ensures the feasibility of the solution algorithm for the optimization model. Wong et al. also use this method to deal with the problem that the traffic demand varies in various periods, for example, the morning peak, off peak, and evening peak periods [10, 11].
2
Journal of Advanced Transportation Table 1: Basic geometry information of the surveyed intersections.
Number 1 2 3 4 5
Intersection
Leg using the dynamic lane assignment
Number of approach lanes
Caoxibei Rd.-Lingling Rd. Tianyaoqiao Rd.-Zhongshan Rd. Yanggaonan Rd.- Huamu Rd. Yanggaozhong Rd.-Yunshan Rd. Xizangbei Rd.-Haining Rd.
North North South West North
3 4 5 5 3
Lane assignment of the approach lanes Lane 1 Lane 2 Lane 3 Lane 4 Lane 5 LT LT LT LT LT
Variable Variable Variable Variable Variable
TH TH TH TH TH
RT TH TH RT
TH + RT TH + RT
Note: the approach lanes are numbered from left to right. LT, TH, and RT refer to the left-turn, through movement, and right-turn, respectively.
However, the computing times may be a problem using these models into online settings for real dynamic optimization because of the model complexity. To overcome the computing time difficulty, some simplified models was established to reduce the total number of variables. Zhong et al. narrowed the study scope from an intersection to an approach [12]. An optimization model was established to minimize the delay of an approach by dynamically changing the number of through and left-turn lanes at the approach. Zeng et al. [13] reduced the number of variables by fixing the signal control policy, which was proposed by Webster [14], in his integrative model. Then, a two-step optimization model for dynamic lane assignment is presented [5]. In the first step, an arm-group-based integer nonlinear program model was formulated for obtaining the best lane assignment scheme. In the second step, a suitable implementation scheme was identified between the optimization result and the status quo by determination of a binary-type threshold. To respond to the demand variation on time, the procedure runs on a cycle-by-cycle basis. This method reduces the number of variables and maintains the optimal results by segmenting the intersection into arm groups. The implementation of the dynamic lane assignment systems has also been years away. Three major applications have been developed to accommodate the demand imbalance in different peak periods, special events such as large sporting events, concerts, and festivals, and emergency conditions such as evacuation [15–17]. However, this requires the use of a signing technology to advise the motorist of the change in lane-use designation [18]. Several techniques could be used which include mechanical sign face movement, pixel addressable modules, and predefined display segments [19]. To designate the lane assignment at intersections in practice, the dynamic overhead lane-use sign was used [4]. However, the existing study has primarily focused on developing optimization methods. In these theoretical models mentioned above, it is assumed that the operational efficiency of the variable lane, such as the saturation flow rate, is the same as other normal lanes. As many other unconventional designs, like the median U-turn intersection, jug-handle, superstreet intersection, paired intersection, quadrant roadway, bowties, displaced left-turn intersection, tandem intersection, exit-lanes for leftturn intersection, and others [20–27], the drivers may be confused and violated the rules intentionally or unintentionally. The promising benefits in theoretical analysis would not be fully materialized. Therefore, to remedy this deficiency,
the operational characteristic of the variable lane should be carefully analyzed. The present paper aims to discuss the following critical operation issues: (1) is there a significant difference between the variable lanes and normal lanes on operational efficiency? and (2) what are the influence factors? The operational evaluation could be conducted by using field data or driving simulator. The former is a more direct way and could obtain the real operational condition [28– 32]. The latter is a cost-effective way in examining driver responses under different traffic conditions, signage, and other design factors without posing any risk to drivers [33– 40]. Considering that we have good survey conditions and the driving environment in the simulator generally differs from that in the real world, such as effect from other road users, marking degradation, and limited sight distance, the field data method was used in this research. The rest of this paper is organized as follows. In Section 2, the data collection for field observations is introduced. The findings for the saturation flow rate changes caused by the dynamic lane assignment are analyzed in Section 3. Section 4 discusses the potential efficiency issues and the improvement recommendations. Conclusions are given at the end of the paper.
2. Materials 2.1. Surveyed Intersections. To match the lane-use with the variation of traffic demand at signalized intersections, the dynamic lane assignment strategy has been applied in five intersections in Shanghai, China, as illustrated in Figure 1. The basic geometry information of the surveyed intersections is summarized in Table 1. The protected left-turn phase was used in all these intersections. For the condition that each approach has the same phase, the dynamic lane assignment is rarely used because the shared left-turn and through lane could be used to adjust the fluctuating of traffic flows between different movements, which will not be discussed in this paper. 2.2. Data Collection. The traffic data used in this study is obtained by video cameras. For each survey point, two cameras shot simultaneously; see Figure 2 for examples. One was mounted near the stop line to record the running characteristic of the vehicles at the approach, such as the saturation flow rate, the usage distribution of vehicles among approach lanes, and the violations. The other was mounted at
Journal of Advanced Transportation
3
Middle Ring Rd. Inner Ring Elevated Rd. Xizangbei Rd.Haining Rd.
Yanggaozhong Rd.Yunshan Rd. Yanggaonan Rd.Huamu Rd.
Caoxibei Rd.Lingling Rd. Tianyaoqiao Rd.Zhongshan Rd.
Surveyed intersections
Figure 1: Target intersections with dynamic lane assignment in Shanghai, China.
(a) Camera 1: near the stop line
(b) Camera 2: upstream of the intersection
Figure 2: Examples of the camera views of the surveyed intersections.
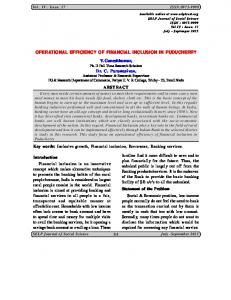
the upstream of the intersection to record the lane-changing and selection behavior, which can help to analyze the reason of the running characteristic of the vehicles at the approach. The video-based data collection was performed at 7:30–10:30 and 16:00–18:00 for two weekdays. With the video cameras, second-by-second vehicle arrivals and departures are readily captured for later analyses. To ensure that the data to be collected are at the sufficient level of accuracy and precision, a specially developed image processing software has been employed, which has been successfully used in the project of Highway Capacity Manual of Shanghai. The user interface was designed to sequentially measure the time that vehicles touch each virtual detection line. Therefore, the time-varying traffic data and operational performances such as volume, headway, and speed can be collected. 2.3. Data Grouping. In order to analyze the impact of the dynamic lane assignment on traffic operation, the approach lanes were divided into four groups, as illustrated in Figure 3: Group 1, the variable approach lane; group 2, the lane adjacent to the variable lane with the same lane-use; group 3, the lane adjacent to the variable lane with different lane-use of the
Group 2 Group 1 Group 3 Variable lane
Group 4
Figure 3: Data grouping diagram.
variable lane; and group 4, the lanes with the same lane-use as the variable lane at other approaches of the intersection. Then, group 4 can be used as a benchmark to analyze the operational characteristic of the variable lane (group 1). Moreover, the lanes adjacent to the variable lane may also be affected. Therefore, the data of the four groups was counted, respectively, and multiple comparisons were conducted to identify the operational differences among the four groups of lanes.
4
Journal of Advanced Transportation Table 2: Number of measured vehicles for the surveyed intersections.
No. 1 2 3 4 5 Sum
Intersection Caoxibei Rd.-Lingling Rd. Tianyaoqiao Rd.-Zhongshan Rd. Yanggaonan Rd.-Huamu Rd. Yanggaozhong Rd.-Yunshan Rd. Xizangbei Rd.-Haining Rd.
Group 1 2432 2379 2561 2520 2248 12140
Group 2 2856 2747 2886 2826 2676 13991
Group 3 2298 2772 2650 2664 2420 12804
Group 4 3354 6083 6430 3328 5358 24553
Table 3: Statistical description of the headway and nonparametric tests for several independent samples. Intersection
Group
Sample size Minimum (s) Maximum (s)
Mean (s)
Std. deviation
Kruskal-Wallis test 𝜒2 Sig. (p)
1
1 2 3 4
1483 1836 1382 2216
1.08 1.08 1.05 1.08
7.57 5.09 5.57 5.17
2.397 2.001 2.101 1.985
1.088 0.582 0.719 0.515
115.340
0.000
2
1 2 3 4
1403 1783 1763 3960
1.07 1.03 1.05 1.03
8.15 5.92 6.40 5.90
2.631 2.024 2.247 1.997
1.551 0.523 0.862 0.503
145.171
0.000
3
1 2 3 4
1512 1908 1676 4262
1.09 1.06 1.06 1.05
8.39 6.59 5.98 5.41
2.722 2.068 2.302 2.006
1.328 0.688 0.943 0.532
449.283
0.000
4
1 2 3 4
1494 1902 1675 2204
1.08 1.06 1.08 1.05
9.89 5.13 7.28 4.09
2.652 2.041 2.226 2.011
1.467 0.593 1.015 0.529
163.600
0.000
5
1 2 3 4
1180 1857 1476 3380
1.09 1.08 1.08 1.04
8.88 6.56 7.59 5.19
2.605 2.032 2.254 2.031
1.282 0.601 0.884 0.531
256.159
0.000
A total of 63488 samples have been collected at the five intersections for further analysis. The detailed number of measured vehicles of each group for each surveyed intersections is summarized in Table 2.
3. Operational Efficiency Analysis For operational efficiency analysis, the saturation flow rate is the key indicator for traffic lanes. In this section, we will first identify whether the differences of saturation flow rate among four groups of lanes were significant. Then, we will further analyze where the differences lay from three aspects, including the unequal distribution of traffic, the mandatory lane-changing, and the lane blockage. Please note that other conventional saturation flow rate factors will not be discussed in detail in this paper because they are not the additional effect caused by the dynamic lane assignment, although they may also affect the operational efficiency of the variable lane.
3.1. Saturation Flow Rate. Vehicles are recorded when their front axles cross the stop line. Then, the actual saturation flow rate could be measured accordingly. To remove the impact of the start-up lost time, the saturation flow is calculated only from the headways after the fourth vehicle in queue passes the stop line [41]. The distribution of headways for different groups at each intersection is shown in Figure 4. Results of statistical description and nonparametric test analysis (Kruskal-Wallis test) are shown in Table 3. From Figure 4 and Table 3, one could observe that the difference in headway under different groups was statistically significant (𝑝 < 0.01) at each intersection. Using group 4 as a benchmark, Table 4 further tests the significance of difference in headway between each pair of groups. A consistent result could be produced from the five surveyed intersections: the differences between group 1 and group 4 and between group 3 and group 4 are statistically significant, while there is no significant difference between
5
1 0.9 0.8 0.7 0.6 0.5 0.4 0.3 0.2 0.1 0
Cumulative frequency
Cumulative frequency
Journal of Advanced Transportation
1
1.8
2.6
3.4 4.2 Headway (s)
Group 1 Group 2
5
5.8
1 0.9 0.8 0.7 0.6 0.5 0.4 0.3 0.2 0.1 0
6.6
1
Group 3 Group 4
1.8
Cumulative frequency
Cumulative frequency 2.6
3.4 4.2 Headway (s)
5
5.8
1
6.6
1.8
6.6
Group 3 Group 4
2.6
3.4 4.2 Headway (s)
Group 1 Group 2
(c) Intersection 3
Cumulative frequency
5.8
1 0.9 0.8 0.7 0.6 0.5 0.4 0.3 0.2 0.1 0
Group 3 Group 4
Group 1 Group 2
5
(b) Intersection 2
1 0.9 0.8 0.7 0.6 0.5 0.4 0.3 0.2 0.1 0 1.8
3.4 4.2 Headway (s)
Group 1 Group 2
(a) Intersection 1
1
2.6
5
5.8
6.6
Group 3 Group 4
(d) Intersection 4
1 0.9 0.8 0.7 0.6 0.5 0.4 0.3 0.2 0.1 0 1
1.8
2.6
3.4 4.2 Headway (s)
Group 1 Group 2
5
5.8
6.6
Group 3 Group 4
(e) Intersection 5
Figure 4: Distribution of headways.
group 2 and group 4. It indicates that the setting of dynamic lane assignment affected the saturation flow rate of the variable lane itself and the adjacent lane with different laneuse. However, operational efficiency of the lane adjacent to the variable lane with the same lane-use was not affected
significantly. On average, the reduction of the saturation flow rate reaches 22.86% and 9.80% (see Table 4) for variable lane and the adjacent lane with different lane-use, respectively. Then, we will analyze the influencing factors as follows. To eliminate the interaction of factors, when studying an
6
Journal of Advanced Transportation Table 4: Multiple comparisons of the headway (Mann–Whitney test).
Intersection 1 2 3 4 5 Average
𝑠𝑔1 /𝑠𝑔4 0.828 0.759 0.736 0.758 0.780 0.771
Group 1-group 4 𝑍 value Sig. (p) −9.777 0.000 −10.654 0.000 −20.108 0.000 −11.801 0.000 −14.230 0.000 −31.329 0.000
𝑠𝑔2 /𝑠𝑔4 0.992 0.987 0.969 0.985 0.999 0.987
Group 2-group 4 𝑍 value Sig. (p) −0.011 0.991 −1.516 0.129 −0.988 0.323 −0.559 0.576 −1.534 0.125 −0.537 0.591
𝑠𝑔3 /𝑠𝑔4 0.944 0.889 0.871 0.903 0.901 0.902
Group 3-group 4 𝑍 value Sig. (p) −2.617 0.009 −7.422 0.000 −8.921 0.000 −3.179 0.001 −6.425 0.000 −15.296 0.000
Note: 𝑠𝑔1 , 𝑠𝑔2 , 𝑠𝑔3 , and 𝑠𝑔4 refer to the saturation flow rate of group 1, group 2, group 3, and group 4, respectively.
Table 5: Paired comparison of the traffic demand per cycle between the variable lane and the adjacent lane. Intersection 1 2 3 4 5
Sample size 360 190 190 190 170
Normal lane Mean Std. deviation
Variable lane Mean Std. deviation
7.933 14.458 15.168 14.874 15.741
7.519 13.121 14.079 13.863 13.823
2.376 2.816 2.411 2.674 3.204
2.255 2.692 3.099 3.381 2.977
Paired samples test 𝑡 Sig. (2-tailed) 7.441 14.145 8.309 7.264 12.947
0.000 0.000 0.000 0.000 0.000
Table 6: Adjustment of variable lane saturation flow rate for the unequal distribution of traffic. Intersection 1 2 3 4 5 Average
Sample size 360 190 190 190 170 1100
Minimum 0.40 0.50 0.38 0.36 0.46 0.36
effect, the other effects were excluded. For example, when studying the effect of unequal distribution, the data that neither mandatory lane-changing nor lane blockage occurs in the signal cycle was used. 3.2. Effect of Unequal Distribution of Traffic. In the intersections with the dynamic lane assignment, the variable lane cannot be the only lane for a movement; otherwise, the movement has to be prohibited when the lane-use of the variable lane changed. Therefore, there is at least one normal lane with the same lane-use as the variable lane in the approach (there is only one normal lane at each data collected location in this paper). The distribution of traffic demand among these lanes is recorded cycle by cycle in the investigation. The statistical results are shown in Figure 5. Paired 𝑡-test results (see Table 5) further show there is a significant difference of traffic demand between the variable lane and the adjacent lane with the same lane-use (the normal lane) at each surveyed intersection (𝑝 < 0.01). It indicates that the drivers prefer to choose the normal lane instead of the variable lane. The adjustment of variable lane saturation flow rate for the unequal distribution of traffic could be calculated by (1) [41]. Results show that,
Maximum 1.00 1.00 1.00 1.00 1.00 1.00
Mean 0.937 0.890 0.903 0.925 0.870 0.911
Std. deviation 0.133 0.107 0.157 0.146 0.116 0.134
on average, 8.9% reduction of the saturation flow rate will be caused by the demand starvation for the variable lane (see Table 6), which is larger than the recommended value for normal approach lanes in HCM2010 [41] (4.8% for exclusive through, 2.9% for exclusive left-turn), 𝑓V1 =
𝐷V , 𝐷max
(1)
where 𝑓V1 is the adjustment of variable lane saturation flow rate for the unequal distribution of traffic; 𝐷V is the demand flow rate on variable lane, veh/h; 𝐷max is the demand flow rate on single lane with highest volume in the lane group, veh/h. 3.3. Effect of Mandatory Lane-Changing. Due to the unfamiliarity of the running characteristic of the dynamic lane assignment, drivers may make a mistake during the lanechoosing process and enter a wrong approach lane. Then, some of these drivers attempt to make a mandatory lanechanging which brings negative effect on the operational efficiency. The effect of the mandatory lane-changing can be divided into two cases, as illustrated in Figure 6. For case 1, the mandatory lane-changing occurs during the green time of
Journal of Advanced Transportation
7
80
60
Frequency
Frequency
60
40
40
20
20
0
0 0
3 6 9 12 Traffic demand in a cycle (veh)
15
5
Normal lane Variable lane
10 15 Traffic demand in a cycle (veh) Normal lane Variable lane
(a) Intersection 1
(b) Intersection 2
60
60
40
40
Frequency
Frequency
20
20
0
20
0 5
10 15 Traffic demand in a cycle (veh)
5
20
Normal lane Variable lane
10 15 20 Traffic demand in a cycle (veh)
25
Normal lane Variable lane
(c) Intersection 3
(d) Intersection 4
40
Frequency
30
20
10
0 5
10 15 20 Traffic demand in a cycle (veh)
25
Normal lane Variable lane (e) Intersection 5
Figure 5: Distribution of traffic demand.
the adjacent lane with different lane-use (the target lane of the lane-changing movement); see Figure 6(a). Then the smooth driving of vehicles on the adjacent lane is affected and maybe interrupted in the process of the slow-going of the mandatory lane-changing. For case 2, the mandatory lane-changing
occurs during the green time of the variable lane; see Figure 6(b). Then, the following vehicles have to make a detour and the operational efficiency may decrease accordingly. The impact of the mandatory lane-changing on saturation flow rate is determined by the possibility of the event
8
Journal of Advanced Transportation Mandatory lane-changing vehicle
Mandatory lane-changing vehicle
Variable lane
Variable lane
(a) Case 1: during the green time of the adjacent lane
(b) Case 2: during the green time of the variable lane
Figure 6: Mandatory lane-changing. Table 7: Number of the mandatory lane-changing vehicles. Case 1
Total
Intersection
Case 2
Paired samples 𝑡-test (case 1-case 2) 𝑡 Sig. (2-tailed)
Number
Percentage
Number
Percentage
Number
Percentage
1 2 3 4 5
575 521 593 543 466
19.12% 17.97% 18.80% 17.73% 17.17%
272 249 312 288 241
9.05% 8.59% 9.89% 9.40% 8.88%
303 272 281 255 225
10.08% 9.38% 8.91% 8.33% 8.29%
0.384
0.720
Average
2698
18.18%
1362
9.18%
1336
9.00%
—
—
occurring and its effects. The number of the mandatory lanechanging vehicles under the two cases is shown in Table 7. On average, 18.18 percent of vehicles in the variable lane drive to the adjacent approach lane with different lane-use mandatorily. Moreover, according to the paired samples test, there is no significant difference on the occurring possibility between the two cases (see Table 7, 𝑡 = 0.384, 𝑝 > 0.05). Therefore, the possibility of the mandatory lane-changing equals 9.0% for both case 1 and case 2. The percentages of saturation flow rate drops under different number of mandatory lane-changings on the variable lane are recorded cycle by cycle at each surveyed intersection, as illustrated in Figure 7. There is a significant drop when the mandatory lane-changing occurs. Furthermore, according to the regression analysis (see Table 8 and Figure 8), all the four kinds of equations, including linear, logarithmic, power, and logistic kind, are significant under the 𝐹-test (𝑝 < 0.01). The logarithmic equation has the highest degree of fitting. Therefore, it could be used to describe the relationships between the saturation flow rate drops and the number of lane-changings, as shown in 𝛿1 = 6.884 ln (𝑚) + 11.787, 𝛿2 = 6.317 ln (𝑚) + 15.016,
(2)
where 𝛿1 and 𝛿2 are the percentage of saturation flow rate drops under case 1 and case 2; 𝑚 is the number of the mandatory lane-changings. Then the adjustment of variable lane saturation flow rate for the unequal distribution of traffic could be calculated by (3). The calculation results are shown in Table 9. It indicates that, on average, 8.9% reduction of the saturation flow rate on
the adjacent lane with different lane-use and 10.7% reduction of the saturation flow rate on the variable lane are caused by mandatory lane-changing, 𝑞
𝑞! 𝑞−𝑚 𝛿1 , 𝜌1𝑚 (1 − 𝜌1 ) 𝑚=1 𝑚! (𝑞 − 𝑚)!
1 =1− ∑ 𝑓V2 𝑞
𝑞! 𝑞−𝑚 2 𝑓V2 =1− ∑ 𝛿2 , 𝜌2𝑚 (1 − 𝜌2 ) 𝑚=1 𝑚! (𝑞 − 𝑚)!
(3)
1 2 where 𝑓V2 and 𝑓V2 are the adjustment for mandatory lanechanging under case 1 and case 2, respectively (for the adjacent lane and the variable lane with different lane-use, resp.); 𝑞 is the demand flow rate on variable lane in a signal cycle, veh/cycle; 𝜌1 and 𝜌2 are the possibility of the mandatory lane-changing under case 1 and case 2, respectively; 𝜌1 = 𝜌2 = 9.0%.
3.4. Effect of Lane Blockage. Besides the mandatory lanechanging, some other vehicles that enter the wrong approach lane stopped just at the stop line (maybe intentionally and maybe not) and wait for the green signal of their direction. The variable lane was blocked and the rest of the green time was wasted if this occurred, which caused great negative effect on the operational efficiency of the variable lane. The possibility of the lane blockage and the percentages of saturation flow rate drops at the surveyed intersections are shown in Tables 10 and 11, respectively. Statistical analysis results show that the possibility of the lane blockage obeys the normality distribution, and the mean value equals 0.80% (see Table 10). Although the possibility of the lane blockage is quiet small, its negative effect on saturation flow rate is significant.
25.00
9 Percentages of saturation flow rate drops (%)
Percentages of saturation flow rate drops (%)
Journal of Advanced Transportation
33 327
20.00 436 770 695
15.00
10.00 651 437 721
5.00
30.00 25.00 429
20.00
688
763 52
15.00 10.00
644 430 714
5.00
1.00 2.00 3.00 4.00 5.00 Number of mandatory lane-changings on the variable lane
1.00 2.00 3.00 4.00 5.00 Number of mandatory lane-changings on the variable lane
(a) Mandatory lane-changing case 1
(b) Mandatory lane-changing case 2
25.00
20.00
15.00
10.00
5.00 1.00 2.00 3.00 4.00 5.00 Number of mandatory lane-changings on the variable lane
Percentages of saturation flow rate drops (%)
Percentages of saturation flow rate drops (%)
Figure 7: Percentages of saturation flow rate drops under different number of mandatory lane-changings. 30.00 25.00 20.00 15.00 10.00 5.00 1.00 2.00 3.00 4.00 5.00 Number of mandatory lane-changings on the variable lane
Power Logistic
Observed Linear Logarithmic
Observed Linear Logarithmic
(a) Mandatory lane-changing case 1
Power Logistic
(b) Mandatory lane-changing case 2
Figure 8: Regression analysis of four kinds of equations. Table 8: Regression analysis results. Equation Linear Logarithmic Power Logistic
𝑅2 0.676 0.729 0.667 0.605
𝐹 1785.468 2299.194 1717.869 1309.876
Case 1 Sig. 0.000 0.000 0.000 0.000
Constant 8.543 11.878 11.741 0.106
On average, the saturation flow rate drops 54% when the lane blockage occurs (see Table 11). Then, combining the above two factors, the adjustment of variable lane saturation flow rate for the lane blockage could be calculated by (4). The calculation results show (see Table 12) that, on average, 4.90% reduction of the saturation flow rate on the variable lane is caused by the lane blockage, 𝑞
𝑓V3 = 1 − (1 − (1 − 𝛽) ) 𝜂,
(4)
𝑏1 3.644 6.884 0.471 0.782
𝑅2 0.662 0.701 0.655 0.606
𝐹 1649.227 1974.785 1597.606 1294.001
Case 2 Sig. 0.000 0.000 0.000 0.000
Constant 11.875 15.016 14.918 0.080
𝑏1 3.399 6.317 0.358 0.826
where 𝑓V3 is the adjustment of variable lane saturation flow rate for the lane blockage; 𝛽 is the possibility of the lane blockage; 𝑞 is the demand flow rate on variable lane in a signal cycle, veh/cycle; 𝜂 is the percentage of saturation flow rate drops caused by the lane blockage. 3.5. Adjustment for Dynamic Lane Assignment. Considering the above three factors, the adjustment for dynamic lane assignment of the variable lane and the adjacent lane with
10
Journal of Advanced Transportation Table 9: Adjustment of lane saturation flow rate for the mandatory lane-changing.
Intersection
𝑞 (veh/cycle)
1 2 3 4 5
Adjustment of the adjacent lane (case 1) 1 𝜌1 (%) 𝛿1 (%) 𝑓V2
Adjustment of the variable lane (case 2) 2 𝜌2 (%) 𝛿2 (%) 𝑓V2
0.948 0.907 0.901 0.899 0.899
0.935 0.888 0.882 0.879 0.879
6.756 12.521 13.479 13.263 13.224
9.0
6.884 ln (𝑚) + 11.787
Average
6.317 ln (𝑚) + 15.016
9.0
0.911
0.893
Table 10: Number of vehicles causing lane blockage. Intersection 1 2 3 4 5
Number
Percentage
23 18 19 18 20
0.937% 0.751% 0.736% 0.709% 0.882%
Normality test (Kolmogorov-Smirnov test) 𝑍 Sig. (2-tailed)
Normal parameters Mean
Std. deviation
0.80%
0.001
0.668
0.764
Table 11: Percentages of saturation flow rate drops when the lane blockage occurs. Intersection 1 2 3 4 5 Average
Sample size 23 18 19 18 20 98
Minimum 39.51% 41.21% 41.14% 48.32% 38.80% 38.80%
Maximum 65.55% 76.08% 76.01% 67.93% 60.01% 76.08%
Mean 53.69% 53.00% 57.17% 57.90% 49.55% 54.17%
Std. deviation 0.073 0.082 0.080 0.058 0.055 0.075
Table 12: Adjustment of lane saturation flow rate for the lane blockage. 𝑞 (veh/cycle) 6.756 12.521 13.479 13.263 13.224
Intersection 1 2 3 4 5 Average
different lane-use could be determined by (5) and (6), respectively, 2 𝑓V3 , 𝑓𝑑V = 𝑓V1 𝑓V2
(5)
1 𝑓𝑑𝑎 = 𝑓V2 ,
(6)
where 𝑓𝑑V is the adjustment for dynamic lane assignment of the variable lane; 𝑓𝑑𝑎 is the adjustment for dynamic lane assignment of the adjacent lane with different lane-use; the 1 2 recommend values for 𝑓V1 , 𝑓V2 , 𝑓V2 , and 𝑓V3 are 0.911, 0.911, 0.893, and 0.951, respectively, according to the analysis results mentioned above.
𝛽
𝜂
0.80%
54%
𝑓V3 0.971 0.948 0.945 0.945 0.946 0.951
Comparison of results between the developed dynamic lane assignment adjustment model and the field survey is summarized in Table 13. The mean error is 2.15%. Paired 𝑡test results (see Table 14) further show there is no significant difference (𝑝 value = 0.826 > 0.05 and 𝑝 value = 0.228 > 0.05 for the variable lane and the adjacent lane with different lane-use, resp.), indicating that the accuracy of the proposed adjustment model is acceptable.
4. Discussion The dynamic lane assignment at signalized intersections was proposed to match traffic demands and to fully utilize the
Journal of Advanced Transportation
11
Table 13: Comparison of results between the proposed model and field survey. Intersection 1 2 3 4 5 1 2 3 4 5
Lane
Group 1
Group 3
𝑓V1 0.937 0.890 0.903 0.925 0.870 — — — — —
Proposed adjustment model 1 2 𝑓V2 𝑓V2 𝑓V3 𝑓𝑑V — 0.935 0.971 0.851 — 0.888 0.948 0.749 — 0.882 0.945 0.753 — 0.879 0.945 0.768 — 0.879 0.946 0.723 0.948 — — — 0.907 — — — 0.901 — — — 0.899 — — — 0.899 — — —
𝑓𝑑𝑎 — — — — — 0.948 0.907 0.901 0.899 0.899
Field survey
Percentage of difference
0.828 0.759 0.736 0.758 0.780 0.944 0.889 0.871 0.903 0.901
2.74% −1.29% 2.26% 1.37% −7.25% 0.42% 2.02% 3.44% −0.44% −0.22%
Note: group 1 and 3 are the variable lane and the adjacent lane with different lane-use (see Figure 3).
Table 14: Paired 𝑡-test results.
Lane
Mean
Group 1 Group 3
0.003 −0.009
Paired differences 95% confidence interval of Std. error Std. deviation the difference mean Lower Upper 0.032 0.014
0.015 0.006
−0.037 −0.027
0.044 0.009
𝑡
df
Sig. (2-tailed)
0.234 −1.422
4 4
0.826 0.228
Note: group 1 and 3 are the variable lane and the adjacent lane with different lane-use (see Figure 3).
existing traffic facilities [4, 13]. It could smartly choose the occasion to change the lane assignment and improve the traffic operational efficiency of the overall intersection when the traffic demand varies significantly. However, according to the statistical analysis based on the field data, the using of the dynamic lane assignment decreases the saturation flow rate of the variable lane (group 1) and the adjacent lane with different lane-use (group 3). For the variable lane, the potential operational efficiency problem lies in three aspects: the unequal distribution of traffic, the mandatory lane-changing, and the lane blockage. Among the three aspects, the mandatory lane-changing plays the most important role (10.7% reduction). It is due to the fact that most of the unfamiliar drivers, who enter the wrong approach lane, make a mandatory lane-changing. Other drivers who enter the wrong approach lane stopped just at the stop line and wait for the green signal of their direction. Then, the variable lane was blocked. Although quite few drivers will do this (0.80%), the saturation flow rate will be significantly affected (54% reduction) when this phenomenon occurred. On average, the lane blockage causes 4.90% reduction on the saturation flow rate. For the adjacent lane with different lane-use, the mandatory lane-changing on the variable lane is the main factor of the reduction of the saturation flow rate. The smooth driving of vehicles on the adjacent lane is significantly affected and interrupted in the process of the slow-going of the mandatory lane-changing. On average, it causes 8.90% reduction on the saturation flow rate. Most of the reduction on the saturation flow rate is caused by the unfamiliarity of the drivers to the dynamic
lane assignment as well as the wrong way to deal with the mistake. Therefore, in practice, more guiding information (more dynamic overhead lane signals) should be provided to the drivers to make them notice the special lane assignment at the oncoming approach. The possibility of the wrong approach-lane-choosing could be reduced. Moreover, strong law enforcement, such as camera investigating and punishing, needs to be deployed to reduce the number of mandatory lane-changings and lane blockage. If a driver chooses a wrong approach lane and goes into the no-passing zone of the approach, he/she should go through the intersection with the current stream instead of changing lane mandatorily or blocking the traffic lane.
5. Conclusion Through the operational efficiency evaluation of the intersections with dynamic lane assignment based on the field measurement in five intersections in China, the following conclusions are drawn. (1) The using of the dynamic lane assignment decreases the saturation flow rate of the variable lane and the adjacent lane with different lane-use, although the dynamic lane assignment at signalized intersections helps to match traffic demands and improve the traffic operational efficiency of the overall intersection. (2) On average, the reduction of the saturation flow rate reaches 22.86% and 9.80% (see Table 5) for the variable lane and the adjacent lane with different lane-use, respectively. For the variable lane, the reduction of
12
Journal of Advanced Transportation the saturation flow rate comes from three aspects: the unequal distribution of traffic (8.9%), the mandatory lane-changing (10.7%), and the lane blockage (4.9%). For the adjacent lane with different lane-use, the reduction of the saturation flow rate is mainly caused by the mandatory lane-changing of the vehicles on the variable lane. (3) A saturation flow rate adjustment model for the dynamic lane assignment is established. The accuracy of the model is validated by comparing the results between the proposed model and the field survey. The mean difference is 2.15%.
In practice, more guiding information (e.g., multigroup overhead lane signals) and strong law enforcement (e.g., camera investigating and punishing) are recommend to improve the operational efficiency of the variable lane. Moreover, the lane-use should not be changed too frequently. From the optimization design aspect, the reduction and variability of the saturation flow rate caused by the variable lane should be considered that is the direction of our future study.
Competing Interests The authors declare that they have no competing interests.
Acknowledgments The research is supported by the National Natural Science Foundation of China under Grant no. 51608324.
References [1] Y. Yin, “Robust optimal traffic signal timing,” Transportation Research Part B: Methodological, vol. 42, no. 10, pp. 911–924, 2008. [2] W. L. Gisler, N. J. Rowan, and M. A. Ogden, “Dynamic lane assignment using fiber-optic signs,” Transportation Research Record, pp. 10–17, 1992. [3] D. Bullock, “Implementation vision for distributed control of traffic signal subsystems,” Transportation Research Record, vol. 1554, pp. 43–47, 1996. [4] B. Wolson and L. Lambert, Convertible Roadways and Lanes, Transportation Research Board, Washington, DC, USA, 2004. [5] J. Zhao, W. Ma, H. M. Zhang, and X. Yang, “Two-step optimization model for dynamic lane assignment at isolated signalized intersections,” Transportation Research Record, vol. 2355, pp. 39–48, 2013. [6] W. H. K. Lam, A. C. K. Poon, and G. K. S. Mung, “Integrated model for lane-use and signal-phase designs,” Journal of Transportation Engineering, vol. 123, no. 2, pp. 114–121, 1997. [7] C. K. Wong and S. C. Wong, “Lane-based optimization of signal timings for isolated junctions,” Transportation Research Part B: Methodological, vol. 37, no. 1, pp. 63–84, 2003. [8] C. K. Wong and S. C. Wong, “A lane-based optimization method for minimizing delay at isolated signal-controlled junctions,” Journal of Mathematical Modelling and Algorithms, vol. 2, no. 4, pp. 379–406, 2003.
[9] C. K. Wong and B. G. Heydecker, “Optimal allocation of turns to lanes at an isolated signal-controlled junction,” Transportation Research Part B: Methodological, vol. 45, no. 4, pp. 667–681, 2011. [10] C. Wong, S. Wong, and C. Tong, “Optimization methods for off-line traffic signal settings: recent advances and prospective future research,” Journal of Transportation Systems Engineering and Information Technology, vol. 5, no. 2, pp. 36–54, 2005. [11] C. K. Wong, S. C. Wong, and C. O. Tong, “A lane-based optimization method for the multi-period analysis of isolated signal-controlled junctions,” Transportmetrica, vol. 2, no. 1, pp. 53–85, 2006. [12] Z. Zhong, H. Liu, W. Ma, and K. Long, “An optimization method of dynamic lane assignment at signalized intersection,” in Proceedings of the International Conference on Intelligent Computation Technology and Automation (ICICTA ’08), vol. 2, pp. 1277–1280, October 2008. [13] Y. Zeng, Y. Ma, and X. Yang, “Dynamic lane-use management at isolated intersections with demand responsive signal control,” in Proceedings of the 12th World Conference on Transport Research, Lisbon, Portugal, 2010. [14] F. V. Webster, Traffic Signal Settings, H.M.S.O, London, UK, 1958. [15] K. R. Agent and J. D. Clark, Evaluation of Reversible Lanes (Nicholasville Road; Lexington, Kentucky), Kentucky Department of Transportation, Frankfort, Kentucky, 1980. [16] C. Krause, N. Kronpraset, J. Bared, and W. Zhang, “Operational advantages of dynamic reversible left-lane control of existing signalized diamond interchanges,” Journal of Transportation Engineering, vol. 141, no. 5, 2015. [17] B. Wolshon and L. Lambert II, “Planning and operational practices for reversible roadways,” ITE Journal-Institute of Transportation Engineers, vol. 76, no. 8, pp. 38–43, 2006. [18] R. K. Jella, S. R. Sunkari, W. L. Gisler, N. J. Rowan, and C. J. Messer, Space Management: An Application of Dynamic Lane Assignment, Texas Transportation Institute, Arlington, Tex, USA, 1993. [19] A. Harvey and D. Bullock, “Implementation of a distributed control system for dynamic lane assignment,” in Proceedings of the IEEE Southeastern Symposium on System Theory (SSST ’96), pp. 524–528, April 1996. [20] M. El Esawey and T. Sayed, “Analysis of unconventional arterial intersection designs (UAIDs): state-of-the-art methodologies and future research directions,” Transportmetrica A: Transport Science, vol. 9, no. 10, pp. 860–895, 2013. [21] J. E. Hummer, “Unconventional left-turn alternatives for urban and suburban arterials—part one,” ITE Journal (Institute of Transportation Engineers), vol. 68, no. 9, pp. 26–29, 1998. [22] J. E. Hummer, “Unconventional left-turn alternatives for urban and suburban arterials-part two,” ITE Journal, vol. 68, no. 11, pp. 101–106, 1998. [23] W. Ma, H. Xie, Y. Liu, L. Head, and Z. Luo, “Coordinated optimization of signal timings for intersection approach with presignals,” Transportation Research Record, no. 2355, pp. 93– 104, 2013. [24] Y. Xuan, C. F. Daganzo, and M. J. Cassidy, “Increasing the capacity of signalized intersections with separate left turn phases,” Transportation Research Part B: Methodological, vol. 45, no. 5, pp. 769–781, 2011. [25] C. Yan, H. Jiang, and S. Xie, “Capacity optimization of an isolated intersection under the phase swap sorting strategy,” Transportation Research Part B: Methodological, vol. 60, pp. 85– 106, 2014.
Journal of Advanced Transportation [26] J. Zhao, W. Ma, H. M. Zhang, and X. Yang, “Increasing the capacity of signalized intersections with dynamic use of exit lanes for left-turn traffic,” Transportation Research Record, no. 2355, pp. 49–59, 2013. [27] J. Zhao, W. Ma, K. L. Head, and X. Yang, “Optimal operation of displaced left-turn intersections: a lane-based approach,” Transportation Research Part C: Emerging Technologies, vol. 61, pp. 29–48, 2015. [28] M. M. Ahmed and M. Abdel-Aty, “Evaluation and spatial analysis of automated red-light running enforcement cameras,” Transportation Research Part C: Emerging Technologies, vol. 50, pp. 130–140, 2015. [29] S. Ilgin Guler and M. Menendez, “Analytical formulation and empirical evaluation of pre-signals for bus priority,” Transportation Research Part B: Methodological, vol. 64, pp. 41–53, 2014. [30] J. M. Hutton, K. M. Bauer, C. A. Fees, and A. Smiley, “Evaluation of left-turn lane offset using the naturalistic driving study data,” Journal of Safety Research, vol. 54, pp. 5–15, 2015. [31] A. F. Llau, N. U. Ahmed, H. M. R. U. Khan, F. G. Cevallos, and V. Pekovic, “The impact of red light cameras on crashes within miami-dade County, Florida,” Traffic Injury Prevention, vol. 16, no. 8, pp. 773–780, 2015. [32] Y. Ni and K. Li, “Estimating rear-end accident probabilities at signalized intersections: a comparison study of intersections with and without green signal countdown devices,” Traffic Injury Prevention, vol. 15, no. 6, pp. 583–590, 2014. [33] C. Gelau, J. Sirek, and K. Dahmen-Zimmer, “Effects of time pressure on left-turn decisions of elderly drivers in a fixedbase driving simulator,” Transportation Research Part F: Traffic Psychology and Behaviour, vol. 14, no. 1, pp. 76–86, 2011. [34] V. W. Inman, “Evaluation of signs and markings for partial continuous flow intersection,” Transportation Research Record, vol. 2138, no. 1, pp. 66–74, 2009. [35] M. A. Knodler Jr., D. A. Noyce, K. C. Kacir, and C. L. Brehmer, “Potential application of flashing yellow arrow permissive indication in separated left-turn lanes,” Transportation Research Record, vol. 1973, no. 1, pp. 10–17, 2006. [36] H. C. Lee, D. Cameron, and A. H. Lee, “Assessing the driving performance of older adult drivers: on-road versus simulated driving,” Accident Analysis and Prevention, vol. 35, no. 5, pp. 797–803, 2003. [37] A. Montella, M. Aria, A. D’Ambrosio, F. Galante, F. Mauriello, and M. Pernetti, “Simulator evaluation of drivers’ speed, deceleration and lateral position at rural intersections in relation to different perceptual cues,” Accident Analysis & Prevention, vol. 43, no. 6, pp. 2072–2084, 2011. [38] O. Shechtman, S. Classen, K. Awadzi, and W. Mann, “Comparison of driving errors between on-the-road and simulated driving assessment: a validation study,” Traffic Injury Prevention, vol. 10, no. 4, pp. 379–385, 2009. [39] X. Yan, M. Abdel-Aty, E. Radwan, X. Wang, and P. Chilakapati, “Validating a driving simulator using surrogate safety measures,” Accident Analysis and Prevention, vol. 40, no. 1, pp. 274– 288, 2008. [40] J. Zhao, M. Yun, H. M. Zhang, and X. Yang, “Driving simulator evaluation of drivers’ response to intersections with dynamic use of exit-lanes for left-turn,” Accident Analysis and Prevention, vol. 81, pp. 107–119, 2015. [41] TRB, Highway Capacity Manual 2010, Transportation Research Board, Washington, DC, USA, 2010.
13
International Journal of
Rotating Machinery
Engineering Journal of
Hindawi Publishing Corporation http://www.hindawi.com
Volume 2014
The Scientific World Journal Hindawi Publishing Corporation http://www.hindawi.com
Volume 2014
International Journal of
Distributed Sensor Networks
Journal of
Sensors Hindawi Publishing Corporation http://www.hindawi.com
Volume 2014
Hindawi Publishing Corporation http://www.hindawi.com
Volume 2014
Hindawi Publishing Corporation http://www.hindawi.com
Volume 2014
Journal of
Control Science and Engineering
Advances in
Civil Engineering Hindawi Publishing Corporation http://www.hindawi.com
Hindawi Publishing Corporation http://www.hindawi.com
Volume 2014
Volume 2014
Submit your manuscripts at https://www.hindawi.com Journal of
Journal of
Electrical and Computer Engineering
Robotics Hindawi Publishing Corporation http://www.hindawi.com
Hindawi Publishing Corporation http://www.hindawi.com
Volume 2014
Volume 2014
VLSI Design Advances in OptoElectronics
International Journal of
Navigation and Observation Hindawi Publishing Corporation http://www.hindawi.com
Volume 2014
Hindawi Publishing Corporation http://www.hindawi.com
Hindawi Publishing Corporation http://www.hindawi.com
Chemical Engineering Hindawi Publishing Corporation http://www.hindawi.com
Volume 2014
Volume 2014
Active and Passive Electronic Components
Antennas and Propagation Hindawi Publishing Corporation http://www.hindawi.com
Aerospace Engineering
Hindawi Publishing Corporation http://www.hindawi.com
Volume 2014
Hindawi Publishing Corporation http://www.hindawi.com
Volume 2014
Volume 2014
International Journal of
International Journal of
International Journal of
Modelling & Simulation in Engineering
Volume 2014
Hindawi Publishing Corporation http://www.hindawi.com
Volume 2014
Shock and Vibration Hindawi Publishing Corporation http://www.hindawi.com
Volume 2014
Advances in
Acoustics and Vibration Hindawi Publishing Corporation http://www.hindawi.com
Volume 2014