6th EARSeL Workshop on Remote Sensing of the Coastal Zone 7–8 June 2013, Matera, Italy
1
OPERATIONAL MODELING FOR RIP CURRENTS PREDICTION Christophe Brière1, Jamie Lescinski2, Leo Sembiring 3, Ap Van Dongeren 4 and Maarten Van Ormondt5 1. 2. 3. 4. 5.
Deltares, Delft, The Netherlands; E-mail:
[email protected] Deltares, Delft, The Netherlands; E-mail:
[email protected] UNESCO-IHE, Delft, Netherlands; E-mail:
[email protected] Deltares, Delft, The Netherlands; E-mail:
[email protected] Deltares, Delft, The Netherlands; E-mail:
[email protected]
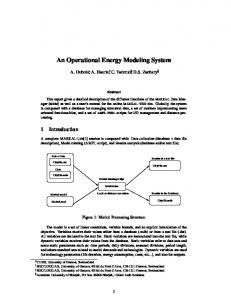
ABSTRACT On many beaches all over the world, rip currents are known as a serious hazard to beach users. These seaward-directed currents typically pull swimmers offshore. Improving insight into the near shore hydrodynamics may provide useful information to assess where and when dangerous conditions could be expected. This paper discusses the development and application of a real-time hydrodynamic model in combination with an advanced data-model integration method to derive the last, best-known near shore bathymetry. The operational model system includes coupled depth-averaged flow-wave models, nested to cover the entire North Sea with high resolution near the coast, and forced by wave conditions predicted by the global Wavewatch III model, astronomical tidal components, and wind and pressure fields. The reliability of the predicted hydrodynamics depends strongly on the imposed initial bathymetry. For that reason, the paper will especially focus on the provision of an up-to-date bathymetry by the recently-developed tool called Beach Wizard. With this data-model assimilation method the near shore sub-tidal bathymetry can be accurately estimated based on video-derived observations of wave roller dissipation, and variation of the intertidal shoreline, and of wave celerity. The depth-related properties are derived from sea-surface information obtained using the Argus optical remote sensing technique developed for sampling the near shore environment. The data-model assimilation method is currently used for the daily update of the near shore bathymetry at Egmond, The Netherlands, to be used by the operational model system in order to provide warnings to lifesavers and swimmers via a website. INTRODUCTION On many of the world’s beaches, rip currents (narrow, offshore-directed flows) pose a serious drowning hazard to beach users. The cause of rip currents is the alongshore non-uniformity in either the wave field or the bottom topography (1). Dalrymple et al, (2) have identified morphologically-controlled rip currents as the most common form. In this case rip currents are generated as follow: as waves approach shallower water, the waves break and exert a force on the water column through so-called radiation stress gradients (3). The momentum balance equation requires compensation by an opposing force which is a positive water level gradient (set up). Thus, intense wave breaking over a sand bar results in large radiation stress gradients which in turn generate a high set up at the coast line. Vice versa areas with less wave breaking, i.e. in an interruption in the bar, causes a lower set up at the coastline. This causes alongshore variations in set up which drive shore parallel flows, known as feeder currents. The feeder currents converge onshore of the rip channel into an offshore flow, the so-called rip neck. The location of morphologically controlled rip currents is thus tied to a rip channel that interrupts the adjacent sand bar. Outside the surf zone the rip current diffuses in the rip head, see Figure 1 for a schematic representation.
6th EARSeL Workshop on Remote Sensing of the Coastal Zone 7–8 June 2013, Matera, Italy
2
Rip current flow is dependent on wave-induced set up and thus on wave conditions and wave dissipation. Waves will break over the bar if the ratio of wave height to water depth exceeds a certain value. This implies that rip currents are not only dependent on wave height but also on water level that might be modified by the tide. The strongest rip velocities have been observed at low tide (4, 5, 6) while during high tide, more waves propagate over the bar without breaking and the rip current is weaker or completely inactive. For the Dutch coast, Winter et al. (7) have confirmed this mechanism of rip current occurrence as a function of water level.
Figure 1: Rip current schematic For the purpose of swimmer safety on recreational beaches, it is important to not only understand rip current dynamics but also to be able to forecast rip current conditions in terms of location, duration and strength. In this paper we will discuss the development and application of a real-time physics-based hydrodynamic model in combination with an advanced data-model integration method to derive the last, best-known near shore bathymetry. In section 2, the real-time hydrodynamic model system is described. In section 3, we describe the bathymetry estimation from video data. In Section 4, we present the Argus remote-sensing technique used to generate the sources for the data-model integration method. In Section 5 we discuss the implementation at the meso-tidal, wind-sea dominated site at Egmond Beach (The Netherlands) into a real-time warning system for rip currents. HYDRODYNAMIC FORCING SYSTEM COSMOS. COSMOS (Coastal Storm Modelling System) is an operational model system to simulate storm impact on coasts, but which is now applied to daily conditions as well. The system consists of a train of coupled models. This tailored model train is triggered by a task manager, which controls the data collection, pre-processing, model engines, post-processing and publication of the results on e.g. a web server. (8). Van der Werf et al. (9) and Van Ormondt et al. (10) provide details on the ongoing development of the system. Figure 2 depicts the workflow of the COSMOS system. This loop is executed every 6 or 12 hours when making operational forecasts. The main loop reads meta information (in xml format) of each model, and determines the start and stop times, taking into account the required spin-up times for the different models. Next, it downloads the required meteorological data from OPeNDAP servers, as well as real-time observations from the buoys and tide stations and stores these in a central database. The real-time data is only used to generate figures for model-data comparisons.
6th EARSeL Workshop on Remote Sensing of the Coastal Zone 7–8 June 2013, Matera, Italy
3
Figure 2: COSMOS workflow. For the application in the Netherlands, the model system contains four main numerical model components; see Figure 3 for a schematic of the model linkage and Figure 4 for the geographic extent of the models: a global WaveWatchIII (NWW) wave model, driven by GFS winds. a Delft3D/SWAN surge and wave Dutch Continental Shelf Model (DCSM) forced by Hirlam winds and Topex Poseidon tides, a Delft3D/SWAN Dutch Coastal Model, and local XBeach (transect or area) and/or local Delft3D area models.
Figure 3: model linkage.
Figure 4: left: Continental Shelf Model; middle: Dutch Coastal model; right: Egmond aan Zee model. Background image courtesy of Google Maps.
6th EARSeL Workshop on Remote Sensing of the Coastal Zone 7–8 June 2013, Matera, Italy
4
The nested models have a decreasing spatial domain but an increasing spatial resolution. Except for the WaveWatchIII model which covers the entire globe, all models are nested into the previous, larger domain model. This means that the required model boundary conditions are derived from the larger domain model. WaveWatch III (11) solves the action density balance equation. The domain of the WaveWatch III model is the entire globe. The grid resolution is 1 x 1.25 degree (latitude, longitude), which corresponds to approximately 100 x 100 km. The Continental Shelf Model (CSM), Figure 4 (left) is a model that covers the entire North Sea area. It contains a fully coupled wave model (SWAN) and a depth-averaged, two-dimensional-horizontal (2DH) flow model (Delft3D), accounting for wavecurrent interaction. The wave and flow model domain are the same but the resolution of the computational grids is different. The grid resolution of the wave model is approximately 15 x 20 and of the flow model 7.5 x 10 km. The wave model boundary conditions (swell) are taken from the WaveWatch3 model. At the flow model boundaries water levels are imposed (amplitudes and phases of relevant astronomic tidal constituents). By using this type of boundary conditions, the model can be used to simulate easily any time period. The domain of the Dutch Coastal Model (DCM), Figure 3 (middle) covers the entire coastline of The Netherlands. Similar to the CSM model, it contains a fully coupled 2DH Delft3D (flow) – SWAN (wave) model. Unlike the CSM model, the computational grids of the wave and flow model are the same. The grid resolution varies between 3.5 x 3.0 km (offshore) and 0.3 x 3.0 km (near the coast). The water levels at the sea boundaries of the Delft3D flow model and the 2D wave spectra at the boundaries of the SWAN model are taken from the CSM model. The last chain of the operational modelling system is a series of 30 XBeach (12) transect (1D) models along the Holland Coast. For the purpose of rip current forecasts a 2D area model at Egmond Beach is set up, see Figure 3 (right). The performance of the hydrodynamical model at deeper water has been demonstrated (13). The model performance at shallower water and especially in the surf zone and nearshore is highly dependent on the accuracy of the bathymetry estimate. This estimate can be obtained from in situ measurements but as these measurements become outdated quickly due to morphological change, a frequent repetition of surveys would be prohibitively expensive. An alternative is to derive estimates of the bathymetry from remote-sensing as is shown in the following section. NEARSHORE BATHYMETRY ESTIMATION SYSTEM The model bathymetry of the local area models is estimated using the Beach Wizard (14) technique. This is a data-model assimilation method with which intertidal and nearshore subtidal bathymetry can be computed based on a data-model integration scheme of forward model predictions and video-derived (Argus video camera system) observations of wave roller dissipation and variation of the intertidal shoreline, and/or radar-derived observations of wave celerity. The procedure is as follows: 1. The system semi-automatically selects Argus 10-minute time exposure (timex) images based on preset criteria for image quality, i.e. images with sun glare, rain drops and fog are removed. 2. The images that passed are transformed into maps of wave energy dissipation, wave celerity and intertidal bathymetry using information about the tidal elevation and incoming wave conditions from the COSMOS system or from nearby wave/tide measurements. 3. Maps of the same properties are computed using an XBeach model which is run over the last available bathymetry and using the same hydrodynamic (wave and tidal) input data as was used to obtain the Argus-derived maps. 4. An algorithm updates the bathymetry in every grid point based on the local difference between the computed and observed properties. In its simplest form, the bed level h is updated based on the observed difference hobs and the current value h(t) given a
6th EARSeL Workshop on Remote Sensing of the Coastal Zone 7–8 June 2013, Matera, Italy
weighting factor observation.
h (t
t)
h (t )
5
which is based on the uncertainty in the current value and the
hobs
h (t )
However, in our application we do not have direct observations of the depth hobs. Instead, we have remote-sensing observations fobs of wave celerity and/or time-averaged image intensity, where f is a generic variable name. Thus, we must use an inverse model to relate the remotely sensed observations to the bathymetry. Using the chain rule, we obtain
h (t
t ) h (t )
1 f obs df dh
f (t )
A prerequisite is that these properties (dissipation and celerity) are differentiable to depth, i.e. the property value gives information about the depth. If f is the dissipation, this equation states that in locations where the Argus-derived observed wave dissipation fobs is larger than the computed dissipation, the depth in the model is decreased, as dissipation increases with decreased water depth. More details are provided in Van Dongeren et al. (2008). This procedure is repeated for every passed image. The bathymetric update produced by BeachWizard is input into the nearshore hydrodynamic forecast model for rip currents. THE ARGUS VIDEO MONITORING SYSTEM The ARGUS system has been initially developed by the Coastal Imaging Lab (CIL) at Oregon State University (OSU; http://cil-www.coas.oregonstate.edu). An ARGUS station enables the controlled acquisition and return of optical remote sensing data from land-based computers observing coastal sites of interest. Physically, an ARGUS station consists of a number of video cameras attached to a host computer that serves as both system control and communication link between the cameras and central data archives. The so-called ARGUS Runtime Environment makes then accessible a robust set of technical capabilities, originally developed in a research environment (and to which Deltares – WL | Delft Hydraulics has contributed actively for the past 20 years), to allow non-research users to address different management problems. The sophisticated, operational video analysis methods enable nowadays e.g.: The quantification of shoreline evolution and beach width, to evaluate the potential for recreation or to assess the morphological impact of a storm event; The quantification of sediment volumes at the intertidal beach, to evaluate the morphological impact of coastal structures, to investigate seasonal fluctuations in beach dynamics and beach nourishments or to study the behaviour of morphological features such as sand spits and tidal flats near a harbour entrance; The quantification of sub-tidal beach bathymetry, to evaluate coastal safety, to assess the behaviour and performance of shore face nourishments; The assimilation (Beach-Wizard technique) of observations of wave breaking patterns and intertidal beach bathymetries, within a numerical model, e.g. Delft3D or XBeach; The quantification of beach users, to establish daily, weekly, seasonal, and inter-annual user distribution patterns; The spatial quantification of an area covered by vegetation, to establish the seasonal dynamics of vegetation; The quantification of wave run-up, to evaluate the stability of coastal structures such as seawalls, harbour moles and revetments;
6th EARSeL Workshop on Remote Sensing of the Coastal Zone 7–8 June 2013, Matera, Italy
6
The quantification of wave parameters (period, direction) and alongshore current characteristics (velocity) by sampling high frequency pixel signals from the video signals based on the intensity changes of these pixels The Auto Shoreline Mapper (ASM) is an automated mapping procedure that, combined with offshore wave and water level data, collects elevation data from time exposure images without user supervision (see Uunk et al., 2010). The ASM derives therefore its data from three different data bases: a database with Argus video images, a database with offshore hydrodynamic data (water levels, wave data) and a database with previously detected shoreline points (elevations). One of the greatest specificities of the ASM is the automated generation of the region of interest (ROI). This region yields around the expected waterlines, within a spatial range that is defined by the user only once (origROI). The definition of this range is specific for each camera. The intersection of an automatically generated ROI (ASM ROI) for the image at time t and the userdefined ROI (origROI) is used for the generation of a more precise ROI (new ASM ROI) used for the processing at this specific time. For a certain time t, the AutoShorelineMapper (ASM) automatically determines the region of interest (ROI) around the expected shoreline location. Once the ROI is created, the detection and elevation models are applied in order to generation the shorelines. First, ASM delineates a shoreline feature from time-averaged video imagery on the basis of the visual contrast between the sub-aerial and sub-aqueous parts of the beach. In this study the PIC detection model is used, as it was shown to work well on Egmond beach (Aarninkhof et al., 2003), the field site for which we apply the operational model. The calculated elevation is assigned to the shoreline to derive an elevation contour. The corresponding shoreline elevation is estimated from the tide and wave conditions at the time of image collection. A quality control (shoreline points have to pass through specific acceptance criteria) is then performed before storage of the detected shorelines. The degree of confidence of each individual ASM result is evaluated on the basis of statistical parameters that provide a measure for the distinction between the clusters of pixels for the dry and wet areas and through the comparison of the measured shoreline location with the most recent intertidal beach bathymetry, determined from video. The shoreline elevation is computed in real-time from concurrent local measurements of the tidal level and wave height, period and direction. The ASM composes two bench-mark bathymetries from shoreline data within a certain time window and within a certain area around the interpolation location. The ASM generates these bathymetries by interpolation of previously detected shoreline data (x, y and z) using the loess interpolation method. This method applies length-scale dependent smoothing and is an appropriate method for interpolation of beach bathymetry. The procedure compares all detected shoreline points to the bench-mark bathymetries. The ASM accepts those shoreline points that are within a given vertical interval from the bench-mark bathymetry; those points with a too large deviation are rejected (Figure 3.1). The value of this interval, the so-called ‘vertical acceptance criterion’, is userdefined. The first step is to select a region of interest on the oblique image using IBM. This region of interest is an inherent part of the used PIC detection model. Within this region the detection model will search for the shoreline. The importance of a proper choice of the region of interest is twofold. Firstly, the PIC detection model uses the subset of pixels observed in this area to self-differentiate between ‘wet’ and ‘dry’ pixel colours. Secondly, the selected region restricts the area where the tool searches for a shoreline. An improperly defined ‘region of interest’ leads to incorrect identification of what pixel colours indicate ‘wet’ or ‘dry’ pixels, hence results in incorrect shoreline identification. This may especially occur when a large ‘region of interest’ is defined. The userdefined region of interest is defined in such a way that the defined ROI will always contain the pixels on which the shoreline can be detected, but do not include all obstacles and buildings present on the image.
6th EARSeL Workshop on Remote Sensing of the Coastal Zone 7–8 June 2013, Matera, Italy
7
The ASM is launched in such a way that water lines are detected for the specified ROIs. However, for acceptance of new shoreline points, the detected ones have to be compared to the two bench mark bathymetries, which are generated from shoreline data available in the argus product database within a specified time window. When starting a new real-time application, no shoreline points are most of the time available in the database. In this case, it is therefore necessary to detect and store shorelines points in a manual manner and using the IBM. Additionally, if other bathymetric sources are available, those can be used to generate the required bench mark bathymetries. For a proper use of the IBM, one refers to the Argus user manual (Aarninkhoff et al., 2007).
Figure: Shoreline points after application of acceptance criteria. The blue points are accepted and automatically stored in the database whereas the red points are discarded. SWIMMER SAFETY AT EGMOND BEACH The above example at Perranporth demonstrated the added value of using remote-sensed bathymetries for rip current predictions. At Egmond, this Beach Wizard prediction system is integrated into the COSMOS hydrodynamic prediction system. Together, the hydrodynamic and bathymetry estimate elements can provide process-based predictions of rip currents, rather than empirical predictions. The Egmond site (Figure 4, right) is situated in a meso-tidal environment with a tidal range in the order of 1.4 m and strong tidal longshore currents. The wave climate is wind-sea dominated with a modal wave height of 1 m and wave period of 5 s (Wijnberg, 2002). During summer the waves are generally low and do not vary considerably (Short, 1992). As mentioned above, rip currents have received limited attention although per year a handful of people drown after being caught in a rip. Egmond is equipped with a permanent Argus station with five semi-overlapping cameras mounted on top of the lighthouse, providing a synoptic view of the coast. An initial (hypothetical) plane beach bathymetry was evolved using wave energy dissipation maps obtained from the Argus time exposures images from 5 August until 22 August, which resulted in the bathymetry estimate shown in Figure 6 (left). This bathymetry does compare to the in situ measured bathymetry obtained in the framework of a study conducted by Winter et al. (2013) with a BSS of 0.68 for area around the inner bar (where the rip channels are usually located). Whereas the bathymetry near the shoreline is reproduced well, the outer bar is shifted offshore. The rip channel patterns clearly appear but the trough behind the breaker bar is not reproduced well. Still, the locations of the maximum
6th EARSeL Workshop on Remote Sensing of the Coastal Zone 7–8 June 2013, Matera, Italy
8
instantaneous offshore velocities are in good agreement, with alongshore offsets of 10 meters (for the black dot) and 70 meters for the red dot. The time difference between the occurrence of the offshore flow maxima over the Beach Wizard and measured bathymetry is in the order of minutes, with difference in maximum value of the rip current speed on the order of 0.10 m/s. This indicates that also for this wind-sea dominated environment a prediction system using a remote-sensed bathymetry can give useful predictions of rip current parameters. Finally, the COSMOS system is applied to the forecast of rip currents on Egmond Beach. For the example shown this prediction is based on the measured bathymetry of 22 August 2011. Figure 7 (left) shows a snapshot of the spatial distribution of the currents with the rip current indicated by the red arrow. This type of information may be useful to the life guards by itself, but the information can be presented in a more aggregated form as well. This is shown in Figure 7 (right), where time on the x-axis and location alongshore on the y-axis. Thus, the location and time where a rip current might be generated is shown in a color code that indicates its strength. The bottom panel shows the tidal elevation as a function of time, where the color code indicates the maximum strength in the alongshore. The figure confirms previous findings that rip currents develop most likely during low tide conditions, at locations where a discontinuity in the bathymetry is observed. This makes rip current locations and timing very predictable, with intensities depending on the meteo conditions. These types of graphs have been presented to the local life guard organization, and will help them in allocating resources and provide warnings to the public.
Figure 6: Left: Beachwizard predicted bathymetry for 22 August with locations of maximum offshore velocities indicated by the black and red dots. Right: In situ measured bathymetry for the same date with locations of offshore directed currents.
6th EARSeL Workshop on Remote Sensing of the Coastal Zone 7–8 June 2013, Matera, Italy
9
Figure 7: Left: Model prediction showing the spatial distribution of the currents . Right: Alongshoretime stack of offshore velocities (http://muienradar.nl/) REFERENCING Endnote signs for referencing can appear in a sentence at positions to which they belong. Example: The measurement of fluorescent (15) and absorbing matter (16) in the water column (17) is well known in marine optics and remote sensing (18,19). CONCLUSIONS This paper describes the development of a physics-based rip current prediction system called COSMOS. This system consists of a hydrodynamic prediction system which is composed of a cascade of surge and wave models from the global scale to the scale of a beach resort (order kilometers). For the beach resort scale model it is of utmost importance to use a recent measured or remote-sensed estimated bathymetry in order to accurately predict morphologically-controlled rip currents. To obtain bathymetry estimates from Argus video data, the Beach Wizard bathymetry estimating system is applied to the meso-tidal coast of Egmond aan Zee, the Netherlands. The system produces good estimates of the bathymetry and of the rip current parameters. Finally, we demonstrate the potential and form of rip current warnings based on the application of the COSMOS system for Egmond aan Zee. ACKNOWLEDGEMENTS The research was funded by Flood Control 2015 (Realtime Safety on Sedimentary Coasts) and Building with Nature (HK3.7 Swimmer Safety), Deltares Strategic Funding in the framework of the “Event-driven hydro and morphodynamics” (project 1202362) programs. REFERENCES 1
Bowen, A. (1969), Rip Currents 1. Theoretical Investigations J. Geophys. Res., 74(23), 54675478
2
Dalrymple, R. A., Macmahan, J. H., Reniers, A. J. H. M. and Nelko, V. (2011). Rip Currents. Annual Review of Fluid Mechanics, 43, 551-581.
3
Longuet-Higgins, M. S. and Stewart, R. W. (1964). Radiation stresses in water waves; a physical discussion, with applications. Deep Sea Research and Oceanographic Abstracts, 11, 529-562.
6th EARSeL Workshop on Remote Sensing of the Coastal Zone 7–8 June 2013, Matera, Italy
10
4
Aagaard, T., Greenwood, B. and Nielsen, J. (1997). Mean currents and sediment transport in a rip channel. Marine Geology, 140, 25-45.
5
Brander, R. W. and Short, A. D. (2000). Morphodynamics of a large-scale rip current system at Muriwai Beach, New Zealand. Marine Geology, 165, 27-39.
6
Macmahan, J. H., Thornton, E. B., Stanton, T. P. and Reniers, A. J. H. M. (2005). RIPEX: Observations of a rip current system. Marine Geology, 218, 113-134.
7
Winter, G. (2011). Rip Current Characteristics at the Dutch Coast: Egmond aan Zee. M.Sc. thesis, TU Delft, The Netherlands.
8
Baart, F., Van der Kaaij, T, Van Ormondt, M., Van Dongeren, A., Van Koningsveld, M., Roelvink, J. (2009). Real-time forecasting of morphological storm impacts: a case study in the Netherlands. Journal of Coastal Research, 56, 1617-1621.
9
Van der Werf, J., R. van Santen, M. van Ormondt, C. Briere and A.R. van Dongeren (2011). Operational model to simulate storm impact along the Holland Coast. Proceedings Coastal Sediments
10 Van Ormondt, M., A. van Dongeren, Ch. Briere, L. Sembiring, G. Winter, J. Lescinski and C. Swinkels (2012). Simulating storm impacts and coastal flooding along the Netherlands Coast. In: Comprehensive Flood Risk Management. Proceedings of the Flood Risk 2012 conference, Rotterdam, The Netherlands, Edited by Klijn, F. and T. Schweckendieck, pp. 28-29. 11 Tolman, H. (2009). User manual and system documentation of WAVEWATCH III™ version 3.14. NOAA / NWS / NCEP / MMAB Technical Note 276, 194 pp + Appendices 12 Roelvink, D., Reniers, A., Van Dongeren, A., Van Thiel de Vries, J., McCall, R., Lescinksi, J. (2009). Modelling storm impacts on beaches, dunes and barrier islands. Coastal Engineering, 56, 1133-1152. 13 Sembiring, L.E., J.A. Roelvink, A.R. van Dongeren, M. van Ormondt, C. Briere (2013). In preparation 14 Van Dongeren, A.R., N.G. Plant, A.B. Cohen, J.A. Roelvink, M. C. Haller, P. Catalán (2008). Beach Wizard: Nearshore bathymetry estimation through assimilation of model computations and remote observations. Coastal Engineering, Volume 55, Issue 12, December 2008, Pages 1016-1027. 15 Poyvkina L, S Babichenko & A Leeben, 1997. Spectral fluorescent signatures (SFS) in characterisation of the water environment. In: 3rd EARSeL Workshop on Lidar Remote Sensing of Land and Sea, edited by S Babichenko & R Reuter (EARSeL, Paris), 140-144 (In the case of a contribution to proceedings) 16 Bricaud A, A Morel & L Prieur, 1981. Absorption by dissolved organic matter (yellow substance) in the UV and visible domains. Limnology and Oceanography, 26: 43-53 (In the case of journal articles) 17 Barth H, R Heuermann, K D Loquay, R Reuter & U Stute, 1997. Long-term stable sensors for bio-optical measurements. In: Operational Oceanography. The Challenge for European CoOperation, edited by J H Steel, H W A Behrens, J C Borst, L J Droppert & J P van der Meulen (Elsevier Oceanography Series, 62, Amsterdam), 133-140. (In the case of a contribution in a book) 18 Kirk J T O, 1994. Light and Photosynthesis in Aquatic Ecosystems, 54-77 (Cambridge University Press) 509 pp. (in the case of a reference to pages in a book) Kirk J T O, 1994. Light and Photosynthesis in Aquatic Ecosystems, chapter 3 or section 3.3
6th EARSeL Workshop on Remote Sensing of the Coastal Zone 7–8 June 2013, Matera, Italy
11
(Cambridge University Press) 509 pp. (in the case of a reference to a chapter or section in a book) 19 Mobley C D, 1994. Light and Water (Academic Press) 592 pp. (In the case of complete books) Aagaard, T., Greenwood, B. and Nielsen, J. (1997). Mean currents and sediment transport in a rip channel. Marine Geology, 140, 25-45. Austin, M., Scott, T., Brown, J., MacMahan, J., Masselink, G. and Russell, P. (2010), Temporal Observations of Rip Current Circulation on a Macro-tidal Beach. Continental Shelf Research 30, 1149–1165 Austin, M. J, T. M. Scott, P. E. Russell, G.. Masselink (2012). Rip current prediction: development, validation and evaluation of an operational tool. Journal of Coastal Research. 29, Issue 2: pp. 283 – 300 Bruneau, N., Castelle, B., Bonneton, P., Pedreros, R., Almar, R., Bonneton, N., Bretel, P., Parisot, J.-P. and Senechal, N. (2009). Field observations of an evolving rip current on a meso-macrotidal well-developed inner bar and rip morphology. Continental Shelf Research, 29, 1650-1662. Callaghan, D. P., Baldock, T. E. and Nielsen, P. (2004). Pulsing and Circulation in Rip Current System. In: Smith, J. M., ed. International Conference Coastal Engineering, 2004 Lisbon. American Society of Civil Engineers, 1493-1505. Dette, H. H., Peters, K. and Spignat, F. (1995). About rip currents at a meso-tidal coast. In: Coastal Dynamics '95, 1995 Gdansk, Poland. American Society of Civil Engineers, 477-488. Johnson, D. and Pattiaratchi, C. (2004). Transient rip currents and nearshore circulation on a swell-dominated beach. J. Geophys. Res., 109, C02026. Lascody, R. (1998). East Central Florida Rip Current Program. National Weather Digest, vol.22-2, p25-30. Longuet-Higgins, M. S. and Stewart, R. W. (1964). Radiation stresses in water waves; a physical discussion, with applications. Deep Sea Research and Oceanographic Abstracts, 11, 529-562. Lushine, J. (1991). East Central Plorida Rip Current Program. National Weather Digest, vol.22, no2. Macmahan, J. H., Thornton, E. B., Reniers, A. J. H. M., Stanton, T. P. and Symonds, G. (2008). Low-Energy Rip Currents Associated With Small Bathymetric Variations. Marine Geology, 255, 156-164. Macmahan, J., Brown, J., Brown, J., Thornton, E., Reniers, A., Stanton, T., Henriquez, M., Gallagher, E., Morrison, J., Austin, M. J., Scott, T. M. and Senechal, N. (2010). Mean Lagrangian flow behavior on an open coast rip-channeled beach: A new perspective. Marine Geology, 268, 115. Sasso, R. (2012). Video-based nearshore bathymetry estimation for rip current forecasting on a macro-tidal beach. M.Sc. thesis, TU Delft, The Netherlands. Sasso, R., L.E. Sembiring, M.J. Austin, A.R. van Dongeren and J.S.M. van Thiel de Vries (2013). Application of BeachWizard on a macrotidal beach for rip current predictions. In preparation. Scott, T., Russell, P., Masselink, G., Wooler, A. and Short, A. (2007). Beach Rescue Statistics and their Relation to Nearshore Morphology and Hazards: A case Study for Southwest England. Journal of Coastal Research, S.I. 50, p1-6.
6th EARSeL Workshop on Remote Sensing of the Coastal Zone 7–8 June 2013, Matera, Italy
12
Scott, T., G. Masselink & P. Russell (2011). Morphodynamic characteristics and classification of beaches in England and Wales. Marine Geology, 286(1-4), 1–20.Sembiring, L.E. (2010). Application of Beach Wizard for coastal operational model system. M.Sc. thesis, UNESCO-IHE, The Netherlands. Sembiring, L.E., J.A. Roelvink, A.R. van Dongeren, M. van Ormondt, C. Briere (2013). In preparation. Shepard, F., Emery, K. and Fond, E. (1941). Rip Currents: A Process of Geological Importance. The Journal of Geology, 49, 337-369. Short, A. D. (1992), Beach systems of the central Netherlands coast: Processes, morphology and structural impacts in a storm driven multi-bar system, Marine Geology, 107(1-2), 103-132. Van Dongeren, A.R., N.G. Plant, A.B. Cohen, J.A. Roelvink, M. C. Haller, P. Catalán (2008). Beach Wizard: Nearshore bathymetry estimation through assimilation of model computations and remote observations. Coastal Engineering, Volume 55, Issue 12, December 2008, Pages 1016-1027. Van Rijn, L.C., Walstra, D.J.R., Grasmeijer, B., Sutherland, J., Pan, S., Sierra, J.P., 2003. The predictability of cross-shore bed evolution of sandy beaches at the time scale of storms and seasons using process-based profile models. Coastal Engineering 47, 295–327. Verbeek, W. (2006). Mui Monitoring Project MMP-02. www.muien.nl Wijnberg, K. M. (2002), Environmental controls on decadal morphologic behaviour of the Holland coast, Marine Geology, 189(3–4), 227-247 Winter, G., A.R. van Dongeren, M.A. de Schipper, J.S.M. van Thiel de Vries (2013). Rip Currents on a Shelf Sea coast with Obliquely Incident Wind Waves and Tidal Longshore Currents. Submitted to Coastal Engineering. Wright, L. and A. Short. (1984). Morphodynamic variability of surf zones and beaches. Marine Geology, 56 (1984) 93—118.