We implemented in OPNET the in-band drop and out-of- band drop algorithms ... A communication session consists of two phases: probe phase and data phase.
OPNET Implementation of Endpoint Admission Control Algorithms Kun Wu, Yan Ma, and Ljiljana Trajkovic Simon Fraser University Burnaby, British Columbia Canada V5A 1S6 {karenw, ymaa, ljilja}@cs.sfu.ca
Abstract The history of telephone networks indicates a trend of employing sophisticated switches and dumb hosts. Hence, it is often expensive and difficult to replace switches and add new applications. In contrast, Internet employs simple routers and sophisticated applications in hosts. New applications can be added without requiring infrastructural changes. In order to keep routers simple, there is a growing need for new mechanisms employing end-hosts that provide admission control.
from routers to end-hosts. In an EAC scheme, endpoints send probe packets to measure network conditions before transmitting data. Endpoints then accept or reject connections based on the measured outcome. These mechanisms do not require implementation of additional procedures in routers, other than routers’ capability to provide differentiated services. Various endpoint admission control algorithms emerged recently [2]-[6]. The underlining approach of these designs is that endpoints probe the path by sending probe packets at the maximum data rate, and hence collect path information before sending data. The flow could be admitted if the probe experiences a better quality than a specified threshold. EAC, primarily intended to support a soft real-time service, provides only an enhanced QoS without hard guarantees. Given that the queuing delays are likely to be small, the QoS is measured strictly in terms of packet loss. The goal of EAC is to make this packet loss rate small, without giving any precise quantitative assurances [3].
In this paper, we describe OPNET implementation of two endpoint admission control (EAC) algorithms. The OPNET EAC model captures basic EAC procedures for network probing and data transmission. We discuss several architectural issues and implementation details. We then describe the packet format and the node and process models of the end-hosts and routers. We also present simulation scenarios based on various traffic sources, traffic loads, probing times, and number of hops. Keywords: Admission control algorithms, endpoint admission control, measurement-based admission control, best-effort service, quality of service.
In summary, EAC is an attempt to use the regular best-effort infrastructure with DiffServ [7] extensions and, by adding control algorithms at the endpoints, deliver a real-time service. This represents a considerable shift in the way real-time services are supported [7].
1. Introduction The service quality of today’s Internet is quite unpredictable and not reliable enough to provide satisfactory services for the emerging applications, such as real-time audio and video that require strict Quality of Service (QoS) parameters. For example, an ordinary voice conversation demands a one-way delay of less than 150 ms [1]. This is determined by human perception, and, thus, does not differentiate whether the telephone call is carried by a traditional circuit-switched or an IP network. Similar limits exist for other multimedia applications. Hence, most applications are designed to deal with losses and to reduce delay jitter in a lightly loaded network. Among many proposals for improving the QoS, admission control is an attractive approach.
This paper is organized as follows: in Section 2, we discuss the EAC principles and various procedures; in Section 3 we describe the OPNET implementations of EAC schemes; and in Section 4 we present the simulation results. We summarize the results and give possible extensions for future work in Section 5. 2. Overview of EAC Principles and EAC Variants Two key components of the EAC scheme are a measurement process that produces an estimate of the current network condition and a decision algorithm that uses the information collected by the measurement process to make admission control decisions. EAC schemes proposed in the literature can be classified based on several criteria.
Admission control is a procedure used to ensure that admittance of a new flow into a resource-constrained network does not violate service commitments made by the network to the already admitted flows [2]. Given the existing traffic information, the network decides whether there are sufficient resources to meet the QoS requested by the new connection. Traditional centralized approach for admission control is router-based. Routers perform per-flow admission control, maintain per-flow states, and process all the measuring, computing, and decisionmaking. Although these schemes may provide excellent QoS, they are difficult to deploy because they require modifications of the current IP infrastructure.
Based on the distinction between admission-controlled and nonadmission-controlled (best-effort) traffic, EAC schemes can be classified into legacy, in-band, and out-of-band [7]. Legacy EAC treats the traffic equally. In-band EAC separates admissioncontrolled from non-admission-controlled traffic and gives the former a higher priority, while out-of-band EAC goes even further: it divides admission-controlled traffic into probe traffic and data traffic, where data traffic gets the highest priority. In the decision-making stage, there are two methods for indicating network congestion: congestion mark and packet drop. In the algorithm that marks packets in the case of
Newly proposed EAC schemes avoid the need for infrastructure modifications by moving the per-flow resource management 1
congestion [5], all packets are treated equally. Hosts can send as much traffic as they wish and must pay for the marked packets in case of congestion. In a quite different approach, packet drop is used as a sign of congestion [3], [4] and probe packets may be sent either with an identical or a lower priority class than data packets. Hence, EAC schemes can be classified into four groups: in-band drop, out-of-band drop, in-band mark, and out-of-band mark. We implemented in OPNET the in-band drop and out-ofband drop algorithms. According to the literature [7], packet drop and congestion mark algorithms have similar performance. Hence, we omitted implementing the marking mechanisms. Scheduling mechanisms also have various effects. The most striking approach is to use a rate limiter, which is a strict priority scheduler with a bandwidth (or buffer) limit imposed on the admission-controlled traffic. The transmission capacity is divided into two bands: one for admission-controlled traffic and the other for the best-effort traffic. The admission-controlled traffic is not permitted to surpass its assigned portion and steal bandwidth from the best-effort traffic. The best-effort traffic can use its own share of bandwidth and the portion left by the admission-controlled traffic. The bandwidth limit for the admission-controlled traffic applies to the sum of the admissioncontrolled data traffic and probe traffic. Nevertheless, there is no separate band limits for each flow of data traffic. The relationship is illustrated in Figure 1, where Ctotal is total available capacity, Cbe is the capacity allocated to best-effort traffic, and Cadm is allocated for admission-controlled traffic. Bandwidth
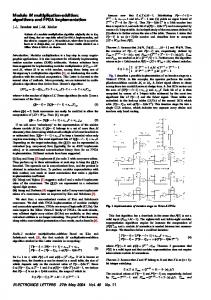
Figures 2 and 3 illustrate the acceptance and rejection communication sessions, respectively. In our model, we separated the sender and receiver to simplify the implementation, although in a deployed network an end-host should be able to send and receive packets at the same time. Sender
Receiver
Probe phase Measured time Timeout
Feedback Accept
Data phase
Figure 2: Acceptance of a communication session. Sender
Receiver
Probe phase Measured time Timeout
Ctotal
Back off
Cbe
Timeout
Feedback Reject
Timeout
Re-probe Cadm
Figure 3: Rejection of a communication session. Time
Figure 1: Bandwidth allocation. In the case of the in-band EAC algorithm, we implemented one queue for both probe and data traffic. In the case of the out-ofband EAC, we implemented separate queues for date and probe traffic. 2.1 Algorithm description A communication session consists of two phases: probe phase and data phase. A session always begins with a probe phase. The sending host sends probe packets at the maximum transmission rate that will be required in the data phase for a pre-agreed period. The receiving host tracks the loss of probe packets and, at the end of the probing period, sends the acceptance/rejection decision to the sending host. The host may make a decision before the end of the probe phase. This is called early-reject. Upon receiving the acceptance decision, the sending host enters the data phase and starts sending data. In case of a rejection, it backs off for a certain amount of time, and then re-probes for the same session.
2
The probing period needs to last long enough to guarantee a rather accurate measurement, but not too long to introduce unnecessary additional traffic into the network. Usually, there will be a range of choices that are defined in the service contract. The acceptance threshold should be constant and uniform across sessions in the same service class. If variable thresholds were allowed, the QoS for admitted flows would be degraded by the flow with the less stringent requirements (higher threshold values) [7]. 3. OPNET Model: Implementation Details We have implemented in-band drop and out-of-band drop OPNET EAC models with early reject technique enabled. For simplicity, we have not implemented the back off and re-probe phases (Figure 3) upon rejection of a session. Instead, we only allow the sender to probe the network once for each session. If the receiver rejects the session attempt, the sender counts this session as a failure, and starts a new session. In a real network, a sender should be able to back off and then re-probe several times before aborting the session. However, the simplified scheme that we implemented has the same effect as the implementation with re-probe functionality because, from traffic point of view, the reprobe flow can be seen as a new flow.
Data packets and probe packets contain 100 and 64 bytes, respectively. Small probe packets are chosen to use less bandwidth and, hence, achieve more accurate measurements. We defined eleven fields in the packet header: destination address (DA) and its subnet (DES_NET), source address (SA) and its subnet (SRC_NET), session ID (Session_ID), sequence ID (SEQ_ID), priority ID (PRIO_ID), probe (or data) transmission rate (TRAN), probe (or data) transmission period (DUR), the number of hops (HOP_NUM), and FLAG. SEQ_ID is the sequence number of the packet in a session. Session_ID denotes the communication session number that the host wishes to set up. SA, SRC_NET, and Session_ID compose a unique identifier to distinguish the sender at the particular time instance. This identifier helps the receiving host distinguish sessions from various senders, because, in our design, the receiver needs to handle multiple sessions simultaneously. 3.1 End-hosts: EAC Sender and Receiver EAC Sender node model: The node model of the EAC Sender (Figure 4) consists of a processor (proc) that is the core of the EAC sender, a probe source (pb_src) that generates constant bit rate (CBR) probe packets, and a data source (data_src) that generates CBR or variable bit rate (VBR) data traffic. proc uses two statistic wires to control when data and probe sources start or stop generating traffic. A built-in transmitter xmt sends the probe or data traffic, and a built-in receiver processor rcv receives feedback packets from the receiver.
Figure 4: EAC Sender node model. EAC Sender process model: The EAC Sender process model (proc) is shown Figure 5. In the init state, proc loads the attributes and registers the statistics. It then enters the probe state to trigger the probe source to generate probe packets. Upon receiving an empty packet from the pb_src, proc sets the fields in the header and sends the packet to the receiver. If a negative feedback arrives, the sender starts probing again for a new session after a pause that is specified in the model interface by the user. If a positive feedback arrives on time, proc triggers the data_src to start generating traffic. It also detects wrongdelivered packets (unmatched DA in the packet header) or obsolete feedback packets.
Figure 5: EAC Sender process model.
3
EAC Receiver node model: The node model of the EAC Receiver consists of a processor, a built-in point-to-point receiver, and a built-in point-to-point transmitter.
packet header. Then, it updates the value in the hush-table and processes the packet accordingly. When a probe packet for a new session arrives, the receiver creates an instance of pk_struct using the values obtained from the packet header, and then stores the instance into the probe’s hush-table. At the same time, the receiver starts a feedback timer to invoke the action of sending feedback at the end of the probe phase. Upon timeout, the receiver calculates the experienced packet loss, makes the admission decision, and sends the corresponding feedback. The pseudo code is:
EAC Receiver process model: The EAC Receiver process model is shown in Figure 6. The process begins at init state and then enters the idle state. The processor may enter feedback, close_session, or rcv_packet states depending on the specific event: if a packet arrives, it enters rcv_packet state; if it is time to send a feedback, it enters feedback state and sends a feedback packet; and if it detects an obsolete session, it enters close_session state to perform garbage collection.
If threshold × SEQ_ID > SEQ_ID - number_received Then Send positive feedback decision Else Send negative feedback decision.
In case of the early-reject technique, the probing period is divided into several time slots. At the end of each time slot, the receiver checks whether the experienced traffic condition is beyond the threshold. If so, it sends a negative feedback decision immediately, cancels the feedback timer, and closes the session. The feedback packet is sent with a higher priority to minimize the risk of loss. In our implementation, we opted not to resend the feedback packet if it gets lost because an EAC Sender drops the session when either no feedback is received on time or the received feedback is negative. If the lost feedback packet were negative, we assumed that losing it had the same effect as receiving it. If the lost feedback packet were positive, it would have affected the validity of our assumption. However, in both cases, loosing a feedback packet, which has a higher priority, implies that the network is most likely congested. Hence, not resending a feedback packet is a reasonable option to simplify the implementation.
Figure 6: EAC Receiver process model. In order to handle multiple sessions from different senders simultaneously, the receiver employs two hush-tables to store the information collected during probe and data phases. Sender’s SA, SRC_NET, and Session_ID are combined to form the key of the hush-table. The value stored in the hush-table is a userdefined data structure pk_struct, which is defined in the header file and included into the model. The definition of the structure is:
When a data packet arrives, the receiver collects statistics. In normal network conditions, the last data packet in a session is the FIN packet. Its FLAG field in the packet header is set to FIN. Upon receiving a FIN packet, the receiver closes the corresponding session. In the case when the FIN packet gets lost, the receiver forcibly closes the session that has been idle for too long and performs the garbage collection. Timers are implemented in the model to invoke the garbage collection periodically.
typedef pk_struct { state; // three possible values: unused, open, and closed. address; // sender ID. subnet_id; // subnet that contains the sender. pk_num; // number of packets received during the session. seq_id; // sequence number of the last received packet. trans_rate; // transmission rate used in the current phase. trans_dur; // estimated transmission duration. loss_num ; // number of packets lost. loss_rate ; // (packets sent – packets received)/packets sent timer ; // time of the first packet arrival. event; /* an event handle for setting the timer to invoke the action of sending feedback at the end of the probing phase. Reference this handle in case of event cancellation. */ }
3.2 Router model and its queue process model We implemented a relatively simple router model. It has only five pairs of ports: four pairs are for the local hosts and the fifth pair is the default port for routing packets. In order to avoid complicated routing tables and routing rules, we implemented a simple routing algorithm: Check the subnet destination of the incoming packet. If the packet is addressed to the local subnet, then Get address ID from the packet header, Send the packet to the port that matches the address ID. Else (packet is not addressed to the local subnet) If the packet is from a local host, then
In general, when a packet arrives, the receiver checks the packet type and gets sender’s SA, SRC_NET, and Session_ID from the 4
Route it to the default port. Else (the packet is from the default port, i.e., from another subnet) Route it to the user-specified outgoing port (User specifies outgoing port via the model interface before starting the simulation.)
We implemented two EAC router models: in-band and out-ofband. They have identical queue process state diagrams (Figure 7). The procedures in the queue process model are: - Upon packet arrival, router moves from init or idle to arrival state; - Insert the packet into the corresponding queue if there is a space in that queue; if no space, the packet is dropped. - Upon successful insertion, if the router is not busy serving another packet, it enters svc_start to start a service timer, and then goes to idle state to wait for the service time finish. If the router is busy, it enters idle state directly. - Whenever router finishes serving a packet, it enters svc_compl state to de-queue the packet based on its priority and to send it.
of the in-band EAC scheme (Figure 22). Traffic source parameters are given in Table 1. We present ten simulation results. Each is illustrated by the data loss (data loss vs. time) and probe loss (probe loss vs. time) graphs. These are statistics that the receiver module collects from all senders over the data and probe phases. Data (or probe) loss is the percentage of accumulated data (or probe) packets loss with respect to the total data (or probe) packets transmitted by all senders at each session over one simulation period. Probing and data durations are 10 and 100 sec, respectively.
Figure 8: Simulation scenario for single-hop network model. Scenario
Figure 7: Router queue process model. The router also increases the HOP_NUM field in the packet header. The receiver uses the HOP_NUM to calculate the waiting time before forcibly closing an obsolete data session, as in the case when the session’s FIN packet is lost. Although the two-router mo dels have identical process state diagram, they have different scheduling algorithms. The in-band router stores the data and probe packets in one FIFO queue with a buffer size of eight packets, and stores best-effort packets in a separate queue with a lower priority and a buffer with no size limitation. The out-of-band router stores data and probe packets in two separate queues: the queue for data packets has higher priority and a buffer size of six packets, while the queue for probe packets has lower priority and a buffer size of two packets. The rate-limiter discussed in Section 2, which employs a weighted round robin algorithm, guarantees that the maximum service time used for admission-controlled traffic is 2/3 of the entire bandwidth, while the minimum service time used for the best-effort traffic is 1/3 of the entire bandwidth. 4 . Performance Evaluation In order to illustrate the behavior of EAC schemes, we employ two network models. For most simulation scenarios, we use a single-hop network model. It has three senders and one receiver (Figure 8). We use a multi-hop network model for the simulation
5
con_3_sender _in-band con_3_sender _out-of-band bur_3_sender_ in-band bur_3_sender_ out-of-band Multi-hop
EAC sender (transmissi on rate) (bps) CBR (512, 512, 1024) CBR (512, 512, 1024) VBR (5120) VBR (5120) CBR (600)
Router (bps)
Service rate (bps)
in-band 1024 out-ofband inband out-ofband inband
1000 4800 6144 1024
Q u Buffer e (pk) u e 1 8, infinity 3 2,6, infinity 1 8, infinity 3 2,6, infinity 1 8, infinity
Link (bps)
2048 2048 9600 9600 1024
Table 1: Traffic source parameters. 4.1 In-band EAC algorithm Figures 9 and 10 show simulation results for the in-band EAC model using CBR traffic. They indicate reduced data losses when end-hosts control the flow admission. At the beginning of the simulation, three senders compete to be admitted by the receiver. The sender experiencing a probe loss rate above the threshold of 0.2 will not be admitted (Figure 9). Other senders, experiencing a probe loss less than 0.2, will be admitted. Figure 9 indicates that the average data loss is lower than the threshold while the maximum data loss is approximately 0.2. In Figure 10, when the threshold increases to 0.5, the maximum probe loss during the entire simulation period is below 0.5.
Hence, all session-setting attempts from the three senders are accepted. All three senders start their first session-setting attempts at the beginning of the simulation time simultaneously. Because of the large threshold value, all flows are admitted and start sending data traffic after the probing phase, which causes heavy traffic in the network. Hence, packet loss reaches a peak at the beginning. After a while, senders are in different phases of their transmission and they are not sending probe or data packets simultaneously. Therefore, the traffic gets smoother and both probe and data losses start decreasing.
maximum data loss is close to the threshold value for both CBR and VBR traffic. Hence, the threshold is a reasonable indicator of the traffic loss in the case of the in-band EAC algorithm.
Figure 11: In-band EAC model using VBR traffic: probe loss and data ol ss. Receiver has a threshold of 0.2. The three senders start the first probing phase at 0 sec.
Figure 9: In-band EAC model using CBR traffic: probe loss and data loss. Receiver has a threshold of 0.2. The three senders start the first probing phase at 0 sec.
Figure 12: In-band EAC model using VBR traffic: probe loss and data loss. Receiver has a threshold of 0.5. The three senders start the first probing phase at 0 sec.
Figure 10: In-band EAC model using CBR traffic: probe loss and data loss. Receiver has a threshold of 0.5. The three senders start the first probing phase at 0 sec.
4.2 In-band EAC algorithm: short probing vs. long probing periods We investigated the probing period and examined its effect in case of the in-band model with VBR traffic. The data transmission duration is 100 sec, while simulation duration is 1,000 sec.
We repeated the two simulation scenarios with the VBR traffic source. Simulation results are captured with thresholds set at 0.2 and 0.5 (Figures 11 and 12, respectively). The maximum data loss during the simulation period is close to the threshold (0.2 or 0.5), and the average data loss is below the threshold. Figures 912 indicate that in the case of in-band EAC scheme, the
In the simulation scenario where the sender probes for a short period, the ratio between probing period and data period is approximately 2-3%. Data loss (Figure 13) reaches the maximum value of 0.5, twice the threshold. However, the probe loss rate is still low. When the ratio increases to 25-30%, the data loss decreases to the threshold level (Figure 14).
6
The difference between Figures 13 and 14 indicates that for the in-band EAC scheme, long probing can produce better measurement accuracy than short probing. However, long probing may not be always preferred. Controlling the length of the probing period may be used to optimize the network performance.
Figures 15 and 16 imply that admitted flows using short probing periods suffer approximately ten-time higher data loss than flows using long probing periods, but have roughly 10% higher utilization. If resources permit, using long-probing period in inband EAC achieves better performance. However, using long probing periods may have higher possibility of congesting the network. Hence, it is important to choose the right probing period. 0.08 0.07
Data loss
0.06 0.05 0.04 0.03 0.02 0.01 0.25
Figure 13: In-band EAC model: probe loss and data loss. Receiver’s threshold is 0.2. Probing periods of the three senders are 2, 2, and 3 sec, respectively.
0.3
0.35
0.4
0.45
0.5
0.55
Network utilization
0.6
0.65
Figure 15: In-band EAC model: data loss rate vs. utilization using short probing periods. Receiver’s threshold is 0.2. Probing periods of the three senders are 2, 2, and 3 sec, respectively. 0.017
Data loss
0.016
0.015
0.014
0.422
Figure 14: In-band EAC model: probe loss and data loss. Receiver’s threshold is 0.2. Probing periods of the three senders are 25, 25, and 30 sec, respectively. We also used link utilization to examine the performance of the in-band EAC scheme. Figure 15 shows that short probes cause more severe data loss, but permit relatively higher link utilization. When the average data loss is above 0.04, utilization increases to 50-60%. On the other hand, the utilization is much lower (only 40%) in the case when senders use long probing periods (Figure 16) because more bandwidth is used for testing the network condition.
7
0.425
0.43
0.435
Network utilization
0.44
Figure 16: In-band EAC model: data loss rate vs. utilization using long probing periods. Receiver’s threshold is 0.2. Probing periods of the three senders are 25, 25, and 30 sec, respectively. 4.3 Out-of-band EAC algorithm The simulation results are different in the case of out-of-band EAC algorithm. The network model is the same as in the case of in-band scenario, except that the router employs out-of-band process model. We performed two simulation runs with CBR traffic and two with VBR traffic. The traffic model parameters of the end-hosts are identical to the case of in-band simulations. Figure 17 is the result captured from the first simulation case for the out-of-band EAC algorithm with a CBR traffic and threshold value of 0.2. It shows zero data loss, much lower than the value
in the case of the in-band EAC model. Nevertheless, the probe loss is much higher than the corresponding probe loss in the inband model (Figure 9), which indicates that most attempts for setting a connection were rejected. After increasing the threshold to 0.5, probe loss decreases, which implies that the number of accepted session setting attempts increases. Data loss is zero most of the time (Figure 18). Average data loss is far below the threshold. Compared to the maximum data loss rate of 0.6 in the case of the corresponding in-band EAC simulation (Figure 10), out-of-band algorithm has the maximum data loss of only 0.3.
Figure 19: Out-of-band EAC model using VBR traffic: probe loss and data loss. Receiver’s threshold is 0.2. The three senders start the first probing phase at 0 sec.
Figure 17: Out-of-band EAC model using CBR traffic: probe loss and data loss. Receiver’s threshold is 0.2. The three senders start the first probing phase at 0 sec.
Figure 20: Out-of-band EAC model using VBR traffic: probe loss and data loss. Receiver’s threshold is 0.5. The three senders start the first probing phase at 0 sec.
Figure 18: Out-of-band EAC model using CBR traffic: probe loss and data loss. Receiver’s threshold is 0.5. The three senders start the first probing phase at 0 sec. Figures 19 and 20 show the simulation results for the out-ofband EAC algorithm with VBR traffic.
8
Figures 17-20 show that in the case of out-of-band EAC algorithm, data loss is always lower than the threshold and the corresponding results for the in-band algorithm. It is difficult to relate the threshold to the actual data loss. The probe loss is much higher than the corresponding probe loss for the in-band algorithm. Unlike the case of the in-band EAC algorithm, in the out-of-band EAC case, data traffic has a higher priority than probe traffic. Hence, in the case of out-of-band EAC algorithm, probe packets are more likely to be lost than data packets if congestion occurs.
4.4 Comparison of the in-band and out-of-band EAC algorithms From the data loss aspect, out-of-band algorithm always achieves lower data loss than in-band EAC algorithm. However,
Number of accepted sessions
when we examine the number of successful sessions, in-band algorithm produces better results. The data shown in Figure 21 is obtained under the identical simulation conditions for both inband and out-of-band algorithms. The plot shows that in-band algorithm permits more flows into the network than the out-ofband algorithm.
In-band EAC algorithm
Data loss
11
Flow admission
10 9 8
Table 2: Comparison of in-band and out-of-band EAC algorithms.
7 6
4.5 Multi-hop network Simulation results discussed in Sections 4.2-4.4 are based on the single-hop network model. We use a multi-hop scenario to investigate the EAC behavior when packets have to cross several hops to reach the receiver.
5 4
in-band out-of-band
3 2 1 0
Out-of-band EAC algorithm Data and probe traffic Data loss is much lower. are closely related. It is difficult to relate the Threshold may be a good actual data loss to the predicator. threshold. Data loss is higher. Easier to admit flows. Flows are not easily admitted.
200
400
600
Time (sec)
800
1000
Figure 21: Comparsion of the number of accepted sessions for in-band and out-of-band EAC models.
In the multi-hop network model (Figure 22), subnet 0 has two senders (sender1 and sender3). Subnet 1 has one sender (net1_sender2) and one receiver (net1_receiver3). Subnet 2 and subnet 3 have one receiver each (receiver3 and receiver2, respectively).
Through the simulation experiments with in-band EAC and outof-band EAC, we showed that both algorithms have advantages and disadvantages. Details are listed in Table 2.
Possible bottleneck link 1
Possible bottleneck link 2
Possible bottleneck link 3
Figure 22: Multi-hop network model.
9
Senders have identical model parameters, such as probe and data transmission rates or probing and data periods, except that the DA (destination address ID) and DES_NET (destination subnet ID) are different in each simulation scenario. For fairness, receivers in the three subnets have identical threshold of 0.2. Every sender may set up a session with any receiver.
Simulation results indicate that EAC is capable of providing certain levels of QoS in the network, such as achieving a predefined packet loss probability for a flow. In the case of in-band EAC algorithm, a close relationship between the maximum data loss and the defined threshold can be maintained. Furthermore, using long probing periods can lead to more accurate predication of the data loss. Out-of-band EAC algorithm provides better QoS with respect to data loss.
Senders communicate with various receivers so that packets traverse various hops and create bottlenecks in different links in the network (Figure 22). We examine the relationships between the number of bottlenecks and the number of hops vs. the ratio of successful sessions, respectively. Figures 23 and 24 indicate that the number of bottlenecks that a connection may experience in the network, rather than the number of hops, influences the ratio of successful sessions. The number of bottlenecks seems to dominate the data loss, while the number of hops does not necessarily impair the admission decision. However, a flow passing through multiple hops may have higher blocking probability because it has a higher chance to traverse more bottlenecks.
For both EAC schemes, a larger number of sessions was admitted for CBR, compared to VBR traffic. This implies that the more detailed forecast of network traffic is available, the sharper the QoS predictions and better network utilization could be achieved [8]. Hence, smoothing the traffic using certain traffic shaping and policing techniques can help achieve better performance. The measurement and decision-making methods play important roles in EAC algorithms. We have fine-tuned the threshold value during simulation experiments to achieve better performance results. Further developments of EAC algorithm may include embedding the current model into the complete OSI stack, investigating other traffic probing and measurement techniques, and using genuine traffic traces.
Number of bottlenecks
3
6. References [1] L. Breslau, S. Jamin, and S. Shenker, “Comments on the performance of measurement-based admission control algorithms,” in Proceedings of IEEE INFOCOM, Tel Aviv, Israel, March 2000, pp. 1233-1242. [2] G. Bianchi, F. Borgonovo, A. Capone, L. Fratta, and C. Petrioli, “Endpoint admission control with delay variation measurements for QoS in IP networks,” ACM Computer Communication Review, vol. 32, no. 2, pp. 61-69, April 2002. [3] V. Elek, G. Karlsson, and R. Ronngren, “Admission control based on end-to-end measurements,” in Proceedings of IEEE INFOCOM, Tel Aviv, Israel, March 2000, pp. 623-630. [4] G. Bianchi, A. Capone, and C. Petrioli, “Throughput analysis of end-to-end measurement-based admission control in IP,” in Proceedings IEEE INFOCOM, Tel Aviv, Israel, March 2000, vol. 3, pp. 1461-1470. [5] F. Kelly, P. Key, and S. Zachary, “Distributed admission control,” IEEE Journal on Selected Areas in Communications, vol. 18, no. 12, pp. 2617-2628, December 2000. [6] S. Jamin, S. Shenker, and P. Danzig, “Comparison of measurement-based admission control algorithms for controlledload service,” in Proceedings of IEEE INFOCOM, Kobe, Japan, April 1997, pp. 56-70. [7] L. Breslau, E. Knightly, S. Shenker, I. Stoica, and H. Zhang, “Endpoint admission control: architectural issues and performance,” in Proceedings of ACM SIGCOMM, Stockholm, Sweden, August 2000, pp. 57-69. [8] Lj. Trajkovic and A. Neidhardt, “Effect of traffic knowledge on the efficiency of admission control policies,” ACM Computer Communication Review, vol. 29, no. 1, pp. 5-34, January 1999.
2
1
0 0
0.2
0.4
0.6
0.8
Ratio of successful sessions
1
Figure 23: Number of bottlenecks vs. ratio of successful sessions.
Number of hops
5
4
3
2
1
0 0
0.2
0.4
0.6
0.8
Ratio of successful sessions
1
Figure 24: Number of hops vs. ratio of successful sessions. 5. Conclusions and Open Issues
10