Optical Performance Monitoring in DWDM Networks Using. Channel's 2nd
Harmonic Generation. Moncef B.Tayahi*, Sivakumar Lanka, and Banmali Rawat.
583
INTERNATIONAL JOURNAL OF MICROWAVE AND OPTICAL TECHNOLOGY VOL. 1, NO. 2, AUGUST 2006
Optical Performance Monitoring in DWDM Networks Using Channel's 2nd Harmonic Generation Moncef B.Tayahi*, Sivakumar Lanka, and Banmali Rawat Advanced Photonics Research lab, Department of Electrical Engineering University of Nevada, Reno, NV 89557, U.S.A. Tel: 1-775-784-6103; Fax: 1-775-784-6627; E-mail:
[email protected] Abstract- Optical second harmonic generation in dense wavelength division multiplexing was used to monitor the performance of each channel in all dense wavelength division multiplexing (DWDM) optical networks using a highly nonlinear photonic crystal fiber. Index Terms- Fiber measurements, Networks, Holey Fiber
I. INTRODUCTION Present optical communication systems require optical-electronic-optical (O-E-O) for nearly all operations in the network which is not only expensive, but also restrictive; it prevents optical transparency, discards many of the attributes of optical signals, such as phase, frequency, polarization, and prohibits the use of advantages of optics, such as ultra fast processes on picoseconds and sub-picoseconds time scales. Our approach aims at making compact, efficient and functional subsystems that can perform as many functions as possible such as real time monitoring of complex all optical DWDM networks [1-2]. Our prior work used poled Lithium Niobate (PP-LNO3) for the second harmonic generation, however, it was shown that SHG conversion efficiency was low and new photonics bandgap fibers provide better conversion efficiency [3]. Optical signal to noise ratio (OSNR) is an important analog performance parameter that is often considered for monitoring optical networks [4]. Optical filtering in optical add-drop multiplexers (OADM’s) and optical crossconnects (OXC’s) reshape the noise background.
Interpolation of the noise background across the band can also be excluded by optical switching because each channel can acquire a unique noise background. The parameters that most OPMs measure directly are average optical power and wavelength; typically using a few percent of the signal power extracted from the transmission fiber. From these direct measurements, a host of critical network performance parameters can be derived, such as channel presence verification, channel wavelength, ASE noise, and opticalsignal power, optical SNR (OSNR) per channel, optical-amplifier gain, and gain tilt, signal Qfactor where the BER can be estimated [5]. These parameters may then be used to manage network reliability and define a quality of service for end customers. II. NONLINEAR CONVERSION Our study explores novel techniques to find the best possible approach in order to develop integrated optical performance monitoring to realize transparency in optical networks. The specific device being used for second harmonic generation is a highly nonlinear photonic crystal “holey fiber” which can be used for super continuum generation. The relation between the fundamental power and the second harmonic power for a photonic crystal fiber is given by [6]: 2
P2w =
8w 2 d eff Pw n 2w n w
2
2
⎛1 ⎞ sinc 2 ⎜ ∆βL ⎟ ε 0 c 0 A ovl ∆β ⎝2 ⎠ 2
3
2
(1) where ‘w’ is the fundamental frequency, Aovl is
IJMOT-2006-6-99 © ISRAMT 2006
584
INTERNATIONAL JOURNAL OF MICROWAVE AND OPTICAL TECHNOLOGY VOL. 1, NO. 2, AUGUST 2006
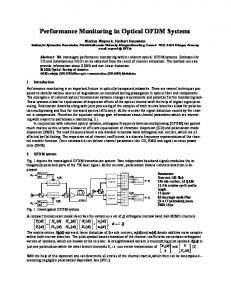
the overlap area between fundamental and second harmonic fields, ∆β is the wave vector mismatch and deff is the effective nonlinear constant, Pw and P2w are the fundamental and SH. powers respectively. Using equation (1), the SH power and conversion efficiencies were plotted for different effective nonlinear constants as shown in Fig. 1. Conversion efficiencies of almost 30% can be achieved by carefully designing the holy fiber. We have investigated the background and a test device has already been designed. The holey fiber used for this purpose had a grating length of 6 cm and the fiber had a core size of 2 µm. Fig. 2 illustrates the principle of using SH in performance monitoring. The output wavelengths λ1----λn from a single fiber followed by erbium doped fiber were coupled to a nonlinear photonic crystal fiber. The optical path intercepted by a train of broad band dichroic beam splitters (DMn) reflecting the SHG wavelength band. The DWDM wavelength in the C and L (λ1,…λn), are converted to (λ1/2,…. λn/2), the channel were then separated by the dichroic mirrors DMn’s. Besides the advantage of using low cost Sidetector, we have eliminated the need of highresolution spectrometers like gratings and FP’s. We have also significantly reduced the problem of data rate limit due to pulse stretching along with the optical resolving power limit
Fig 1. Second harmonic power (top) and Conversion efficiencies (bottom) Vs fundamental power at fundamental wavelength of 1532 nm for different nonlinear coefficients.
Input Channels λ1, …….., λn EDFA
λ1 Resonant
λ1…… λn
Holey Fiber L= 6cm
λ1/2
λ2 Resonant
DM1 Si Detector
De – muxed Channel - 1
Fig 2. This sketch illustrates how SHG can effectively generate frequency doubling for optical DWDM networks: Si-detector can provide system cost advantage over InP detectors by detecting 775nm instead of 1550nm
IJMOT-2006-6-99 © ISRAMT 2006
585
INTERNATIONAL JOURNAL OF MICROWAVE AND OPTICAL TECHNOLOGY VOL. 1, NO. 2, AUGUST 2006
III. DIGITAL SIGNAL PROCESSIONG ON A CHIP The OPM device with silicon detector arrays and high speed electronics were designed based on the number of elements necessary to meet channel-count requirements and optical resolution. The pixel pitch used was between 25 and 250 microns depending on the array input optics. The main packaging consists of a detector chip on a ceramic sub-mount for possible integration with other networking devices, a glass-window hermetic package for easy handling and simple integration. Flip-chip back-illuminated arrays were used here to avoid wire-bond clearance. A thermoelectric cooler within the package was incorporated for the lowest possible dark current and highest stability response. Using an optical tap made on a photonic crystal fiber, a small amount of light (less than 3 %) passed through a tunable optical filter was tapped. The output of the filter is detected by a silicon photodiode that measures the signal power over the wavelength band sampled by the filter. The sampled value is further filtered by the Digital Signal Processor (DSP) unit. An advanced de-convolution signalprocessing algorithm to extract data from the photo detector has been developed. The firmware developed for the DSP handles signal processing to extract data from the photodetector, and also performs real-time control for filter positioning. The following are the list of optical parameters candidates to be measured to perform the OPM functions. OSNR is derived from making measurements of BER as a function of “threshold” near the upper and lower rails. In the initial measurement, the vertical cross-section of the eye-pattern, where the horizontal axes gives the received Optical/Electric-converted power in mV and the vertical axes gives the chance of detection of a certain power. By using a Gauss fit-procedure, the positions of the peaks (µ1 and µ0) and standard deviations (σ1 and σ0) of the peaks can be determined. The Qfactor can then be calculated using equation (2):
Q=
µ1 − µ 0 σ1 + σ 0
(2)
The Q-factor depends on the difference of levels between the “0” and the “1” and on the noise on the bit-pattern. So for a high Q-factor the discrimination of the “0” and “1” is better than for a low Q-factor. Figure 3 shows the eye diagram and histogram detected by a Si APD and displayed on digital scope.
Fig 3. Histogram of the eye diagram of the 2.5 Gb/s pseudorandom signal detected by Si APD (a Q parameter of 6.8 was obtained for this experiment)
IV. CONCLUSION The application of second harmonic generation using holey fibers in an all optical DWDM networks had been used for optical performance monitoring taking advantage of low cost silicon avalanche photodiodes and high speed digital signal processing electronics in CMOS technology. Using electronic sampling all necessary monitoring parameters can be provided which allows systems vendors to guarantee various levels of quality services. Initial experimental measurements are very promising and we plan to follow with more detailed results. A low cost performance monitoring tool fabricated in CMOS allows optical transparency as well as wider deployment of all optical networks.
IJMOT-2006-6-99 © ISRAMT 2006
586
INTERNATIONAL JOURNAL OF MICROWAVE AND OPTICAL TECHNOLOGY VOL.1, NO.2, AUGUST 2006
REFERENCES [1]
[2] [3]
[4]
D. Kong, “2.488 Gb/s SONET multiplexer/demultiplexer with frame detection capability,” IEEE J. Sel. Areas Commun. Vol. 9, pp. 726-731, June 1991. W. Yang, “Sensitivity issues of optical performance monitoring,” IEEE Photon. Technol. Lett. Vol. 14, pp. 107-109, Jan 2002. M. B. Tayahi, S. Lanka, J. Wang, T. Enderlein, S. Franke and S. Sukanta, “Optical performance monitoring using a poled lithium-niobate (PPLNO3)”, Proceedings of S.P.I.E, Vol. 6103, Feb. 2006. S. K. Shin, K. J. Park, and Y. C. Chung, “A novel
optical signal-to-noise ratio monitoring technique for WDM networks,” OSA Trends in Optics and Photonics (TOPS), Vol. 54, pp. 182184, 2000 [5]
[6]
O. Leclerc, P. Brindel, D. Rouvillain, B. Dany, E. Pincemin, E. Desurvire, C. Duchet, A. Shen, F. Blache, F. Devaux, A. Coquelin, M. Goix, S. Bouchoule, and P. Nouchi, “Dense WDM (0.27bit./s/Hz) 4×40Gbit/s dispersion-managed transmission over 10000 km with in- line optical regeneration by channel pairs,” Electron. Lett. Vol. 36, pp. 337-338, Feb. 2000. V. Pruneri, G. Bonfrate, P. G. Kazansky, D. J. Richardson, N. G. Broderick and J. P. De Sandro, “Greater than 20% - efficient frequency doubling 0f 1532-nm nanosecond pulsesin quasi-phasematched germanosilicate optical fibers”, Optics Letters, Vol. 24, pp. 208-210, Feb. 1999.
IJMOT-2006-6-99 © ISRAMT 2006