is simple, low cost and efficient in monitoring fiber fault in ONU. FTTH based ... INTRODUCTION. Passive Optical Network (PON) monitoring is ... downtime.
Journal of Computer Science 8 (6): 1001-1007, 2012 ISSN 1549-3636 © 2012 Science Publications
Optical System Monitoring Based on Reflection Spectrum of Fiber Bragg Grating 1
Mohammad Syuhaimi Ab-Rahman, Nani Fadzlina Naim, 1Mastang Tanra and 1Harry Ramza 1 Spectrum Technology Research Group (SPECTECH), Department of Electrical, Electronic and System Engineering, Faculty of Engineering and Built Environment, Universiti Kebangsaan Malaysia, 43600 UKM Bangi, Selangor, Malaysia 2 Faculty of Electrical Engineering, Universiti Teknologi MARA, 40000 Shah Alam, Selangor, Malaysia 1,2
Abstract: Problem statement: This study presents fiber fault monitoring approaches for Fiber-to-the Home (FTTH) with a Passive Optical Network (PON). Current fiber fault monitoring approaches are difficult to be implemented due to its complexity and high loss as the amount of branches increase. Approach: A fiber fault monitoring scheme is proposed whereas Fiber Bragg Grating (FBG) is placed on each branch of the Optical Network Unit (ONU). The advantages of the scheme are that it is simple, low cost and efficient in monitoring fiber fault in ONU. FTTH based network design is simulated using Optisystemtem 8.0 in order to investigate the feasibility of the proposed scheme. Results: The reflection spectrum of Fiber Bragg Gratings (FBGs) with different spectrum shape, frequencies and amplitude is used to differentiate each optical network. The simulation result shows that the unique characteristic of fiber Bragg grating is able to distinguish each optical network for a 20 km Passive Optical Network (PON) system. Conclusion: This study suggests the implementation of Fiber Bragg Grating that is placed in each network instead of using Optical Time Domain Reflectometer (OTDR) for fiber fault monitoring. Key words: Fiber Bragg Grating (FBG), Fiber-to-the Home (FTTH), Passive Optical Network (PON) INTRODUCTION Passive Optical Network (PON) monitoring is very important in order to reduce the operational expense. For Wavelength Division Multiplexing (WDM)-PON, the reliability might be more critical as the aim is to transport high capacity services. A conventional Optical Time Domain Reflectometer (OTDR) which operates at single wavelength is not able to detect branches beyond the wavelength selective component of the Remote Node (RN) of a WDM-PON (Yuksel et al., 2008). A lot of fiber fault locations have been conducted for branched optical fibers of PONs (Sankawa et al., 1990; Tanaka et al., 1996; Caviglia et al., 1999; Schmuck et al., 2006; Mulder et al., 2007). The Multiwavelength OTDR method uses a costly arrayed waveguide grating to assign an individual testing wavelength to each branched fiber (Tanaka et al.,
1996). A monitoring method that embeds the OTDR functions in each ONT has also been conducted (Schmuck et al., 2006). A technique that is proposed by (Mulder et al., 2007) cannot transmit a measured OTDR trace when the optical network has a fault. Passive Optical Network (PON) has been recognized as the best design to implement FTTH system due to optimal fiber infrastructure and exclusively passive components involved in the transmission line (Lee et al., 2006). Challenges in monitoring fault and the health of fiber optics has been actively discussed among experts (Lee et al., 2006; Chen et al., 2007; Yuksel et al., 2008), but most of the research introduced a black fiber monitoring system or applying OTDR as the hub of monitoring method (Yuksel et al., 2008). However, monitoring black fiber will not reflect the real flow of optical signal traffics in the system and if needed so, it will cause service downtime.
Corresponding Author: Mohammad Syuhaimi Ab-Rahman, Spectrum Technology Reseach Group (SPECTECH), Department of Electrical, Electronics and System Engineering, Faculty of Engineering and Built Environmental,
Universiti Kebangsaan Malaysia, 43600 UKM Bangi, Selangor, Malaysia
1001
J. Computer Sci., 8 (6): 1001-1007, 2012 Several researchers have studied on various types A restoration scheme in the working line at the of monitoring system in the PON. Several solutions for drop region for FTTH with PON has been presented in different type of PON monitoring were suggested. (Ab-Rahman et al., 2012). However the technique is WDM-PON implements optical reflector (Hann et al., difficult to be implemented due to its complexity and 2006), reusing existing light sources (Lim et al., 2005) difficulties to determine any breakdown that may occur and commercializing multiwavelengths signal all with in the PON. the application of an OTDR. It has been discussed that In this study, a simple and robust method to detect by introducing optical power splitter in PON, the spatial optical fiber cut in Passive Optical Network (PON) has information regarding the position of fiber fault might been proposed. The unique reflection spectrum from be lost in the transmission (Li et al., 2006). This Fiber Bragg Grating (FBG) that is located in each problem is one of the problems of fiber monitoring Optical Network Unit (ONU) is manipulated in order to system using OTDR architecture. detect the fault network. Numerous physical layer monitoring solutions based on OTDR have been proposed in (Caviglia et Theory: The main device in this monitoring system is al., 1999). However, realization of OTDR into treethe Fiber Bragg Grating (FBG). FBG consists of a structured PONs causes several disadvantages such as periodic modulation of the refractive index in the core lack of dynamic range to observe the equipments after of a single-mode optical fiber. The unique reflection the splitter, lengthy measurement time to achieve signal spectrum of FBG will distinguish the Optical suitable OTDR trace and repetition of the Network Unit (ONU). The simplest fiber Bragg grating measurement on various ONTs and the reflection of consists of a periodic modulation of the refractive index the dead zone that makes it impractical to distinguish in the core of single-mode optical fiber. The Bragg the monitoring signal from two similar-length grating condition satisfies both energy and momentum branches (Yuksel et al., 2008). conservation. The first order Bragg condition is simplified as below Eq. 1: Monitoring solutions based on Optical Frequency Domain Reflectometry (OFDR) lately appeared as an (1) λ B = 2n eff Λ alternative approach (Zou et al., 2007; Effenberger and Meng, 2008). These solutions require either a very coherent laser source to reach sufficient measurement where the Bragg grating wavelength, λB is the free ranges (Zou et al., 2007) or some complex modulation space wavelength of the input light that will be backschemes superimposed on the downstream data signal reflected from the Bragg grating. Neff is the effective (Effenberger and Meng, 2008). refractive index of the fiber core at the Freespace center A recent monitoring strategy based on wavelength. Λ is the grating spacing of the FBG. In interferometric devices placed at the ONTs relaxes the this project, the grating spacing is varied in order to requirement on the linewidth of the light source (Lee et manipulate the reflection spectrum. For a uniform FBG, al., 2008). However, this solution detects only the the index of refraction profile is as follows Eq. 2: breaks in the network. As an option approach, a test signal by way of a self-injection-locked reflective 2πz n(z) = n o + ∆n cos (2) Semiconductor Optical Amplifier (SOA) located at each Λ ONU was proposed (Thollabandi et al., 2009). This method, however, requires a protocol extension, thus is Where: not directly applicable to all PON protocols. no = The average refractive index Ab-Rahman et al. (2009) has demonstrated a ∆n = The amplitude of the induced refractive index design for fiber monitoring in the FTTH system. perturbation However, this technique requires a complex embedded z = The distance along the fiber longitudinal axis system with Ethernet connectivity. The use of electronic components such as a microcontroller to Using the coupled mode theory, the reflection of a control the optical switch may also lead to bottleneck grating with constant modulation amplitude and period issues. A design of FTTH monitoring based on Zigbee is given by Eq. 3: Wireless Sensor Network has also been presented in (Mastang et al., 2011). However, the implementation of Ω 2 sinh 2 (sl) active components in the design is less preferred due to R(l, λ ) = 2 (3) ∆k sinh 2 (sl) + s 2 cosh 2 (sl) power efficiency. 1002
J. Computer Sci., 8 (6): 1001-1007, 2012 Where: R(l, λ) l Ω ∆k = k − k=
= The reflectivity = The grating length and wavelength, l and wavelength λ = The coupling coefficient π = The detuning wave vector λB
2πn o λ
= The propagation constant and s2 = Ω2∆k
2
Ω for a sinusoidal variation of index perturbation along the fiber axis is Eq. 4: Ω=
π∆n Mp λ
(4)
where, Mp is the fraction of fiber mode power contained in the fiber core. Mp can be approximately by 1-V−2 where V is the normalized frequency of the fiber. V = (2π λ)a(n co 2 − n cl 2 )1/ 2 where ‘a’ is the core radius, nco, nc1 the core and cladding indices, respectively. At the Bragg grating center wavelength, there is no detuning and ∆k = 0; the expression for the reflectivity becomes Eq. 5: R = tanh 2 (Ωℓ)
(5)
The general expression for the approximate fullwidth-half maximum bandwidth of a grating is given by Eq. 6: ∆n 2 1 2 ∆λ = λ Bs + 2n o N
(6)
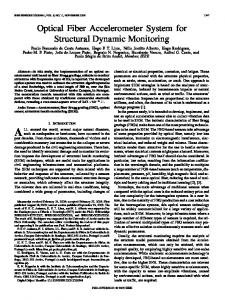
where, N is the number of the grating plane. The parameters ~1 for strong gratings (with near 100% reflection) while s ~0. 5 for weak gratings (Othonos and Kalli, 1999). In this project, the values of the grating period vary in order of the Bragg grating center wavelength and its amplitude. MATERIALS AND METHODS In the design of the overall system, the project starts by designing the Fiber Bragg Grating (FBG) using IFO_Grating simulation software. For each network, a unique FBG is designed. For this project, the grating period of the FBG varies in order to produce a unique FBG. This FBG is used in the overall system as shown in Fig. 1. The optical coding unit is actually the unique FBG that has been designed in IFO_Grating software. This FBG will be exported to Optisystem simulation software in order to implement the overall system as shown in Fig. 1.
Fig. 1: Block diagram of PON monitoring system in simulation 1003
J. Computer Sci., 8 (6): 1001-1007, 2012
Fig. 2: Block diagram of PON monitoring system in reality Figure 1 shows the block diagram of Passive Optical Network (PON) that is designed in Optisystem simulation software. The laser source used is the Distributed Feedback (DFB) laser. The wavelength of the downstream signals is 1490 and 1550 nm while the upstream signal is 1310 nm. The monitoring signal wavelength is 1625 nm. The optical link distance for this PON system is 20 km. The downstream signals and the monitoring signal will pass through the 20 km optical fiber length. Using a splitter the signals will be separated to each Optical Network Unit (ONU). The optical coding unit consists of a Fiber Bragg Grating (FBG). Each ONU will have a unique FBG reflection signal to differentiate each network. Figure 2 shows the block diagram of the real PON monitoring system. In reality, the FBG consists of one input and one output. The reflected signal from the FBG will pass through the fiber optic line which carries the input signal. The unique reflected signal from each network will distinguish the network. In real application, only the Optical Spectrum Analyzer (OSA) is required to analyze the reflected signal from the FBG as shown in Fig. 2.
Fig. 3: Simulation of PON monitoring system
RESULTS AND DISCUSSION Fig. 4: Simulation of PON monitoring sub-system Figure 3 shows the simulation of the monitoring Then, this FBG is exported to Optisystem simulation system that has been developed. All the reflected software. In this simulation, the grating length of the signals from each network will be analyzed in Optical FBG is manipulated in order to obtain a unique Spectrum Analyzer_13. reflected signal from the FBG. Figure 4 shows the components in the subsystem. Figure 5 shows the result from OSA when there is There are 3 subsystems in this simulation, hence there 3 no cut in the optical network. This is the accumulated Optical Network Units (ONUs) that will be analyzed. reflected spectrum from the FBGs from each network. Each ONU will have a unique reflected signal from the The optical network is as shown in Fig. 3. FBG. The FBG is designed using IFO Grating software. 1004
J. Computer Sci., 8 (6): 1001-1007, 2012
Fig. 5: Result from Optical Spectrum Analyzer (OSA) which shows that there is no fiber cut in the PON system
Fig. 7: Result from Optical Spectrum Analyzer (OSA) which shows that there is a fiber cut in Optical Network Unit 2 (ONU 2)
Fig. 8: Result from Optical Spectrum Analyzer (OSA) which shows that there is a fiber cut in Optical Network Unit 3 (ONU 3) Fig. 6: Result from Optical Spectrum Analyzer (OSA) which shows that there is a fiber cut in Optical Network Unit 1 (ONU 1)
It can be seen that there is no signal in Fig. 7 in the circle. That indicates that there is a cut in ONU 2. As a comparison of Fig. 5 and 7, the unique spectrum shape of ONU 2 is located at wavelength ranges from 1.6255Figure 6 shows the result when there is a cut in 1.6257 µm with the highest reflection power of 1 ONU 1. In order to detect the cut, one can compare the attowatt at 1.62564 µm. result in Fig. 5 with Fig. 6. It can be seen that there is Figure 8 shows the result when there is a cut in no signal in Fig. 6 in the circle. That indicates that there ONU 3. As a comparison result for Fig. 5 and 8, it can be is a cut in ONU 1. As a comparison of Fig. 5 and 6, the seen that there is no signal in Figure 8 in the circle. That unique spectrum shape of ONU 1 is located at indicates that there is a cut in ONU 3. As a comparison wavelength ranges from 1.6243-1.6246 µm with the of Fig. 5 and 8, the unique spectrum shape of ONU 3 is highest reflection power of 4 attowatt at 1.62458 µm. located at wavelength ranges from 1.62507-1.62521 µm Figure 7 shows the result when there is a cut in ONU with the highest reflection power of 5 attowatt at 1.62508 2. Based on comparison with Fig. 5 and 7, the status of the µm. The overall result for all the conditions that has been explained earlier is as shown in Fig. 9. cable connected to the ONU 2 can be determined. 1005
J. Computer Sci., 8 (6): 1001-1007, 2012
(a)
(b)
(c)
(d)
Fig. 9: Result from the Optical Spectrum Analyzer for 4 cases; (a) when there is no fiber cut (b) when there is a cut at ONU 1 (c) when there is a cut at ONU 2 (d) when there is a cut at ONU 3 CONCLUSION
and for ONU 3, the unique spectrum shape is located at wavelength ranges from 1.62507-1.62521 µm with the highest reflection power of 5 attowatt at 1.62508 µm.
As a conclusion, a simple and efficient method has been successfully demonstrated in order to monitor fiber fault in Passive Optical Network (PON). The REFERENCES unique reflection spectrum of the fiber Bragg grating is manipulated in order to distinguish the optical network. Ab-Rahman, M.S., M. Saupe, A. Premadi and K. The unique spectrum shape of ONU 1 is located at Jumari, 2009. Embedded Ethernet microcontroller wavelength ranges from 1.6243-1.6246 µm with the for optical monitoring. Proceedings of the highest reflection power of 4 attowatt at 1.62458 µm. International Conference on Space Science and For ONU 2, the unique spectrum shape 2 is located Communication, Oct. 26-27, IEEE Xplore Press, at wavelength ranges from 1.6255-1.6257 µm with the Negeri Sembilan, pp: 51-55. DOI: highest reflection power of 1 attowatt at 1.62564 µm 10.1109/ICONSPACE.2009.5352672 1006
J. Computer Sci., 8 (6): 1001-1007, 2012 Ab-Rahman, M.S., S.A.C. Aziz and K. Jumari, 2012. Linear protection schemes analysis in scattered placement fiber-to-the home-passive optical network using customer access protection unit solution. J. Comput. Sci., 8: 41-47. DOI: 10.3844/jcssp. 2012.41.47 Caviglia, F., V.C.D. Biase and A. Gnazzo, 1999. Optical maintenance in PONs. Opt. Fiber Technol., 5: 329-362. DOI: 10.1006/ofte.1999.0302 Chen, W., B.D. Mulder, J. Vandewege, X. Qiu and J. Bauwelinck et al., 2007. A novel technique for low-cost embedded non-intrusive fiber monitoring of P2MP optical access networks. Proceedings of the Optical Fiber Communication Conference and Exposition and the National Fiber Optic Engineers Conference, Mar. 25-25, OSA, Anaheim, California, pp: 1-3. Effenberger, F.J. and S. Meng, 2008. In-band optical frequency domain Reflectometry in PONs. Proceedings of the Optical Fiber Communication Conference and Exposition and The National Fiber Optic Engineers Conference, Feb. 24-24, OSA Technical Digest (CD), San Diego, California, pp: 1-3. Hann, S., J.S. Yoo and C.S. Park, 2006. Monitoring Technique for a Hybrid PS/WDM-PON by using a Tunable OTDR and FBGs. Meas. Sci. Technol., 17: 1070-1070. DOI: 10.1088/0957-0233/17/5/S22 Lee, C.H., W.V. Sorin and B.Y. Kim, 2006. Fiber to the Home using a PON Infrastructure. J. Lightwave Technol., 24: 4568-4583. Lee, S.L., S.T. Ji and C.H. Cheng, 2008. Novel fault monitoring scheme for PON systems using wavelength sweeper and interferometric devices. Proceedings of the Joint Conference of the OptoElectronics and Communications Conference, Jul. 7-10, IEEE Xplore Press, Sydney, pp: 1-2. DOI: 10.1109/OECCACOFT.2008.4610431 Li, Y., D. Wang and J. Li, 2006. FITH remote fiber monitoring using Optical Wavelength Domain Retlectometry (OWDR) and Wavelength Coded Tag (WCT). Proceedings of the Optical Fiber Communication Conference and National Fiber Optic Engineers Conference, (NFOEC’ 06), pp: 1-5. Lim, K.W., E.S. Son, K.H. Han and Y.C. Chung, 2005. Fault localization in the WDM passive optical network by reusing downstream light sources. IEEE Photonics Technol. Lett., 17: 2691-2693. DOI: 10.1109/LPT.2005.859178
Mastang, M., M.S. Ab-Rahman, K. Mat and K. Jumari, 2011. Design of a FTTH monitoring system based on Zigbee wireless sensor network. Proceedings of the 2011 IEEE Symposium on Business, Engineering and Industrial Applications, Sept. 2528, IEEE Xplore Press, Langkawi, pp: 243-246. DOI: 10.1109/ISBEIA.2011.6088814 Mulder, B.D., W. Chen, J. Bauwelinck, J. Vandewege and X.Z. Qiu, 2007. Nonintrusive fiber monitoring of TDM optical networks. J. Light. Technol., 25: 305-317. DOI: 10.1109/JLT.2006.887184 Othonos, A. and K. Kalli, 1999. Fiber Bragg Gratings: Fundamentals and Applications in Telecommunications and Sensing. 1st Edn., Artech House Inc., Boston, Mass., ISBN-10: 0890063443, pp: 422. Sankawa, I., S. Furukawa, Y. Koyamada and H. Izumita, 1990. Fault location technique for inservice branched optical fiber networks. IEEE Photon. Technol. Lett., 2: 766-768. DOI: 10.1109/68.60785 Schmuck, H., J. Hehmann, M. Straub and T. Pfeiffer, 2006. Embedded OTDR techniques for costefficient fiber monitoring in optical access networks. Proceedings of the European Conference on on Optical Communications, Sept. 24-28, IEEE Xplore Press, Cannes, France, pp: 1-2. DOI: 10.1109/ECOC.2006.4800887 Tanaka, K., M. Tateda and Y. Inoue, 1996. Measuring the individual attenuation distribution of passive branched optical networks. IEEE Photon. Technol. Lett., 8: 915-917. DOI: 10.1109/68.502269 Thollabandi, M., H. Bang, K.W. Shim, S. Hann and C.S. Park, 2009. An optical surveillance technique based on cavity mode analysis of SL-RSOA for GPON. Opt. Fiber Technol., 15: 451-455. DOI: 10.1016/j.yofte.2009.08.002 Yuksel, K., V. Moeyaert, M. Wuipart and P. Megret, 2008. Optical layer monitoring in Passive Optical Networks (PONs): A review. Proceedings of the 10th Anniversary International Conference on Transparent Optical Networks, Jun. 22-26, IEEE Xplore Press, Athens, 92-98. DOI: 10.1109/ICTON.2008.4598379 Zou, N., Y. Namihira, C. Ndiaye and H. Ito, 2007. Fault location for branched optical fiber networks based on OFDR technique using FSF lasers as light source. Proceedings of the Optical Fiber Communication and the National Fiber Optic Engineers Conference, Mar. 25-29, IEEE Xplore Press, Anaheim, CA., pp: 1-3. DOI: 10.1109/OFC.2007.4348539
1007