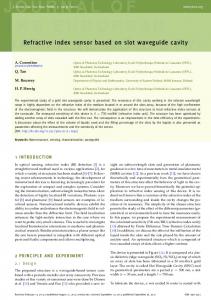
International Scholarly Research Network ISRN Spectroscopy Volume 2012, Article ID 606317, 6 pages doi:10.5402/2012/606317
Research Article Optical Waveguide BTX Gas Sensor Based on Yttrium-Doped Lithium Iron Phosphate Thin Film Patima Nizamidin,1 Abliz Yimit,1 Ismayil Nurulla,1 and Kiminori Itoh2 1 College
of Chemistry and Chemical Engineering, Xinjiang University, Urumqi 830046, China School of Environment and Information Sciences, Yokohama National University, Yokohama 240-8501, Japan
2 Graduate
Correspondence should be addressed to Abliz Yimit,
[email protected] Received 27 August 2012; Accepted 17 September 2012 Academic Editors: J. Kasperczyk and I. Miloˇsev Copyright © 2012 Patima Nizamidin et al. This is an open access article distributed under the Creative Commons Attribution License, which permits unrestricted use, distribution, and reproduction in any medium, provided the original work is properly cited. Yttrium-doped LiFePO4 powder was synthesized using the hydrothermal method in one step and was used as a sensing material. An optical waveguide (OWG) sensor based on Yttrium-doped LiFePO4 has been developed by spin coating a thin film of LiFe0.99 Y0.01 PO4 onto a single-mode Tin-diffused glass optical waveguide. Light was coupled into and out of glass OWG employed by a pair of prisms. The guided wave transmits in waveguide layer and passes through the film as an evanescent wave. The sensing film is stable in air, but when exposed to target gas at room temperature, its optical properties such as transmittance (T) and refractive index (nf ) were changed; thus, the transmitted light intensity was changed. The LiFe0.99 Y0.01 PO4 thin film OWG exhibits reversible response to xylene gas in the range of 0.1–1000 ppm. When the concentration of BTX gases was lower than 1ppm, other substances caused a little interference with the detection of xylene vapor. Compared to pure LiFePO4 thin film OWG, this sensor exhibited higher sensitivity to BTXs.
1. Introduction Benzene, toluene, and xylene (BTX) are volatile organic compounds (VOCs) of great social and environmental significance, are widely used in industry, and can present serious medical, environmental, and explosion dangers [1]. BTX is also classified as a human carcinogen and is a risk factor for leukemia and lymphomas. The regulated standard concentration of benzene is 1.0 ppb (3 μg/m3 ) in Japan. The guidelines for the upper indoor concentration limits of toluene and xylene are 70 ppb (260 μg/m3 ) and 200 ppb (870 μg/m3 ), respectively [2]. Because of BTX’s acute toxicities, there has been an increasing need for highly sensitive, rapidly responding, portable devices for monitoring trace levels of them in various environmental and industrial applications. Many works have been done on sensitivity to BTX such as electric noses [3, 4], chromatography [5], and electrochemical sensor [6], and these detectors are accurate, yet bulky and expensive, and require higher operating temperature. In comparison, the optical waveguide (OWG) sensors [7–9] are small in size, of high sensitivity, of fast response time,
monitored at room temperature, and of intrinsically safe detection. Furthermore, they suffer little or no interference in the waveguide element of the sensor and can be made at a very low cost. A simple planar OWG consists of a substrate, a thin top layer (waveguide layer) with a refractive index greater than that of the substrate and the covering material (usually air) [8]. Single-mode Tin-diffused glass waveguide has a high mechanical strength and a low loss (−0.3 dB/cm) [10]. A quite smooth surface of Tin-diffused glass waveguides suppresses the surface roughness of the middle and top layers and thereby reduces the scattering of the resulting device. Tin-diffused glass waveguides proved to be stable up to 550◦ C. Lithium iron phosphate (LiFePO4 ) with the olivine structure has attracted great interest as the cathode material in rechargeable lithium-ion batteries because of its high energy density, low cost, low toxicity, excellent thermal stability, and safety [11–13]. So far, lots of reports about experimental study of LiFePO4 to improve its electrochemical properties through doping other elements [14, 15] and
2
ISRN Spectroscopy Flow meter Recorder
Laser sources Gas inter
Reflector Gas out
Gas in Prism out
Prism in
Flow cell Air
Glass substrate Photomultiplier detector
Evanescent wave
Sensitive layer Waveguide layer (1-2 μm depth)
Figure 1: Schematic view of optical waveguide (OWG) sensor system.
preparing LiFePO4 thin film electrodes [16], and its sensing applications such as lithium Ion sensor, have appeared [17]. According to our survey, no gas sensor that has based on LiFePO4 and LiFe0.99 Y0.01 PO4 thin film has been reported. In this paper, we describe the fabrication of the LiFe0.99 Y0.01 PO4 film/Tin-diffused glass optical waveguide sensor, and we use this OWG sensor system which successfully detected 0.1 ppm (100 ppb) of xylene gas as an example of BTX.
2. Experimental Section 2.1. Preparation of LiFe0.99 Y0.01 PO4 Powder. LiFe0.99 Y0.01 PO4 was synthesized by hydrothermal methods [18]. FeSO4 ·7H2 O (analytically pure), 85 wt% of H3 PO4 (analytically pure), and LiOH·H2 O (analytically pure) in the molar ratio 1 : 1 : 3 were mixed. Then were added ascorbic acid and Y (NO3 )3 ·6H2 O [x(Y) : 1-x (LiFePO4 )], respectively [15]. After that, this mixed solution was put into hydrothermal reactor (inner volume: 100 cm3 ). The hydrothermal process was performed at 150◦ C for 15 h. The mixture was allowed to cool down to room temperature, was filtered, and the product was collected and dried under vacuum at 120◦ C for 1 h. The powder X-ray diffraction (XRD) and the energy dispersion spectra (EDS) were used to characterize the LiFe0.99 Y0.01 PO4 powder. 2.2. Fabrication of LiFe0.99 Y0.01 PO4 Thin Film. After the enormous experimental process, the best way of fabrication of sensing film was chosen. The LiFe0.99 Y0.01 PO4 film was prepared by sol-gel deposition methods as described in the following way: (1) 0.05 g of LiFe0.99 Y0.01 PO4 powder was dissolved in 10 cm3 of mixed acid (1.3 wt% of phosphate acid and 5 wt% of ascorbic acid), and then 1 cm3 (1 wt%)
of polyvinyl alcohol (PVA) solution and a drop of surface activator (sodium dodecyl benzene sulfonate) were added. (2) LiFe0.99 Y0.01 PO4 solution was coated onto the surface of Tin-diffused glass OWG (n = 1.52, with the depth of 12 μm of guided layer) by spin coater at 1000 rpm for 25 s. (3) The coated film was calcinated under vacuum at 150◦ C for 30 min. 2.3. BTX Gases Testing. The BTX gases testing apparatus (Figure 1) was contained in compressed air sources, a flow meter, reflector, laser sources, gas mixing manifold that contained BTX gases, LiFe0.99 Y0.01 PO4 film/Tin-diffused glass OWG gas sensing element, photomultiplier detector, and recorder (PC). A gas mixing manifold was used to mix the air stream that contained BTX gases with a stream of pure air and to introduce the mixture into the flow cell, which enclosed the waveguide sensor. The flow cell (2 cm × 1 cm × 1 cm) was mounted on a rotational stage equipped with X-Y-Z translation. The semiconductor laser beam (650 nm) was introduced into the OWG using a prism coupler (glass prism, n = 1.78; a matching liquid, diiodomethane, n = 1.74), and it emerged from another prism coupler. The distance between the two prism couplers was 15 mm. The intensity of the output light was monitored by using a photomultiplier detector, and the output light intensity was recorded by a computer. In every measurement, a new syringe was applied to inject 20 cm3 of the xylene gas sample into the flow chamber and then out from the vent (Figure 1). Pure air functioned as a carrier, and dilution gas flowed through the cell at a constant rate of 32 cm3 /min in order to transfer the xylene gas to the sensor. All measurements were made at room temperature. Standard xylene gas was obtained by vaporizing a given amount of 99.5% xylene liquid inside a 600 cm3 standard
3 P O
Element
(A)
O
P
30
50
Y
Totals 100
Fe
Fe (B)
Fe
(043)
(241) (061) (133)
(202) (151)(113) (240) (222)
(112)
40
(132) (221)
(131)
(211) (140) (102)(221) (041)
(031)
(111)
(121)
(011)
20
Fe
Weight (%) 43.99 19.09 35.04 1.88 Y
(120) (101)
1600 1500 1400 1300 1200 1100 1000 800 900 700 600 500 400 300 200 100 0
(020)
Intensity (a.u.)
ISRN Spectroscopy
0
60
1
2
3
4
5
6
7
8
9
10
11
E (keV)
2θ (deg)
Figure 3: EDS of LiFe0.99 Y0.01 PO4 powder.
Figure 2: X-ray diffraction patterns of LiFe0.99 Y0.01 PO4 powder prepared by hydrothermal method (A) and JCPDS nos. 40–1,499 LiFePO4 (B).
16000
3. Results and Discussion 3.1. Characterization of LiFe0.99 Y0.01 PO4 Powder. Figure 2 shows the X-ray diffraction profiles of the Y-doped LiFePO4 . LiFePO4 with an olivine structure was obtained by hydrothermal method, and the diffraction peaks of the Y were not observed because of the low Y content of 1 wt%. All diffraction peaks follow its standard crystal structure patterns (JCPDS nos. 40–1,499 LiFePO4 ) [11]. Their diffraction peaks suggest that side products or impurities were not significantly present in the samples. The EDS result of Figure 3 unambiguously confirms that the particles in the Y-doped LiFePO4 included Fe, P, and O components with a trace of Y. 3.2. The Sensing Layer. In OWG sensor, the sensing film’s refractive index, thickness, and attenuation are major factors that affect its sensitivity. We have found that the LiFe0.99 Y0.01 PO4 film refractive index and thickness for the OWG BTX gas sensor were 1.899 and 104 nm, respectively. The cutoff thickness for the TE0 mode in a thin film waveguide on glass substrate and sensitivity of thin film OWG were calculated with Runge-Kutta method [9], and the results are as shown in Figure 4. The theoretical calculation indicated that when a LiFe0.99 Y0.01 PO4 film of a 100–120 nm thickness was coated onto the surface of the Tin-diffused glass, the resulting OWG was capable of supporting a TE0 mode-guided wave, and the relative sensitivity reached its maximum limit of 12809–13988 times/cm (n = 1.899). In this experiment, the relative sensitivity of the LiFe0.99 Y0.01 PO4 film OWG of a 104 nm thickness
Sensitivity (times/cm)
14000
vessel. The concentration of the xylene gas was confirmed by a commercial xylene gas detection tube (Gastec). Different amounts of standard xylene gas were diluted to obtain the desired concentrations with pure air in a second standard vessel (600 cm3 ). Using this standard vessel dilution method, very low concentrations of xylene (in the ppm range) were obtained.
12000 10000 8000 6000 4000
n f = 1.899
2000
ns = 1.525
0
70 80 90 100 110 120 130 140 150 160 170 180 190 200 Film thickness (nm)
Figure 4: Relationship between film thickness and relative sensitivity (n = 1.899, λ = 650 nm).
was 13294 times/cm. The LiFe0.99 Y0.01 PO4 thin film attenuation was measured using cut-back method [19]; it was found that LiFe0.99 Y0.01 PO4 film has lower attenuation with 0.49 dB/mm. These results are providing evidence for the preparation of the LiFe0.99 Y0.01 PO4 film/Tin-diffused glass OWG device. The LiFe0.99 Y0.01 PO4 film/Tin-diffused glass OWG was fixed in the gas testing system as shown in Figure 1 and detected various BTXs. The response of the thin film OWG sensor to various BTXs was shown in Figure 5. The testing result indicates that when the sample gas was injected into the flow chamber, there is physical adsorption between sample gas and sensing film. In the presence of benzene, toluene, chlorobenzene, or xylene, the sensor exhibited a higher response to xylene, and the response to acetone, formaldehyde, or alcohol vapor was small. This is because xylene has greater molar refractive index, and it exhibited higher absorption performance [20]. 3.3. Sensing Principle. In the optical waveguide sensor, the transmitted light intensity (output light intensity) was
ISRN Spectroscopy 1150 1100 1050 1000 950 900 850 800 750 700 650
Xylene
Toluene
Chlorobenzene
Benzene
Formaldehyde Acetone Ethanol Methanol
Air Benzene
2800
2900
3000
3100
3200
3300
3400
3500
Time (s)
Transmittance (T%)
Output light intensity (a.u.)
4
Figure 5: Response stereogram of OWG sensor to various gases of the same concentration (1000 ppm).
related to adsorption coefficient, refractive index, and sensing film thickness [21]
After exposed to xylene vapor
Before exposed to xylene vapor
450
500
550
600
650
700
750
800
Wavelength (nm)
Figure 6: Transmittance change of the LiFe0.99 Y0.01 PO4 film, when it is exposed to xylene gas.
(1)
where I is the transmitted light intensity (output light), I0 is the input light intensity, a is absorption coefficient, N is the reflectance number of guided wave on the surface of optical waveguide in the distance L (N = L/2dtgθγ , d is the depth of waveguide), and de is the actual path length of light in the sensing film (de = 2d f / cos θγ , d f is the thickness of sensing film). In this case, when sensing film’s absorption coefficient and refractive index were decreased, the transmitted light was increased. The LiFe0.99 Y0.01 PO4 film coated on the glass slide was exposed to xylene gas, and the transmittance and refractive index of this film were monitored. Transmittance was performed using an ultraviolet spectrophotometer (UV2450 Japan). When the xylene steam was not injected into the experimental environment, the LiFe0.99 Y0.01 PO4 film’s transmittance (Figure 6) was over 99.3% (400–800 nm). In the presence of xylene steam, the transmittance increased (0.03–0.08%). The refractive index was tested by ellipsometer (Tianjin SGC-10). When the xylene steam was not injected into the experimental environment, the LiFe0.99 Y0.01 PO4 film’s refractive index was 1.899. While xylene steam was present, the refractive index decreased to 1.895. Thus, an increase of output light intensity was anticipated. 3.4. Testing Results. The typical responses of the thin film OWG sensor to various concentrations of xylene gas were shown in Figure 7. As can be seen from the figure, when the xylene gas was injected into the flow chamber, the transmittance of the sensing film was increased (Figure 6), and in the meantime, the refractive index of sensing film was decreased. Thus, the testing baseline (output light intensity) steadily increased. When the xylene gas was exited, the sensor response exhibited total recovery with a return to its original baseline. The response and recovery times of the planar OWG xylene sensor were not faster than 5 s and 65 s, respectively. The recovery time of the sensor was longer than its response time because of the low velocity of the dry air inflow, and thus, a longer period was required for a sufficient amount of air to reach the film in the flow chamber.
1300 Output light intensity (a.u.)
I = I0 (1 − aNde ),
100 99.95 99.9 99.85 99.8 99.75 99.7 99.65 99.6 99.55 99.5 99.45 99.4 99.35 99.3 400
1200
1000 ppm Xylene out
1000 ppm
1100 1000
100 ppm 10 ppm
900 800 700
100 ppm 10 ppm
1 ppm
1 ppm 0.1 ppm
0.1 ppm Air Xylene in
600 3900
4100
4300
4500
4700
4900
5100
5300
Time (s)
Figure 7: Typical responses of LiFe0.99 Y0.01 PO4 film/Tin-diffused glass OWG sensor, when it is exposed to xylene gas in air.
The increases in the signal (output light intensity), annotated as α = 10 log (Ixylene /Iair ), were 1.8, 1.16, 0.9, 0.56, and 0.22 dB, corresponding to 1000, 100, 10, 1, and 0.1 parts of xylene gas per 106 (ppm) of standard atmosphere. The values of the relative standard deviation (RSD) were in the range of ±1.1 ∼ ±7.3%. When the sensor was exposed to 0.1 ppm of xylene gas, the increase in the output light intensity (signal) was 1.5 times greater than the noise level. This explained that if this OWG sensor was to be exposed to xylene vapor below 0.1 ppm, it would still demonstrate a relative response. 3.5. Selectivity. The selectivity of this OWG sensor to BTX at 1000 ppm, 100 ppm, and 10 ppm was measured (Figure 8). At 10 ppm, the sensor’s response to xylene vapor was nine times greater than to acetone, ethanol, and methanol vapor, six times greater than to formaldehyde vapor, four times greater than to benzene and chlorobenzene vapors, and about two times greater than to toluene gas. The responses to ethanol, methanol, acetone, formaldehyde, benzene, and chlorobenzene are all negligible. When the concentration of BTX gas was 10 ppm, the increase in output light
ISRN Spectroscopy
5
4. Conclusion A low-cost planar OWG sensor for measuring xylene gas has been developed. The detection limits of this device were measured under the operating conditions as described above. The xylene minimum detection limit is as low as 0.1 ppm reversibly, and with a short response time (less than 5 s). This sensor can detect lower than 10 ppm of BTX with good selectivity, when the concentration of BTX gases was lower than 1 ppm; other substances caused no interference with the detection of xylene vapor. After Y doped, the LiFePO4 OWG sensor exhibited higher sensitivity to BTXs.
2 1.8 1.6 1.4 1.2 1 a 0.8 0.6 0.4 0.2 0
e len Xy uene e n l To enze ene b n o e z ne lor B ceto nol e A tha yd Ch E ldeh nol a a rm eth Fo M
1000
Acknowledgment
100
) pm p (
10
Cs VO
The authors would like to acknowledge the National Natural Science Foundation of China for the support of this project under 20965008 Grants.
Methanol
Formaldehyde
Ethanol
Acetone
Benzene
Toluene
Chlorobenzene
a
2 1.8 1.6 1.4 1.2 1 0.8 0.6 0.4 0.2 0
Xylene
Figure 8: Response of OWG sensor to various organic compounds at the concentration of 1000 ppm, 100 ppm, and 10 ppm, respectively.
VOCS
LiFe0.99 Y0.01 PO4 thin film OWG LiFePO4 thin film OWG
Figure 9: Selectivity of LiFePO4 and LiFe0.99 Y0.01 PO4 film OWG (1000 ppm).
intensity (α) was 0.9 for xylene, and 0.5 for toluene. While concentration of xylene gas decreased from 10 ppm to 1 ppm, Δα = 0.34, and then to 0.1 ppm, Δα = 0.68. From this, we can get that the concentration of BTX was below 1 ppm, and other substances caused no interference with the detection of xylene vapor. The experimental results presented in Figure 9 depict that, after Y doped, the LiFePO4 thin film OWG exhibited higher response to BTXs than undoped, in particular, for xylene gas has the highest response. From that, we can get that, after Y doped, the LiFePO4 thin film OWG’s gas sensing properties were improved.
References [1] S. V. Patel, T. E. Mlsna, B. Fruhberger, E. Klaassen, S. Cemalovic, and D. R. Baselt, “Chemicapacitive microsensors for volatile organic compound detection,” Sensors and Actuators B, vol. 96, no. 3, pp. 541–553, 2003. [2] Y. Ueno, T. Horiuchi, O. Niwa, H. S. Zhou, T. Yamada, and I. Honma, “Portable automatic BTX measurement system with microfluidic device using mesoporous silicate adsorbent with nano-sized pores,” Sensors and Actuators B, vol. 95, no. 1–3, pp. 282–286, 2003. [3] F. R¨ock, N. Barsan, and U. Weimar, “Electronic nosescurrent status and future trends,” Chemical Reviews, vol. 108, no. 2, pp. 705–725, 2008. [4] C. P. Melo, B. B. Neto, E. G. Lima, L. F. B. Lir, and J. E. G. Souza, “Use of conducting polypyrrole blends as gas sensors,” Sensors and Actuators B, vol. 109, pp. 348–354, 2005. [5] J. M. Juarez-Galan and I. Valor, “New universal, portable and cryogenic sampler for time weighted average monitoring of H2S, NH3, benzene, toluene, ethylbenzene, xylenes and dimethylethylamine,” Journal of Chromatography A, vol. 1216, no. 15, pp. 3003–3011, 2009. [6] C. Sun, X. Su, F. Xiao, C. Niu, and J. Wang, “Synthesis of nearly monodisperse Co3 O4 nanocubes via a microwaveassisted solvothermal process and their gas sensing properties,” Sensors and Actuators B, vol. 157, no. 2, pp. 681–685, 2011. [7] H. Ablat, A. Yimit, M. Mahmut, and K. Itoh, “Nation film/K+ exchanged glass optical waveguide sensor for BTX detection,” Analytical Chemistry, vol. 80, no. 20, pp. 7678–7683, 2008. [8] A. Yimit, A. G. Rossberg, T. Amemiya, and K. Itoh, “Thin film composite optical waveguides for sensor applications: a review,” Talanta, vol. 65, no. 5, pp. 1102–1109, 2005. [9] A. Yimit, K. Itoh, and M. Murabayashi, “Detection of ammonia in the ppt range based on a composite optical waveguide pH sensor,” Sensors and Actuators B, vol. 88, no. 3, pp. 239– 245, 2003. [10] Z. M. Qi, I. Honma, and H. Zhou, “Chemical gas sensor application of open-pore mesoporous thin films based on integrated optical polarimetric interferometry,” Analytical Chemistry, vol. 78, no. 4, pp. 1034–1041, 2006. [11] Y. D. Cho, G. T. K. Fey, and H. M. Kao, “Physical and electrochemical properties of La-doped LiFePO4 /C composites as
6
[12]
[13]
[14]
[15]
[16]
[17]
[18]
[19] [20] [21]
ISRN Spectroscopy cathode materials for lithium-ion batteries,” Journal of Solid State Electrochemistry, vol. 12, no. 7-8, pp. 815–823, 2008. C. S. Li and S. Y. Zhang, “Porous LiFePO4 /NiP composite nanospheres as the cathode materials in rechargeable lithium ion batteries,” Journal of Nanoparticle Research, vol. 1, pp. 242– 248, 2008. K. Zaghib, A. Mauger, F. Gendron, and C. M. Julien, “Relationship between local structure and electrochemical performance of LiFePO4 in Li-ion batteries,” Ionics, vol. 14, no. 4, pp. 271– 278, 2008. C. Legrand, L. Dupont, K. Tang, H. Li, X. J. Huang, and E. Baudrin, “Structural and textural characterization of LiFePO4 thin films prepared by pulsed laser deposition on Si substrates,” Thin Solid Films, vol. 518, no. 19, pp. 5447–5451, 2010. K. S. Park, J. T. Son, H. T. Chung et al., “Surface modification by silver coating for improving electrochemical properties of LiFePO4 ,” Solid State Communications, vol. 129, no. 5, pp. 311– 314, 2004. H. Liu and J. Xie, “Synthesis and characterization of LiFe0.9 Mg0.1 PO4 /nano-carbon webs composite cathode,” Journal of Materials Processing Technology, vol. 209, no. 1, pp. 477– 481, 2009. F. Sauvage, J. M. Tarascon, and E. Baudrin, “Insights into the potentiometric response behaviour vs. Li+ of LiFePO4 thin films in aqueous medium,” Analytica Chimica Acta, vol. 622, no. 1-2, pp. 163–168, 2008. D. G. Zhuang, X. B. Zhao, G. S. Cao, C. H. Mi, J. Tu, and J. P. Tu, “Morphology and reaction mechanism of LiFePO4 prepared by hydrothermal synthesis,” Chinese Journal of Nonferrous Metals, vol. 15, no. 12, pp. 2034–2039, 2005. H. Nishihara, M. Haruna, and T. Suhara, Integrated Optics, Science Press, Beijing, China, 1st edition, 2004. S. Kondo, T. Ishikawa, and I. Abe, Adsorb Science, Chemical Industry Press, Beijing, China, 1st edition, 2006. Z. Gui Lv and L. Xue Jin, “Optical waveguide gas sensor,” Chinese Journal of Instrument Technique and Sensor, vol. 5, pp. 17–19, 1990.
International Journal of
Medicinal Chemistry Hindawi Publishing Corporation http://www.hindawi.com
Volume 2014
Photoenergy International Journal of
Organic Chemistry International Hindawi Publishing Corporation http://www.hindawi.com
Volume 2014
Hindawi Publishing Corporation http://www.hindawi.com
Volume 2014
International Journal of
Analytical Chemistry Hindawi Publishing Corporation http://www.hindawi.com
Volume 2014
Advances in
Physical Chemistry Hindawi Publishing Corporation http://www.hindawi.com
Volume 2014
International Journal of
Carbohydrate Chemistry Hindawi Publishing Corporation http://www.hindawi.com
Journal of
Quantum Chemistry Hindawi Publishing Corporation http://www.hindawi.com
Volume 2014
Volume 2014
Submit your manuscripts at http://www.hindawi.com Journal of
The Scientific World Journal Hindawi Publishing Corporation http://www.hindawi.com
Journal of
International Journal of
Inorganic Chemistry Volume 2014
Journal of
Theoretical Chemistry
Hindawi Publishing Corporation http://www.hindawi.com
Hindawi Publishing Corporation http://www.hindawi.com
Volume 2014
Spectroscopy Hindawi Publishing Corporation http://www.hindawi.com
Analytical Methods in Chemistry
Volume 2014
Hindawi Publishing Corporation http://www.hindawi.com
Volume 2014
Chromatography Research International Hindawi Publishing Corporation http://www.hindawi.com
Volume 2014
International Journal of
Electrochemistry Hindawi Publishing Corporation http://www.hindawi.com
Volume 2014
Journal of
Hindawi Publishing Corporation http://www.hindawi.com
Volume 2014
Journal of
Catalysts Hindawi Publishing Corporation http://www.hindawi.com
Journal of
Applied Chemistry
Hindawi Publishing Corporation http://www.hindawi.com
Bioinorganic Chemistry and Applications Hindawi Publishing Corporation http://www.hindawi.com
Volume 2014
International Journal of
Chemistry Volume 2014
Volume 2014
Spectroscopy Volume 2014
Hindawi Publishing Corporation http://www.hindawi.com
Volume 2014