including Content Delivery Networks (CDNs), caches, proxies, etc. Also, HTTP is ... the performance of BRAS clients in best-effort networks. Neither is any of the ...
Optimal Adaptation Trajectories for Block-Request Adaptive Video Streaming Konstantin Miller∗ , Nicola Corda† , Savvas Argyropoulos† , Alexander Raake† and Adam Wolisz∗ ∗ Technische
Universit¨at Berlin, Germany Email: {konstantin.miller, adam.wolisz}@tu-berlin.de † Telekom Innovation Laboratories (T-Labs), Berlin, Germany Email: {nicola.corda, savvas.argyropoulos, alexander.raake}@telekom.de Abstract—Block-Request Adaptive Streaming (BRAS), in form of its most prominent representative HTTP-Based Adaptive Streaming (HAS), is about to become the dominating technology for video delivery over the Internet. One of the challenges in the development of BRAS clients is the design of mechanisms that dynamically adapt the streamed video quality to network conditions, in order to maximize user’s Quality of Experience (QoE). The main contribution of this paper is an approach to calculating optimal adaptation trajectories. This approach not only allows to benchmark the performance of any streaming client, it also provides the possibility to study the impact of the networking environment, and of configuration parameters such as the start-up delay, number of available video representations, etc., on the achievable streaming performance. Since, to the best of our knowledge, there exist no widely accepted or standard approach to measure QoE for BRAS, we alternatively maximize the average video bit-rate, minimize the number of quality switches, and impose a hard constraint on the absence of rebuffering events. Further, we evaluate two HAS clients, Microsoft SmoothStreaming and our own streaming client that supports the recently adopted HAS standard Dynamic Adaptive Streaming over HTTP (DASH), in an indoor Wireless Local Area Network (WLAN) emulated with a high degree of precision. We compare their performance with the optimal client, and explore the configuration parameter space of the DASH client. Finally, we evaluate the impact of start-up delays and number of available video representations on achievable streaming performance.
I. I NTRODUCTION Recently, video streaming has become one of the biggest sources of traffic on the Internet [1]. Fast home broadband connections, connected TV sets, and the spread of WiFi/3G/4Genabled mobile terminals are among the key drivers/enablers for its growing popularity. In addition to faster connections, technological improvements in video coding and video delivery have made it possible for more users to watch video content online. Due to the extreme heterogeneity of end-user devices and types of network connections, it is not possible to use the same representation of a video for each streaming session. It must be adapted to capabilities of the device, such as processing power and display properties, and to network conditions such as available bandwidth, latency, jitter, and packet loss rate on network path(s) from the content source(s) to the video client. Moreover, it is not sufficient to perform the configuration once
for each streaming session. A user might, e.g., experience continuous throughput fluctuations ranging from tens of kilobits to tens of megabits per second. This effect is especially visible in the more and more deployed case of wirelessly connected users. Even in an indoor residential or office WLAN, the static user is typically exposed to interference, cross-traffic, and fading effects. The link quality fluctuations are even stronger in the case of mobile users. Thus, it is necessary to continuously adapt the representation of the video in order to achieve a satisfactory QoE. Recently, HAS, a variant of BRAS, has become one of the dominating technologies for adaptive video streaming. With BRAS, the video is segmented in chunks of several seconds duration, and each segment is available at the content source(s) in several representations, each representation providing a different encoding bit-rate. Further, each segment starts with a random access point of the stream, thus allowing a video client to concatenate segments from different representations during the playback. With HAS, a video client issues HTTP GET or GET RANGE requests to download individual segments. The meta information about available segments and representations is downloaded by the client prior to starting the streaming session in form of an XML file, called Manifest or Media Presentation Description (MPD) file. One of the benefits of HAS is that it is leveraging on the ubiquitous and highly optimized HTTP delivery infrastructure, including Content Delivery Networks (CDNs), caches, proxies, etc. Also, HTTP is usually allowed to traverse Network Address Translation (NAT) devices and firewalls, in contrast to other application layer protocols. Further, HAS has good scalability properties since the streaming logic resides within the client, thus relieving the server from keeping extensive state, performing adaptation tasks, etc. Another important feature of HTTP is its deployment on top of the Transmission Control Protocol (TCP). From the point of view of adaptive streaming, this carries both advantages and disadvantages. On the one hand, TCP offers built-in congestion control and congestion avoidance mechanisms, that are necessary to maintain the stability of the network, as well as to ensure some sort of fairness of resource allocation among competing flows. It also offers reliable communication by means of retransmitting lost packets, which enables usage of efficient video compression technologies that are particularly
sensitive to packet losses (the loss of an I-frame may result in several seconds of corrupted playback). On the other hand, retransmission of lost packets results in delaying further packets, which makes TCP less suitable for low-delay streaming. Further, TCP reacts to packet losses and to sporadic transmission delay peaks by reducing its sending rate, unnecessarily degrading the QoE of a streaming session. Finally, the complex dynamics of TCP make throughput estimation and prediction, which are essential for fast and robust adaptation of video quality, more challenging. Currently, there are several popular commercial implementations of the HAS technology, including Microsoft SmoothStreaming (MSS), Adobe Dynamic Streaming (ADS), Apple HTTP Live Streaming (HLS), as well as a number of developments reported in the research literature. Despite the growing attention from the research community, however, there exist several open issues. One of them involves the methodology for performance evaluation of streaming clients. In a typical performance evaluation, we either compare an approach to some predefined requirements, or we measure its gain w.r.t. some state-of-theart solutions, or we compare its performance to the maximum performance that can be achieved in a certain setting. There exist, however, no widely accepted benchmarks to measure the performance of BRAS clients in best-effort networks. Neither is any of the existing clients widely accepted as a basis for performance comparison. Finally, little has been done on developing approaches to calculating optimal performance of a BRAS client in a given setting. Such an approach, however, would not only allow to benchmark the performance of any streaming client, it would also allow to study the impact of the networking environment and of configuration parameters such as the start-up delay, number of available video representations, etc., on the streaming performance. The first contribution of this paper addresses this issue by presenting an approach to calculate optimal adaptation trajectories, given the complete information on the throughput process (that is, the amount of data that can be downloaded until time t, for each t). This approach can be used in three different ways. First, we can calculate an optimal trajectory for a throughput process that was recorded by a streaming client during a streaming session. In many cases, however, streaming clients introduce delays between subsequent requests so that we no longer can calculate an optimal trajectory from the recorded throughput since we do not know which throughput the client could have achieved during the gaps. Thus, instead of using a trace recorded by a streaming client, we might use a trace recorded by a continuous TCP flow under the same network conditions. Finally, optimal trajectories can be calculated for artificial throughput processes in order to study the impact their features have on the optimal performance. As a second contribution, we evaluate two HAS clients: Microsoft SmoothStreaming and our own streaming client supporting the recently adopted HAS standard DASH. Due to the immense heterogeneity of possible deployment scenarios for video streaming clients, it is challenging to perform a
solid performance evaluation, since it would require various test runs in very different networking environments. Wireless networks, however, are among the most challenging environments for streaming. In addition to cross-traffic, the throughput in, e.g., a WLAN is impacted by fading effects, packet losses, Media Access Control (MAC) layer retransmissions, etc. The usage of TCP as transport protocol makes the resulting network dynamics even more complex. Thus, we selected for the evaluation an indoor WLAN cell, which we emulated with a high degree of precision. We compare the trajectories of the two clients with the optimum and explore the parameter space of our DASH client w.r.t. its performance in wireless networks. The structure of the paper is as follows. In Section II, we review the related work. In Section III, we present the optimization metric that we use and our approach to calculating optimal adaptation trajectories. In Section IV, we briefly present the two streaming clients used for performance evaluation. Section V presents the setting and the results of the evaluation. Finally, Section VI concludes the paper. II. R ELATED WORK An approach to calculating optimal adaptation trajectories using a Markov decision process is presented by Jarnikov et al. [2]. With this approach, an optimal strategy is calculated for a given distribution function of segment download times. The objective function is a linear function giving constant penalty to playback interruptions and changes of video quality, and a reward proportional to the selected video quality. The authors perform a numerical evaluation of the approach using fixed, uniform and normal distributions of the available bandwidth. A potential limitation of this approach is that temporal correlation of segment download times is not considered. Several studies present designs of heuristic adaptation strategies. They are usually accompanied by more or less extensive evaluations that, however, sometimes exhibit one or several of the following deficiencies. Simulations and emulations are sometimes too simplified, e.g., TCP and/or MAC layer behavior is not modeled. In many cases, no cross-traffic is present, throughput fluctuations are achieved by piecewise continuous throughput limitations using traffic control tools like tc or DummyNet. Another common drawback is an oversimplified evaluation metric, such as, e.g., the total re-buffering time, without taking into account the average video bit-rate, the total number of quality switches, or the duration of the start-up delay. Tappayuthpijarn et al. [3] presented an adaptation heuristic based on a prediction of layer 2 throughput in an Long-Term Evolution (LTE) cell. The heuristic is evaluated by comparison with non-adaptive streaming in an emulated LTE cell with 8 concurrent clients. Zhou et al. [4] present an adaptation logic based on a proportional derivative (PD) controller. Evensen et al. [5] investigate mechanisms that allow to aggregate bandwidth over multiple network interfaces in heterogeneous networks.
M¨uller et al. [6] evaluated the MSS, ADS, HLS, and their own DASH clients in an emulated environment using three application-layer traces recorded from a 3G connection while driving on the freeway. The metrics were: (i) average bit-rate during the streaming session, (i) number of quality switches, and (iii) time spent in re-buffering. Akhshabi et al. [7] experimentally evaluated the MSS, ADS, and the Netflix HAS clients. The authors focus on three aspects: reaction to persistent or short-term throughput changes, the ability of two players to properly operate on a shared network path, and if the player is able to sustain a short playback delay and thus perform well with live content. The authors identified significant inefficiencies in each of the studied players. Recently, performance and fairness issues with multiple streaming clients competing for bottleneck bandwidth moved into the focus of the research community. Several studies specifically look into client design aspects affecting such settings. Jiang et al. [8] argue that the throughput estimation component is crucial for the behavior of a streaming client and compares 4 estimators, of which harmonic mean turns out to perform best. The study also show that random instead of fixed delays between subsequent requests improve performance when multiple clients compete for bottleneck bandwidth. Huang et al. [9] also analyze the impact, bandwidth estimation techniques have on the behavior of streaming clients. Further work is presented by Liu et al. [10], and Tian et al. [11]. Studies that investigate QoE models for adaptive streaming include Cranley et al. [12], Ninassi et al. [13], and Seufert et al. [14]. III. O PTIMAL CLIENT In this section, we present the optimization metric that we use, and our approach to calculating optimal adaptation trajectories. The main challenge in designing efficient adaptation strategies is that path throughput is a random process, whose value is difficult to reliably predict for the relevant time horizon, ranging from several seconds to several tens of seconds. (We use the term ”throughput process” to denote the total amount of data V (t) received by a client during the time [0, t].) The question that we answer in this section is how to calculate an optimal trajectory having perfect knowledge of V (t). In order to address this question, we first need to select an appropriate optimization objective. Main factors that influence QoE include (i) duration and distribution of frozen frames, (ii) properties of the adaptation trajectory, such as minimum bit-rate, average bit-rate, frequency and magnitude of bit-rate switches, and (iii) start-up delay. To the best of our knowledge, there exist no widely accepted or standard QoE metric, which quantifies human perception of all these factors together. Therefore, we use the following objectives and constraints for optimization of adaptation trajectories.
We use start-up delay as an independent variable, that is, an optimal trajectory is calculated for a given start-up delay. Further, we impose a hard constraint on the absence of buffer underruns, meaning that an optimal trajectory is not allowed to have buffer underruns. As for optimization objective, we first maximize the average video bit-rate over the duration of the streaming session. This maximization in general results in a space of optimal solutions that are potentially prone to frequent video quality fluctuations. Therefore, we subsequently minimize the number of quality switches. We will use the following notation. We denote by SMPD the size of the MPD file. We denote by R the set of available representations, by n the number of segments in the video, and by τ the duration of the segments. (We assume the same duration for all segments but the approach also works for segments of different durations.) Further, we denote by Si,j the size of segment i from representation j. Obviously, the earliest time when the playback can start is when the MPD file and the first segment of the representation with the lowest bit-rate are downloaded. We denote this time by TE . (A client does not always have to download the first segment in the lowest representation. Still, given a throughput process V (t), TE is always well-defined, and will be used in the following as a reference.) We define TS to be the time from the start of the download (t = 0) until the playback is started. It must hold TS ≥ TE . The important value for optimization, however, is not TS but the time between the earliest possible time when the playback can start and the actual start of playback, T˜S = TS − TE , which we define as the start-up delay. The reason is that the time TE cannot be influenced by the client, while T˜S is a configurable parameter of the client’s adaptation strategy. The resulting playback deadlines for the individual segments are given by Di = TS + (i − 1) · τ . The maximum amount of data a video player can download until the playback deadline of segment i is thus given by V (Di ). In order to formulate the optimization problem, we denote by xij ∈ {0, 1} the optimization variables stating if the client downloads segment i from representation j or not. In the following, we first maximize the average video bit-rate (which is equivalent to maximization of the total amount of data downloaded by the video client), demanding the absence of buffer underruns. We obtain the following optimization problem. (OP1) max s.t.
n � m � i=1 j=1 m �
Sij xij
xij ≥ 1
(1) for all i = 1, . . . , n
j=1
(2) k � m �
Sij xij ≤ V (Dk ) for all k = 1, . . . , n
i=1 j=1
(3)
Here, constraint (2) ensures that each segment is downloaded from at least one representation, while constraint (3) ensures that each segment is downloaded before its playback deadline. Note that constraint (3) implicitly accounts for the configured start-up delay (included in the definition of playback deadlines Di ). Problem OP1 has in general a space of optimal solutions that are more or less prone to video quality fluctuations. Unnecessary quality switches, however, significantly impact the QoE. Therefore, we subsequently solve the following optimization problem OP2 in oder to select the optimum solution of OP1 that has the minimum number of quality switches. We denote by V ∗ the optimal objective value of problem OP1. (OP2) min s.t.
n−1 m 1 �� (xij − xi+1,j )2 2 i=1 j=1 m �
xij ≥ 1
(4) for all i = 1, . . . , n
j=1
(5) k � m �
Sij xij ≤ V (Dk )
for all k = 1, . . . , n
i=1 j=1
(6) n � m �
Sij xij ≥ V ∗
(7)
i=1 j=1
While constraints (5) and (6) are the same as constraints (2) and (3) in OP1, constraint (7) ensures that the minimization of the new objective function (4) (total number of quality switches) does not result in a sub-optimal value for the average video bit-rate. The problem OP1 is known as a Multiple-Choice Nested Knapsack Problem (MCNKP) [15], [16]. More precisely, it is a special case, where the values of the items and the weights of the items are equal. (This variant of the Knapsack Problem is sometimes referred to as the Subset Sum Problem.) MCNKP is NP-hard but there exist pseudo-polynomial time algorithms. Problem OP2 is a Quadratic MCNKP. We solve both problems with the software Gurobi [17]. IV. S TREAMING CLIENTS In the following we briefly present the two HAS clients we selected for performance evaluation in wireless networks.
subsequent requests are delayed in order not to let the buffer level rise. If, however, the throughput is high enough, no delays are introduced, the buffer level rises above βmax , and the video quality is decreased until the buffer level starts to decrease again. The throughput is averaged over the last Δt seconds. In order to avoid buffer underruns by all means, if the buffer level falls below a configurable critical threshold βcrit , the lowest video quality is selected immediately. An extra start-up phase provides a fast ramp-up of the video quality to the available throughput. The operation of the algorithm is similar to a PID controller with hysteresis and some additional tweaks. It takes into account the current throughput, its fluctuations, as well as the buffer level, which can be interpreted as the integrated mismatch between the throughput and the video bit-rate. Further, instead of a target buffer level, it has a target interval. In total, the algorithm offers 10 parameters that can be tuned to optimize its behavior. They control its sensitivity to bandwidth fluctuations, speed of convergence, efficiency of bandwidth utilization, and the probability of buffer underruns. See Miller et al. [18] for more details. B. Microsoft SmoothStreaming client The MSS streaming solution is supported by most major Internet browsers and is deployed by several popular video on demand websites. The MSS client was used in several studies on BRAS client behavior and was found to outperform several competing approaches. Since the implementation of MSS is closed, the exact operation of its adaptation logic is not known. However, several aspects of its behavior could be observed in different studies and also in our own experiments. MSS client uses a fixed segment duration of 2 seconds. It typically starts to request the first segment from the lowest representation. It then switches between the representations step by step in a smooth manner in order to avoid abrupt changes of quality that might impact QoE. Further, the quality is switched only when there is a certain probability that the throughput can sustain the new video bit-rate. The MSS client version we used (Silverlight 5.1.20125.0) seems to maintain a target buffer level of approximately 30 seconds. Its operation can be split in two phases, buffering and steady-state. In the buffering phase, the player will request the segments as fast as possible to fill the buffer. In the steadystate phase, the segments are requested every 2 seconds. V. E VALUATION
A. DASH client The details on the adaptation logic of our DASH client are provided in [18]. A prototype has been implemented as a plugin for the VLC player [19]. In short, the adaptation logic tries to maintain the buffer level within a certain target interval [βmin , βmax ]. If the buffer level is below βmin , the video quality is increased step by step, until the buffer level starts to rise. If the buffer is above the middle of the target interval 0.5 · (βmin + βmax ) but the throughput is too low to switch to the next representation,
In this section, we present the setting and the results of the performance evaluation of the two selected HAS clients and the optimum behavior, in a WLAN. A. Setting For the evaluation we emulate a typical Internet path starting in an IEEE 802.11a WLAN in an indoor environment. We use a site-specific model by Al-Bado et al. [20], implemented in the NS-3 [21] network simulator. The emulated part of
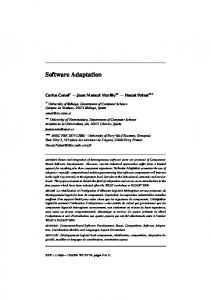
Fig. 1. Evaluation setup. Clients and servers are interconnected via an emulated IEEE 802.11a cell that is based on a site-specific model of the Berlin Open Wireless Lab (BOWL) testbed [20].
the network is connected to PCs hosting client and server software via two gigabit Ethernet interfaces, as shown in Figure 1. The model consists of eight nodes and each of the possible 56 unidirectional links is modeled separately. We use seven nodes as stations and one as the access point. To give an impression of the link qualities, a TCP transfer of 100MB of data between the access point and each individual station achieves an average throughput of approximately (in [Mbps]): 1.4, 1.7, 19, 19, 21, 21, 21. (These values refer to TCP throughput of individual links in the absence of crosstraffic.) The one-way delays on the emulated links connecting the stations and the access points with Ethernet interfaces of the emulation host were set to a constant value of 1 ms. The video traffic was always routed via the station with the second lowest maximum throughput of 1.7 Mbps. In addition to the video traffic, we generated synthetic background traffic mimicking the behavior of 14 HTTP clients, based on the stochastic model from Pries at al. [22]. Each of the wireless stations carried traffic of two such clients. The video sequence that we used was Big Buck Bunny [23]. We encoded the raw video data in 6 and 14 representations, distributing the target representation bit-rates logarithmically between 100 kbps and 5 Mbps. We set the Group of Pictures (GOP) size to 2 seconds, which is the maximum allowed for MSS. The encoded data was split into segments and two manifest files were generated, one for DASH and one for MSS. We assured that the differences in segment sizes between DASH and MSS was small enough to be negligible. It constituted on average 0.17% and was bounded from above by 1.34%. The distribution of segment sizes is illustrated in Figure 2. The sequence is slightly longer than 596 seconds so we obtained 298 full segments and one short segment, which we omitted. Note that bit-rate fluctuations across segments of the same representation may significantly affect the performance of the streaming client. Depending on the format of the manifest file, the client might not know the actual segment bit-rate (and thus
Fig. 2. Video bit-rate variation: mean, minimum, maximum (the latter two are shown as percentage of the mean). Mean video bit-rates were configured to be logarithmically distributed between 100 kbps and 5 Mbps. (Note the logarithmic scale of the y-axis.)
the segment size) in advance, but only the average bit-rate of the representation. Due to variable bit-rate encoding, however, the segment bit-rate may fluctuate by up to a factor of 10 and more. Our dataset was encoded such as to keep these fluctuations small and thus they are bounded by 95% of the mean, as shown in Figure 2. In order to have a fair comparison, we padded the DASH manifest file with random characters to make it of the same size as the joint size of the three files that need to be downloaded by the MSS client: the Hypertext Markup Language (HTML) file, the Silverlight Application Package (XAP) file and the manifest file. In order to compare the performance of the MSS and the DASH clients to the optimum, we proceeded as follows. Each experiment with a video client was followed by an experiment under the same conditions, where the video client was replaced by a TCP flow lasting for the duration of the video sequence. The throughput process of the TCP flow was then used as input V (t) for optimization problems OP1 and OP2, to calculate optimal adaptation trajectories. We didn’t use the throughput process as recorded by the video client since it may be suboptimal, because video clients typically introduce gaps between subsequent requests in order to prevent their buffer level from exceeding a certain threshold. All experiments were repeated approximately 50 times. Confidence intervals in some of the figures are omitted to improve readability.
B. Experiment 1 In this experiment we evaluate two metrics. First, we study the increase of optimal performance if we allow the client a start-up delay (T˜S ) of up to 60 seconds before starting the playback. Second, we vary the number of representations from 6 to 14. The results are plotted in Figure 3. The top figure depicts the increase of the average video bit-rate of optimal trajectories depending on the start-up delay, for two numbers of available video representations: 6 and 14. The bottom figure depicts the number of video quality switches. The confidence intervals are for a confidence level of 95%. We observe an initially perfectly linear dependency of the average video bit-rate on the start-up delay, followed by a saturation. Maybe somewhat surprisingly, the improvement from a start-up delay of 60 sec is only around 12%. Further, we observe no improvement from increasing the number of used representations from 6 to 14. The reason is that despite the high fluctuation of the wireless link throughput (fading plus cross-traffic), 6 representations are enough to utilize all the available bandwidth, as we will also see in experiment 2. Note that in real deployment scenarios, a high number of available video representations might be quite unrealistic, since it results in higher encoding and storage costs for content providers. In order to speed-up calculations when solving the optimization problem OP2, we allowed an absolute optimality tolerance gap of up to 5 (that is, the actual optimum might be even lower than the calculated value by at most 5). The average value for the gap in experiment 1 added up to 1.83. For 6 representations it was 1.51, for 14 representations it was 2.15, due to the higher computational complexity. Thus, the higher amount of quality switches for 14 representations might partially be explained by the inexact calculations. An important insight, however, is the remarkably small amount of switches required to achieve optimal performance despite of a highly fluctuating network throughput. C. Experiment 2 In this experiment, we compare the performance of the MSS client, and of the DASH client with different configurations, with optimal performance. In all configurations of the DASH client, the critical buffer threshold was set to βcrit = 2s. The lower threshold βmin of the target buffer interval varied between 5s and 20s. The size B of the target buffer interval also varied between 5s and 20s. Further, we varied the time period Δt for averaging past throughput from 5s to 10s. Other parameters were fixed to the following values: α1 = 0.75, α2 = 0.8, α2 = 0.8, α2 = 0.8, α2 = 0.9 (see [18] for details). Roughly speaking, the varied parameters influence the adaptation strategy in the following way. The lower threshold of the target buffer interval influences the average buffer level. Thus, low values increase the risk of buffer underruns but they increase the ”liveness” of the streaming session, which is important for transmission of live content. The size of the
Fig. 3. The figures illustrate the influence of the start-up delay and the number of available video representations on optimal trajectories. The top figure shows average video bit-rate, the bottom figure shows the number of representation switches.
target buffer interval influences the sensitivity to throughput fluctuations. Low values let the video client switch the video quality more often in order to more closely follow throughput fluctuations and thus increase the average video quality by better utilizing the available bandwidth. On the other hand, high values provide a more steady video quality. Δt has a similar impact on the sensitivity to throughput spikes, especially to positive ones, since the client uses average throughput from past Δt seconds in order to decide if an increase of video quality can be sustained by the network. The results are shown in Figure 4a. We observe that the DASH client always outperforms the MSS client w.r.t. the average video bit-rate (78% to 90% of the optimum vs. 62%). It also outperforms the MSS client w.r.t. the total duration of frozen frames, and, for some of the configurations, w.r.t. the number of quality switches. The evaluation suggests that good values for the configuration of the DASH client are: βmin = 10s, B = 20s, and Δt = 5s. Note that the optimal trajectory is able to almost perfectly utilize its fair share of the link capacity. Its average video bitrate almost equals the achievable TCP throughput on that link. Also note that the average number of switches required by the optimal trajectory is as low as approximately 2 (and, in fact, might be even lower due to the tolerance gap allowed in the optimization process). Another interesting observation is that the DASH client is able to achieve its performance with a lower average buffer level than the MSS client. For the configuration, where the
(a) Performance of a single video client sharing a wireless cell with HTTP background traffic.
(b) Performance of two video clients sharing a wireless cell with HTTP background traffic.
(c) Fairness among two video clients sharing a wireless cell with HTTP background traffic. Fig. 4. This figures compare the performance of the MPEG-DASH video client with different configurations and of the MSS client with optimal performance. Figure (a) shows the average video bit-rate, the number of switches, the total re-buffering time and the average buffer level for the individual clients when one client shares a wireless cell with HTTP background traffic. Figure (b) shows the performance metrics when two video clients share the wireless cell with each other and with HTTP background traffic. Shown values are averages over multiple runs and over the two clients. In contrast, figure (b) shows the difference among the two clients averaged over the individual runs in order to visualize fairness.
lower bound of the target interval is set to 5 seconds, the size of the buffer interval is set to 20 seconds and the throughput average is computed over the past 10 seconds, the DASH client achieves a high average bit-rate, a low re-buffering time and number of switches, with an average buffer level of approx. 17 seconds. By analyzing the individual adaptation trajectories of the DASH client we observe that some re-buffering events are caused by segments whose size exceeds the average segment size of the representation. Since the segment size of the individual segments is not known to the client before it issues the request, it might too late notice that it is not possible to download the segment before its playback deadline. A possible solution for this issue would be to retrieve the segment sizes with little overhead via HTTP HEAD requests prior to starting the streaming session or in parallel. D. Experiment 3 In this experiment, we added a second video client in addition to the setting used in experiment 2, in order to evaluate the adaptation strategies w.r.t. fairness. The traffic of the two clients were routed over the same wireless station. Figure 4b shows various performance metrics as Figure 4a did for the case of a single client, except that the values are now averages over the runs and over the two clients. In fact, we observe that the conclusions from experiment 2 still hold for the two clients setting. Figure 4c shows the differences w.r.t. the used metrics between the clients, averaged over the runs. We observe that optimal trajectories have almost perfect fairness since all values are approximately 0. Further, we observe that the fairness of our DASH client is comparable or better than that of the MSS client. VI. C ONCLUSION In order to provide a benchmark for evaluation of video streaming clients, we come up with two optimization problems that, given the complete knowledge of the throughput process and the maximum tolerated start-up delay, allow to determine an adaptation trajectory that maximizes average video bit-rate over the whole streaming session, minimizes the number of switches, and ensures the absence of buffer underruns. Further, we evaluated the behavior of the widely deployed MSS video streaming client and our own client supporting the recently adopted DASH standard in a WLAN, and compared their performance with the optimum. It turned out that our client is able to outperform the MSS client in the evaluated setting by achieving an average video bit-rate that is between 78% and 90% of the optimum, while MSS achieves approximately 62%, with less quality fluctuations, less time spent in re-buffering, comparable fairness when two clients share a bottleneck link, and a lower average buffer level, which is especially beneficial for live content. Future work includes a study of adaptation strategies that, based on short-term prediction of TCP throughput and subsequent solutions of presented optimization problems OP1 and
OP2 over small and medium time horizons, might increase the client’s performance towards the achievable optimum. It also includes performance evaluation under a broader spectrum of network conditions. R EFERENCES [1] “Cisco Visual Networking Index: Forecast and Methodology, 2012 2017,” Cisco, White Paper, 2013. ¨ ¸ elebi, “Client Intelligence for Adaptive Streaming [2] D. Jarnikov and T. Ozc Solutions,” Signal Processing: Image Communication, vol. 26, no. 7, pp. 378–389, Aug. 2011. [3] K. Tappayuthpijarn, T. Stockhammer, and E. Steinbach, “HTTP-Based Scalable Video Streaming Over Mobile Networks,” in Proc. of ICIP, Brussels, Belgium, 2011. [4] C. Zhou, X. Zhang, L. Huo, and Z. Guo, “A Control-Theoretic Approach to Rate Adaptation for Dynamic HTTP Streaming,” in Proc. of VCIP, San Diego, USA, 2012. [5] K. Evensen, D. Kaspar, C. Griwodz, P. Halvorsen, A. F. Hansen, and P. Engelstad, “Using Bandwidth Aggregation to Improve the Performance of Quality-Adaptive Streaming,” Signal Processing: Image Communication, vol. 27, no. 4, pp. 312–328, Apr. 2012. [6] C. M¨uller, S. Lederer, and C. Timmerer, “An Evaluation of Dynamic Adaptive Streaming Over HTTP in Vehicular Environments,” in Proc. of MoVid, New York, USA, 2012. [7] S. Akhshabi, A. C. Begen, and C. Dovrolis, “An experimental evaluation of rate-adaptation algorithms in adaptive streaming over HTTP,” in Proc. of MMSys, San Jose, USA, 2011. [8] J. Jiang, V. Sekar, and H. Zhang, “Improving Fairness, Efficiency, and Stability in HTTP-Based Adaptive Video Streaming with FESTIVE,” in Proc. of CoNEXT, New York, USA, 2012. [9] T.-Y. Huang, N. Handigol, B. Heller, N. McKeown, and R. Johari, “Confused, Timid, and Unstable: Picking a Video Streaming Rate is Hard,” in Proc. of IMC, Boston, USA, 2012. [10] C. Liu, I. Bouazizi, M. M. Hannuksela, and M. Gabbouj, “Rate Adaptation for Dynamic Adaptive Streaming over HTTP in Content Distribution Network,” Signal Processing: Image Communication, vol. 27, no. 4, pp. 288–311, Apr. 2012. [11] G. Tian and Y. Liu, “Towards Agile and Smooth Video Adaptation in Dynamic HTTP Streaming,” in Proc. of CoNEXT, New York, USA, 2012. [12] N. Cranley, P. Perry, and L. Murphy, “User Perception of Adapting Video Quality,” International Journal of Human-Computer Studies, vol. 64, no. 8, pp. 637–647, Aug. 2006. [13] A. Ninassi, O. Le Meur, P. Le Callet, and D. Barba, “Considering Temporal Variations of Spatial Visual Distortions in Video Quality Assessment,” IEEE J. Sel. Topics in Signal Processing, vol. 3, no. 2, pp. 253–265, Apr. 2009. [14] M. Seufert, M. Slanina, S. Egger, and M. Kottkamp, “To Pool or not to Pool: A Comparison of Temporal Pooling Methods for HTTP Adaptive Video Streaming,” in Proc. of QoMEX, Klagenfurt, Austria, 2013. [15] R. D. Armstrong, P. Sinha, and A. A. Zoltners, “The Multiple-Choice Nested Knapsack Model,” Management Science, vol. 28, no. 1, pp. 34– 43, 1982. [16] E. Y.-H. Lin, “A Biblographical Survey on Some Well-Known NonStandard Knapsack Problems,” INFOR, vol. 36, no. 4, pp. 274–317, 1998. [17] “Gurobi Optimizer.” [Online]. Available: http://gurobi.com [18] K. Miller, E. Quacchio, G. Gennari, and A. Wolisz, “Adaptation Algorithm for Adaptive Streaming over HTTP,” in Proc. of Packet Video Workshop, Munich, Germany, 2012. [19] “VLC multimedia player.” [Online]. Available: http://videolan.org/vlc/ [20] M. Al-Bado, C. Sengul, and R. Merz, “What Details Are Needed For Wireless Simulations? - A Study of a Site-Specific Indoor Wireless Model,” in Proc. of INFOCOM, 2012. [21] “NS-3 Network Simulator.” [Online]. Available: http://nsnam.org [22] R. Pries, Z. Magyari, and P. Tran-Gia, “An HTTP Web Traffic Model Based On the Top One Million Visited Web Pages,” in Proc. of NGI, Karlskrona, Sweden, 2012. [23] “Big Buck Bunny video sequence.” [Online]. Available: http://www.bigbuckbunny.org