Proceedings of the 2004 Winter Simulation Conference. R .G. Ingalls, M. D. ..... Step 3: Solve problem (4) by calling PROCEDURE II. Se- lect p designs 1. 2.
Proceedings of the 2004 Winter Simulation Conference R .G. Ingalls, M. D. Rossetti, J. S. Smith, and B. A. Peters, eds.
OPTIMAL COMPUTING BUDGET ALLOCATION FOR MULTI-OBJECTIVE SIMULATION MODELS
Loo Hay Lee Ek Peng Chew Suyan Teng
David Goldsman School of Industrial and Systems Engineering Georgia Institute of Technology Atlanta, GA 30332-0205, U.S.A.
Dept of Industrial and Systems Engineering National University of Singapore 10 Kent Ridge Crescent, 119260, SINGAPORE
Ranking and selection procedures are statistical methods specially developed to select the best system design or a subset that contains the best system design from a set of n competing alternatives (Goldsman and Nelson 1994). Several different approaches to the problem have been proposed. The difference mainly lies in how to allocate replications to certain designs. For instance, the commonly used two-stage indifference-zone procedure proposed by Rinott (1978) determines the number of additional simulation replications for each design based on the sample variances estimated from the first stage of sampling. This procedure is based on a least-favorable configuration formulation to allocate additional replications. Alternatively, an average case analysis can be used to allocate additional replications. This idea has engendered two distinct approaches, outlined below. Chen, Chen, and Dai (1996) and Chen et al. (1997) followed a Bayesian methodology, making use of information on both sample means and sample variances. The rational here is to only simulate likely competitors for the “best”, thus leading to significant improvement in computing effort in the simulation. Chick (1997) proposed Bayesian decision theoretic methods, which attempt to select an additional number of replications for each system so that the expected value of information gained from those replications is maximized, rather than using the thought experiment as in Chen, Chen, and Dai (1996) and Chen et al. (1997). Information gains for the probability of correct selection are measured with respect to the 0-1 loss function. Most of the studies in the ranking and selection area focus on a single measure of system performance, or put another way, the system is evaluated with respect to a single objective. However, most real-life systems and designs often have multiple objectives. For example, in productdesign optimization, the cost and the quality of products are two conflicting objectives. In evaluating airline flight schedules, we may want to select flight schedules in terms of minimal FTC (flight time credit) and minimal percentage of late arrivals (Tan 2003). In this setting, the problem
ABSTRACT Simulation plays a vital role in identifying the best system design from among a set of competing designs. To improve simulation efficiency, ranking and selection techniques are often used to determine the number of simulation replications required so that a pre-specified level of correct selection is guaranteed at a modest possible computational expense. As most real-life systems are multi-objective in nature, in this paper, we consider a multi-objective ranking and selection problem, where the system designs are evaluated in terms of more than one performance measure. We incorporate the concept of Pareto optimality into the ranking and selection scheme, and try to find all of the non-dominated designs rather than a single “best” one. A simple sequential solution method is proposed to allocate the simulation replications. Computational results show that the proposed algorithm is efficient in terms of the total number of replications needed to find the Pareto set. 1
INTRODUCTION
Simulation is commonly used to identify the best system design from among a set of proposed alternatives, where “best” is defined in terms of the maximum (or minimum) expected value of some function of the simulation output. However, since simulation can be both expensive and time consuming, efficiency is still a key concern in this area. Therefore, to evaluate the relative worth of the competing designs, ranking and selection techniques are often used to determine the number of simulation replications required for each design so that a pre-specified level of correct selection is guaranteed at the least possible computational expense. This area of research has gained popularity in simulation output analysis and optimization in the last decade. There are quite a number of review papers available in this field (Bechhofer, Santner, and Goldsman 1995; Goldsman and Nelson 1998; Swisher, Jacobson, and Yücesan 2003). 586
Lee, Chew, Teng, and Goldsman of selecting the best designs from a set of alternatives through simulation becomes a multi-objective ranking and selection (MORS) problem. One common way to address the MORS problem is to weight several parameters of interest to form a single measure of effectiveness by applying multiple attribute utility (MAU) theory (Butler, Morrice, and Mullarkey 2001; Morrice, Butler, and Mullarkey 1998; Swisher and Jacobson 2002). The problem reduces to a single-objective model, and existing methods can be applied. Dudewicz and Taneja (1978) proposed a multivariate procedure by defining a multivariate normal vector composed of c > 1 component variates with an unknown and unequal variance-covariance matrix. They redefine the indifference-zone parameter as the Euclidean distance from a mean vector to the best mean vector. In both approaches, the authors try to determine a single “best” solution. In the former (weighted parameter) approach, the decision maker not only needs to “cost out” performance in one criterion for performance in another, but he also needs to specify the relative importance of the performance measurers. As a result, the best solution selected would be strongly dependent on these preferences. In case another decision maker has different preferences with respect to the performance measures, or if the decision maker changes his preferences, the solution may become inferior. In the latter (multivariate) approach, it may not be easy to find the best mean vector due to the multi-objective nature of the problem. In the case of problems that are multi-objective in nature, there may not exist a single best solution, but rather a set of non-dominated solutions. The complete set of nondominated solutions is referred to as the Pareto set of solutions. They represent the “best” designs and are characterized by the definition that no other solution exists that is superior in all the objectives. In the application of evolutionary algorithms to solve multi-objective problems, the concept of Pareto optimality is often employed to find the non-dominated Pareto set (Fonseca and Fleming 1995; Teich and Schemann 2000; Zitzler and Thiele 1999). In this paper, to address the MORS problem, we incorporate the concept of Pareto optimality into the ranking and selection scheme. We try to provide a non-dominated Pareto set of designs to the decision maker, rather than reducing the problem to a single-objective model and providing a single “best” design as in Butler, Morrice, and Mullarkey (2001), Morrice, Butler, and Mullarkey (1998), and Swisher and Jacobson (2002). The problem considered in this study is now stated as follows. Suppose that we have a set of n designs, where each is evaluated in terms of m independent objectives. We want to find the non-dominated (Pareto) set of designs by running simulations. The problem is to determine an optimal allocation of the simulation replications to the designs, so that the non-dominated set of designs can be found at the least expense in terms of simulation replications. In this paper, we assume that the number of non-dominated designs (K) in the space is known in advance. The paper is organized as fol-
lows. Section 2 introduces a performance index to measure how non-dominated a design is in the case of multi-objective problems. The posterior distribution of the mean performance of a design is discussed in Section 3. Section 4 proposes a simulation replications allocation procedure for the MORS problem. Section 5 presents some computational results, and finally some conclusions and future research directions are summarized in Section 6. 2
MEASUREMENT OF NON-DOMINATED DESIGNS IN MULTI-OBJECTIVE PROBLEMS
To incorporate the concept of Pareto optimality into the ranking and selection scheme, we first need to find a way to measure how non-dominated a design is. Without loss of generality, we assume that minimization of the objectives is our goal throughout this paper. Also, we assume that the random variables under study follow continuous distributions. 2.1 Comparing Uncertain Performance Measures of Two Designs When considering Pareto optimality, we are trying to find a complete set of those non-dominated designs. Suppose we have two designs i and j, each of which is evaluated in terms of m performance measures as illustrated below.
µi : µi1, µi2 ,..., µim µ j : µ j1, µ j 2 ,..., µ jm In a noise-free situation, design j dominates design i, denoted by µ j p µ i , if the following condition holds with at least one inequality being strict:
µ jk ≤ µ ik
for k = 1, 2,..., m .
However, if “fitness” values µ ik and µ jk are random, i.e., subject to noise, then we have to consider the probability that design j dominates design i, as expressed in the following condition with at least one inequality being strict: P ( µ j p µ i ) = P ( µ jk ≤ µ ik for k = 1, 2,..., m) .
Under the condition that the performance measures are independent from one another and they follow continuous distributions, we have m
P(µ j p µ i ) =
∏ P(µ k =1
587
jk
≤ µ ik ) .
(1)
Lee, Chew, Teng, and Goldsman Alternatively, we can minimize the largest performance index for designs in the Pareto set, while satisfying the constraint that the total number of replications is within a predefined limit, Nmax. The problem becomes:
2.2 A Performance Index to Measure the Non-dominated Designs We now introduce a performance index to measure how non-dominated a design i is, when the performance measures are subject to noise. Given n designs, we calculate the cumulative probability of design i being dominated by other designs:
min ψ ( K )
δ1 ,δ 2 ,...,δ n n
∑ P( µ
i
≤ N max
(4)
i =1
n
ψi =
∑δ
subject to:
j
p µi ) .
δi ≥ 0
(2)
for all i = 1, 2,..., n
j =1, j ≠ i
In this study, though our final goal is to solve problem (3), we adopt a sequential approach, where at each step, given a total number of δ ( Nmax, go to Step 5.
from PROCEDURE II. Step 4: Perform δ wi (i =1,2,…,p) replications from those p
, and go to
PROCEDURE II Step 1: For each design i ∈ S p and for each design d = 1,2,…,n, calculate the change in performance index ∆ψ id upon additional replications from design d. Step 2: Calculate the total change in the performance index for designs in S p .
∑ ∆ψ
id
* δ wp
i = 1, 2,..., p − 1
COMPUTATIONAL RESULTS
is an ordered sequence in ascending order of the values of ψ i . Given that K is the number of non-dominated designs in the Pareto set, we want to find an optimal solution to problem (4). To find the optimal allocation of the simulation replications, we conduct a brute force search. Specifically, we fix the maximum number of replications Nmax = 400 and the number of designs n = 5. We consider the case when designs are evaluated in terms of 3 objectives. The means and standard deviations to generate the designs are listed in Table 1. From Table 1, we know that design 2 is dominated by designs 0 and 1; design 3 is dominated by design 1; design 4 is dominated by designs 1 and 3; and designs 0 and 1 are nondominated designs. For the TOA, from the brute force search, the number of replications allocated to each design (R) and its percentage of total number of replications ( θ ) are shown in Table 2. The Kth (2nd) performance index reached for the best allocation is 5.6 E-4.
Step 1. Step 5: Output the K best designs.
∆ψ d =
∆ψ wp
Suppose we know the true mean and variance of the performance measures of the n designs. Then, given a maximum total number of replications (Nmax) available, we can determine how to optimally allocate these replications to the designs so that the performance indexes ( ψ i ) for designs in the Pareto set are minimized. This is what theoretical optimal allocation means. Suppose δ i is the number of replications allocated to design i, and ψ (1) , ψ ( 2) ,…,ψ ( K ) , …,ψ ( n)
number of additional replications δ wi (i = 1,2,…,p)
wi
∆ψ wi
wi
5.1 Comparison with TOA and TUA
Step 3: Solve problem (4) by calling PROCEDURE II. Select p designs w1 , w2 , ..., w p and the corresponding
i =1
∑ ∆ψ
,
To examine the performance of MOCBA, we make two comparisons. One is against the theoretical optimal allocation (TOA) and the theoretical uniform allocation (TUA); and the other is with the uniform computing budget allocation (UCBA) algorithm. In the following computational experiment, when calling PROCEDURE II to solve problem (4), the number of designs (p) selected to allocate additional replications ( δ ) is set at 1, and the number of replications δ is set at 5.
PROCEDURE I Step 0: Perform δ 0 replications for each design (i = 1,2,…,n). Then total number of observations N = nδ 0 . Step 1: Calculate performance index ψ i for each design (i = 1,2,…,n). Sort the designs i = 1,2,…,n in ascending order of ψ i as ψ (1) ,ψ ( 2) ,...,ψ ( n ) . Put the K de-
∑δ
p
i =1
We propose the following procedures to allocate simulation replications to designs for the MORS problem. We call the set of two procedures the MOCBA algorithm. Given that p is the number of designs selected to allocate additional replications, we have
selected designs, set N = N +
δ ∆ψ w p
.
i∈S p
Step 3: Sort the designs in descending order of ∆ψ d as w1 , w2 , ..., wn , with the corresponding changes in the performance index denoted as ∆ψ w1 , ∆ψ w2 ,…, 590
Lee, Chew, Teng, and Goldsman Table 1: Means and Standard Deviations to erate the Designs Designs Mean1 Std1 Mean2 Std2 Mean3 0 16 9 44 9 56 1 17 9 40 9 64 2 18 9 45 9 65 3 19 9 42 9 66 4 20 9 43 9 67
TOA; see columns θ for MOCBA, TOA and TUA. The results indicate that MOCBA is effective.
GenStd3 9 9 9 9 9
Table 4: Number of Replications Needed for the MOCBA Designs Instance No. 0 1 2 3 4 0 42 55 34 29 29 1 40 34 5 5 5 2 83 131 11 7 100 3 44 52 6 32 15 4 209 220 57 95 5 5 117 172 29 127 34 6 8 45 20 37 15 7 185 256 6 179 12 8 211 225 37 77 19 9 41 56 9 6 28 10 12 12 5 5 5 11 111 114 37 19 24 12 240 247 6 11 95 13 31 111 63 105 27 14 28 57 20 53 5 15 61 62 71 56 92 16 36 80 14 53 37 17 65 68 5 5 8 18 91 96 7 46 20 19 97 111 6 5 14
Table 2: Number of Replications Needed for the TOA Designs 0 1 2 3 4 105 142 40 78 35 R 26.3 35.5 10.0 19.5 8.8 θ For the TUA, similarly, we suppose the true means and standard deviations of the designs are known as in Table 1. We want to determine — if we allocate the replications uniformly to each design — how many replications should be allocated to each design, so that the Kth (2nd) performance index is within the required performance index ψ * = 5.6 E-4. The numbers of replications needed for each design (R) are illustrated in Table 3. In this case, 110 replications should be allocated to each design, and a total of 550 replications are needed to attain the same performance index as in TOA. Table 3: Number of Replications Needed for the TUA Designs 0 1 2 3 4 110 110 110 110 110 R
Table 5: Comparison of MOCBA with TOA and TUA MOCBA TOA TUA θ θ θ R R R
To compare the proposed heuristic (MOCBA) with TOA and TUA, we generate 20 problem instances based on the means and standard deviations as illustrated in Table 1. We set the required performance index (ψ * ) to be 5.6 E-4. The replications needed for the 20 instances from MOCBA are illustrated in Table 4. On average for the 20 instances, the total number of replications needed for the 5 designs is 297, which is less than 400 (Nmax) for TOA and 550 for TUA. It seems that the heuristic (MOCBA) even takes fewer replications than the theoretical optimal one. The reason may be due to the fact that the MOCBA is sequential; and at each step, it can make use of the sampling information from the previous steps to make decisions regarding the allocation of additional replications. Chen, He, and Yücesan (2003) also presented similar findings. The following Table 5 shows the performance comparison among the three algorithms. Table 5 illustrates, in our computational experiment, how replications are allocated to each design for MOCBA, TOA and TUA. This includes the numbers of replications allocated to each design (R) and the corresponding percentages of the total number of replications ( θ ). From Table 5, we can see that the distribution of the replications among the designs is similar for MOCBA and
Design No. 0 1 2 3 4 Total
88 110 22 48 29 297
29.5 37.1 7.5 16.0 9.9 100
105 142 40 78 35 400
26.3 35.5 10.0 19.5 8.8 100
110 110 110 110 110 550
20 20 20 20 20 100
5.2 Comparison with Uniform Computing Budget Allocation (UCBA) In this section we present results obtained from comparing MOCBA with UCBA. In UCBA, we iteratively allocate the same number of replications to each design, until the required performance measure is met. We consider the case when designs are evaluated in terms of 3 objectives. We generate 25 designs based on given means and standard deviations. The means used for each design are shown in Table 6, and the standard deviation is 3 for all designs. From the means of the designs, we know that designs 0, 1, 3, 4, 8 are non-dominated. To test the robustness of the algorithm, we generate 20 problem instances. 591
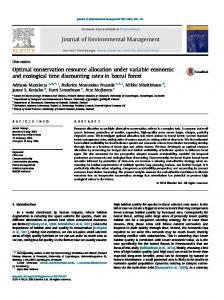
Lee, Chew, Teng, and Goldsman to each design for both MOCBA and UCBA. From the MOCBA plots, we can clearly see that the following designs are allocated more replications: (a) those designs that should be in the Pareto set, and (b) those designs whose performances are very close to designs in (a). This indicates that our MOCBA algorithm is effective.
Table 6: Means Used to Generate the 25 Designs Design No. Mean1 Mean2 Mean3 0 15 44 56 1 16 42 64 2 19 43 63 3 22 42 58 4 18 38 62 5 23 43 64 6 18 45 60 7 19 39 63 8 20 40 60 9 22 42 62 10 24 44 64 11 26 46 66 12 28 48 68 13 30 50 70 14 32 52 72 15 34 54 74 16 36 56 76 17 38 58 78 18 40 60 80 19 42 62 82 20 42 60 80 21 36 62 82 22 42 56 68 23 32 62 66 24 34 60 82
Average Number of Replications for Each Design 70 Average Num ber of Replicaitons
60
40 30 20 10 0 0 1 2 3 4 5 6 7 8 9 10 11 12 13 14 15 16 17 18 19 20 21 22 23 24 Design Num ber MOCBA UCBA
Figure 2: Comparison of Average Number of Replications for Each Design 6
CONCLUSIONS
In this paper, we present a framework for the ranking and selection problem when the designs are evaluated in terms of more than one performance measure: the multi-objective ranking and selection (MORS) problem. We incorporate the concept of Pareto optimality into the ranking and selection scheme, and try to find all the non-dominated designs in the Pareto set rather than a single “best” design. We present a simple sequential solution method (MOCBA) to solve the problem. Computational results show that the proposed algorithm is efficient in terms of the total number of replications needed to find the Pareto set, at least in comparison with the TOA (theoretical optimal allocation) and TUA (theoretical uniform allocation) with known true mean and variance, as well as with the UCBA (uniform computing budget allocation). Compared to the TOA and TUA, MOCBA takes fewer replications; while compared to UCBA, the speedup of MOCBA over UCBA is about 2 times. In the current study, we assume that the number of non-dominated designs in the Pareto set is known. In future research, we may relax this assumption and propose methods to find the correct non-dominated Pareto set.
In the following comparison of MOCBA with UCBA, we set the initial number of runs δ 0 = 15. Also, we set the required performance index ψ * = 0.001 as the stopping criterion. Figure 1 illustrates the number of replications needed for MOCBA and UCBA. From Figure 1, we can see that the average speedup of MOCBA over UCBA is about 2 times. Number of Replications for MOCBA and UCBA 4000 Num ber of Replications Needed
50
3500 3000 2500 2000
REFERENCES
1500 1000
Bechhofer, R. E., T. J. Santner, and D. M. Goldsman. 1995. Design and Analysis of Experiments for Statistical Selection, Screening, and Multiple Comparisons. “New York: Wiley”. Butler, J., D. J. Morrice, and P. W. Mullarkey. 2001. A multiple attribute utility theory approach to ranking and selection. Management Science 47(6): 800–816. Chen, C. H., H. C. Chen, and L. Dai. 1996. A gradient approach for smartly allocating computing budget for
500 0 0 MOCBA
1
2
3
UCBA
4
5
6
7
8
9 10 11 12 13 14 15 16 17 18 19
Instance Num ber
Figure 1: Comparison of Total Number of Replications for MOCBA and UCBA Figure 2 illustrates for the 20 problem instances generated, the average number of replications that are allocated 592
Lee, Chew, Teng, and Goldsman discrete event simulation. In Proceedings of the 1996 Winter Simulation Conference (ed. J. M. Charnes, D. J. Morrice, D. T. Brunner, and J. J. Swain), 398–405. Piscataway, New Jersey: Institute of Electrical and Electronics Engineers. Chen H. C., L. Dai, C. H. Chen, and E. Yücesan. 1997. New development of optimal computing budget allocation for discrete event simulation. In Proceedings of the 1997 Winter Simulation Conference (ed. S. Andradóttir, K. J. Healy, D. H. Withers, and B. L. Nelson), 334–341. Piscataway, New Jersey: Institute of Electrical and Electronics Engineers. Chen, C. H., D. H. He, and E. Yücesan. 2003. Better-thanoptimal simulation run allocation? In Proceedings of the 2003 Winter Simulation Conference (ed. S. Chick, P. J. Sánchez, D. Ferrin, and D. J. Morrice), 490–495. Piscataway, New Jersey: Institute of Electrical and Electronics Engineers. Chick, S. E. 1997. Selecting the best system: A decision theoretic approach. In Proceedings of the 1997 Winter Simulation Conference (ed. S. Andradóttir, K. J. Healy, D. H. Withers, and B. L. Nelson), 326–333. Piscataway, New Jersey: Institute of Electrical and Electronics Engineers. DeGroot, M. H. 1970. Optimal Statistical Decisions. McGraw-Hill, Inc. Dudewicz, E. J. and V. S. Taneja. 1978. Multivariate ranking and selection without reduction to a univariate problem. In Proceedings of the 1978 Winter Simulation Conference (ed. H. J. Highland, L. G. Hull, and N. R. Neilsen), 207–210. Piscataway, New Jersey: Institute of Electrical and Electronics Engineers. Fonseca, C. M. and P.J. Fleming. 1995. An overview of evolutionary algorithms in multiobjective optimization. Evolutionary Computation 3(1): 1–16. Goldsman, D. and B. L. Nelson. 1994. Ranking, selection and multiple comparisons in computer simulation. In Proceedings of the 1994 Winter Simulation Conference (ed. J. D. Tew, S. Manivannan, D. A. Sadowski, and A. F. Seila), 192–199. Piscataway, New Jersey: Institute of Electrical and Electronics Engineers. Goldsman, D. and B. L. Nelson. 1998. Statistical screening, selection, and multiple comparison procedures in computer simulation. In Proceedings of the 1998 Winter Simulation Conference (ed. D. J. Medeiros, E. F. Watson, J. S. Carson, and M. S. Manivannan), 159– 166. Piscataway, New Jersey: Institute of Electrical and Electronics Engineers. Morrice, D. J., J. Butler, and P. W. Mullarkey. 1998. An approach to ranking and selection for multiple performance measures. In Proceedings of the 1998 Winter Simulation Conference (ed. D. J. Medeiros, E. F. Watson, J. S. Carson, and M. S. Manivannan), 719– 725. Piscataway, New Jersey: Institute of Electrical and Electronics Engineers.
Rinott, Y. 1978. On two-stage selection procedures and related probability-inequalities. Communications in Statistics A7 (8): 799–811. Swisher, J. R. and S. H. Jacobson. 2002. Evaluating the design of a family practice healthcare clinic using discrete-event simulation. Health Care Management Science 5 (2): 75–88. Swisher, J. R., S. H. Jacobson, and E. Yücesan. 2003. Discrete-event simulation optimization using ranking, selection, and multiple comparison procedures: A survey. ACM Transactions on Modeling and Computer Simulation 13 (2): 134–154. Tan, Y. P. 2003. Multi-objective genetic algorithm for robust flight scheduling. Masters Thesis. Department of Industrial and Systems Engineering, National University of Singapore. Teich, J. and R. Schemann. 2000. Pareto-front exploration with uncertain objectives. Technical report No. 3/00, Computer Engineering Laboratory, University of Paderborn. Zitzler, E. and L. Thiele. 1999. Multiobjective evolutionary algorithms: A comparative case study and the strength Pareto approach. IEEE Transactions on Evolutionary Computation 3(4): 257–271. AUTHOR BIOGRAPHIES LOO HAY LEE is an Assistant Professor in the Department of Industrial and Systems Engineering, National University of Singapore. He received his B.S. (Electrical Engineering) degree from the National Taiwan University in 1992 and his S.M. and Ph.D. degrees in 1994 and 1997 from Harvard University. He is currently a senior member of IEEE, vice president of ORSS, and a member of INFORMS. His research interests include simulationbased optimization, production scheduling and sequencing, logistics and supply chain planning, and vehicle routing. His email address is and his website is . EK PENG CHEW is an Associate Professor and Deputy Head (Academic) in the Department of Industrial and Systems Engineering, National University of Singapore. He received his Ph.D. degree from the Georgia Institute of Technology. His research interests include logistics and inventory management, system modeling and simulation, and system optimization. His email address is and his web address is . SUYAN TENG is currently a Research Fellow in the Department of Industrial and Systems Engineering, National University of Singapore. She received her Ph.D. degree from National University of Singapore in 2004. 593
Lee, Chew, Teng, and Goldsman Her research interests include simulation-based optimization and heuristic algorithms development for solving vehicle routing and scheduling problems. Her e-mail address is . DAVID GOLDSMAN is a Professor in the School of Industrial and Systems Engineering at the Georgia Institute of Technology. His research interests include simulation output analysis and ranking and selection theory. He has done applied work in the health care and transportation industries. He is an active participant in the Winter Simulation Conference, having been Program Chair in 1995. He represents the Institute of Industrial Engineers on the Board of the annual WSC. His email address is and his website is .
594