I.J. Mathematical Sciences and Computing, 2018, 3, 42-65 Published Online July 2018 in MECS (http://www.mecs-press.net) DOI: 10.5815/ijmsc.2018.03.04 Available online at http://www.mecs-press.net/ijmsc
Optimal Control Dynamics: Control Interventions for Eradication of Ebola Virus Infection Bassey B. Echenga*, Bassey Delphine Rexsonb *a
Department of Mathematics /Statistics, Cross River University of Technology, 540252, Calabar, Nigeria b Department of Botany, University of Calabar, 540271, Calabar, Nigeria Received: 02 March 2018; Accepted: 17 April 2018; Published: 08 July 2018
Abstract In affirmation of the existence of control interventions for the eradication of Ebola virus infection as a remedy to complete lack of outright medical cure, the present study seek and formulated using continuous ordinary differential equations an extended BEB-SEIR 4-Dimensional mathematical Ebola dynamic model vested with the scope of establishing the epidemiological impact of identified structured Ebola control measures. Derived model was presented as an optimal control problem subjected to structured dual treatment functions. Moreso, following the validity of model state components as representatives of living organisms and the establishment of existence of boundedness of solutions; we performed our analysis using classical Pontryagin’s maximum principle with which the optimality system of the model was established. Numerical simulations of derived model via Runge-Kutter of order 4 in a Mathcad surface were conducted. Result clearly indicated enhanced impact of intermediary and secondary control interventions as Ebola virus treatment functions with high significant maximization of susceptible population devoid of Ebola infection. Both the exposed and infectious classes were maximally reduced to near zero with possibilities of achieving complete eradication if time interval could be extended exceeding the 21days of Ebola life-cycle. Furthermore, recovery rate of removed class justified the formulation and application of the model. The study therefore suggests further articulation of the model to account for possible intracellular delay in the biological mechanism. Index Terms: Ebola-virus, control-intervention, treatment-function, optimality-system, schematic-vaccine, Nosocomial, transmissibility, cremation. © 2018 Published by MECS Publisher. Selection and/or peer review under responsibility of the Research Association of Modern Education and Computer Science
* Corresponding author. Tel.: +2348067535050; fax: 7083068033 E-mail address: a*
[email protected],
[email protected]
Optimal Control Dynamics: Control Interventions for Eradication of Ebola Virus Infection
43
1. Introduction Despite the multinational and multi-sectorial efforts dissipated to the control of Ebola virus disease (EVD) since it advent in 1976, like the human immunodeficiency virus (HIV) among other transmittable diseases, cogent medical cure is yet to be established other than schematic vaccines that are in most cases not found in remote community setups. The only nascent approach to medical treatment of the disease had been structured control intervention strategies [1]. Identifiably, virologic investigation had uncovered a varying number of Ebola strains, which varies from localities through countries and continents. Notable Ebola virus includes: Ebola-Zaire, Ebola-Sudan, larger species known as Bundibugyo Ebolavirus, Reston Ebolavirus (in Philippines), Tai Forest Ebolavirus (from Chimpanzee in Ivory Coast) and recently, clades of Ebola-Guinea, which are separate from known EBOV [1-3]. In reality, due to the death-defying nature of Ebola disease, couple with the non-identification of Ebola reservoir, Ebola virus infection has assumed the fastest killing infectious disease globally. Precisely, from biological history of the evolution of Ebola virus – Ebola hemorrhagic Fever popularly known as Ebola Virus Disease first emanated from River Ebola in Zaire and Sudan. [4-6]. This informed the incessant and prevalence of Ebola virus infection outbreak in the West African region. The studies [7, 8] presented more on the literatures of the spread and infection of Ebola virus. The outbreak of Ebola virus infection in 2014, which affected countries like Sierra Leone, Guinea, and Liberia with seeded cases in Nigeria, Senegal, Span, USA and Mali, presented the most severe epidemic in the last 40 year of Ebola discovery as evidenced by high morbidity and mortality rate [9-11]. Although this epidemic causing outbreak posed an unprecedented situation in the affected countries, the clinical investigation of the dynamics of infection and transmission of the virus are essentially similar to those of EVD [12]. Revealed by that study, were the possible causes of Ebola infection, which includes: signs a d symptoms with incubation period identified to be 11.4days and serial interval of 15.3days giving 70.8% fatality rate. From the literature point of models [1, 2, 12-14], the incubation period of Ebola is within 2 21days with mutation of infection period of 4 10days . Ebola virus are conspicuously spread through body fluid contact of symptomatic patient, secretions, tissue and semen from infected patients, lack of safety cremation of dead bodies with Nosocomial transmissibility as the most recent clinical ineptitude [2, 12, 13, 15]. Of note, the most affected are children of less than 2 years of age, the elderly and the pregnant women among others [1, 16-18]. The major characteristic symptoms of Ebola virus infection are identified by clinical features to include early gastrointestinal infection, high fever, severe headache, malaise, which rapidly progress to vomiting, severe diarrhea, rash, severe bleeding (both internal and external) and shock with lethal outcome – death [1, 2, 16, 19, 20]. Since mutation period has maximum of 10days , infectious individuals in regions with no established medical control interventions are left with greater option of death from date of initial infection, with 50% 90% of such cases in sub-Saharan and West Africa [1, 2, 8, 17]. A situation that has caused somewhat rise in the specter of increasing local and international dimension of the virus (for more details, see [21]). Furthermore, it has become of reckon that due to lack of coherent specified hospital conditions, the most established approach in studying the spread of the disease and the impact of available schematic medical care has been the application of mathematical modeling. Through this later approach, a number of preventive control intervention strategies have been identified and established. These factors ranges from surveillance, contact tracing, screening, quarantine of suspected individuals, Barrier nursing technique and rapid cremation of dead bodies. For instance, the result of the findings by [2] showed that education and contact tracing followed by quarantine reduces the final epidemic size by a factor of 2 relative to the final size with 2-week delay in implementation. The model [12] studied Ebola virus disease in West Africa using logistic-regression models to investigate five key time periods that characterizes the progression of Ebola infection. The control data indicated that without drastic improvements in control measures, the numbers of cases of death from Ebola virus disease are expected to be on the increase of thousands per week.
Optimal Control Dynamics: Control Interventions for Eradication of Ebola Virus Infection
44
From the studies [1, 2, 6] core control intervention strategies were identified to include surveillance, contact tracing, random screening and quarantine of suspects; barrier nursing technique and rapid cremation of death bodies. In our earlier investigation [1], on the impact of control intervention for transmission of Ebola virus, we established the use of SEIR (susceptible-exposed-infectious-removed) model for clinical classification of control interventions into four major control indicators. The model uses difference of equation in its analysis and result indicated that in the absence of outright medical cure, intermediary and secondary interventions proves to be the most admirable means for both the treatment and prevention of Ebola virus infection. Therefore, in this present study, following the innovative ideas of models [1] and then [2], we denotes these classes of control interventions (intermediary and secondary) as predominant treatment functions for Ebola virus infection. We then introduce the idea of optimal control theory to effectively maximize the concentrations of recovery and susceptible population at minimize cost of control interventions while eradicating infectious class from susceptible population. Therefore, the novelty of this present study is informed by the identification and application of intermediary and secondary control interventions as multiple treatment measures that quantify the performance index based on the concentration of recovered and susceptible under minimized systemic cost. Appreciably, the entire work is divided into six sections with section 1 covering the introductory aspect. In section 2, we concentrated on the mathematical formulation of the model for an untreated Ebola virus infection, followed by justification of the model state variables as true representative of living organisms and existence of boundedness of solution. With the introduction of control interventions as treatment factors, we present in section 3, the model as an optimal control problem. The characteristic properties of the optimal control and the existence of an optimal control pair for the model are also established here. Section 4 is devoted to the derivation of the model optimality system and the uniqueness of optimality system. Numerical simulations and succinct discussion of the resulting outcome forms the fulcrum of section 5. Finally, incisive conclusion and remarks are constructed in section 6. The present investigation is hoped to vindicate and strengthened the impact of intermediary and secondary control interventions as essential treatment functions for Ebola virus epidemic. 2. Mathematical Formulation for an Untreated Ebola Infection Model Presumably, due to the quick transformation of the life-cycle of Ebola virus infection, the seeming must acceptable representation of the deadly virus is the SEIR (susceptible-exposed-infectious-removed) flow-chart model adopted by [1, 2]. In conducting this present investigation guided by its scope, we shall dwell in the reformulation of this model via the innovative ideas of the above SEIR epidemic models. Therefore, this section shall be devoted to the formulation of a simple continuous differential equation model as well as the validity of the model state variables positivity and boundedness of solutions. 2.1. Continuous Differential Equation Model For a continuous differential equation model, the standard model [1] will be adopted as pivot step in the formulation of this present model. In that model, the system was governed by the following epidemiological equations:
si bm(t ) qri Bc si si e B s ( k )e i
c i
i
yi kei ( ) yi r y ( q)r i
i
i
(1)
Optimal Control Dynamics: Control Interventions for Eradication of Ebola Virus Infection
where, si (0) s(i )0 , ei (0) e(i )0 , yi (0) y(i )0 and ri (0) r(i )0 for all t From model (1), we structurally observed that
ei (t )
si (t )
45
t0 .
- represent the susceptible class of individuals at time t ;
- exposed class of individuals to virus at time t ;
yi (t )
- infectious class of individuals at time t ; ri (t ) -
recover or dead (removed) population at time t and assumed uniform status for all the state components. Unlike this model (1), this parameter alongside other new incorporated model parameters and constants have been varied. Thus, for an untreated Ebola model, equation (1) is modified to give the following epidemiological BEB-SEIR (name after the author of this work) equation:
si bp qri si yi si ei yi si ( 1 k )ei y ke ( ) y i
i
2
(2)
i
ri yi ( 3 q)ri where 1
0, 2 0, 3 0 are varying death rates of exposed, infectious and removed Ebola patients and with si (0) s(i )0 , ei (0) e(i )0 , yi (0) y(i )0 and ri (0) r(i )0 for all t t0 . Here, we note that if Ni (t ) is the effective population size at time t under investigation and N , the sum total population, then Bc
yi m(t )
yi , since m(t )
Ni (t ) si ei yi ri 1 . N
Model (2) is therefore our basic equations with which we conduct our present investigation. Furthermore, model (2) is analogous to the stochastic model (continuous time Markov chain) by [2]. Basically, the BEBSIER model (2) is constructed by considering the continuous four mutations: exposed, infectious, removed (recover or die) and susceptible. Thus, the corresponding transition rates are defined as in table 1 below: Table 1. BEB-SIER Ebola Model
Mutation Exposed Infectious Removed Susceptible Remark 1:
Effect
Transition rate
(si , ei , yi , ri ) (si , ei , yi , ri ) (si , ei , yi , ri ) (si , ei , yi , ri ) (si , ei , yi , ri ) (si , ei , yi , ri )
(bp qri )
(si , ei , yi , ri ) (si , ei , yi , ri )
yi si kei yi
The mutation time is continuous within the finite circulating transmutation life-span of
epidemiology of virus i.e.
ti 0
for all ti [t0 , t f ],i 1,..., t f . Therefore,
ti
is the mutation time an
individual transmute between different stages. For proper assimilation of model (2), we present the epidemiological description of the terms as follows:
Optimal Control Dynamics: Control Interventions for Eradication of Ebola Virus Infection
46
from first equation, the first term b p define the natural source of susceptible population, which is proliferated by the rate of recovered treated infectious individuals qri (t ) of second term. The third term si (t ) represents natural death rate of susceptible population, while the last term yi (t ) si (t ) describe the differential product of average contact of susceptible with infected cells and the probability of this differential product transmitting the virus. The second equation is characterized by the inflow of proliferation of the differential product yi (t ) si (t )
as the first term and the second term ( 1 k )ei (t ) as the sum of gradual transformation of exposed class becoming infectious with associated natural death rate and clearance rate due to exposure to virus. From the third equation, the first term
kei (t ) denotes the rate of inflow of exposed individual that become actively
infectious. In this case, we consider the viral source to be directly proportional to infectious population attributed by k [22]. The second term here,
( 2 ) yi (t ) present
the sum of natural death rate of
infectious group, the death rate due to chronic infection and the per-capita rate at which infectious may recover (or die). In this case, we consider the viral source to be directly proportional to the infectious class, which is attributed to k [22]. The last equation describes the recover (or death) population of which the first term yi (t ) defines the rate
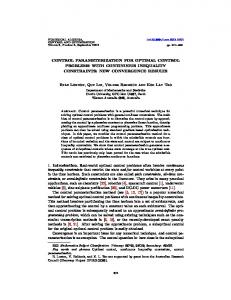
of inflow of per-capita of infectious that may recover (or die). The last term represent the sum rate of natural death of possible recovered group, the clearance rate in the removed process and the rate at which actual recovered class are recruited to the susceptible class. Remark 2: i) The chamber denoted by C (t ) is not an epidemiological quantity rather, a descriptive constant that defines the cumulative number of cases of incidence upon onset of symptoms. ii) We expect a complete transformation of basic model (2) following the introduction of treatment functions (control interventions). Thus, model (2) and the application of cogent control intervention functions are schematically represented by fig. 1 below. From model (2) and fig. 1, the following assumptions hold: Assumption 1: The realization of the present model is a consequence of the following limitations: i) Contact tracing is inconsistent and unsystematic. ii) Preventive intervention is only at infection point. iii) There exists lack of cogent and comprehensive barrier nursing technique. iv) Insignificant counseling against unhealthy sexual practices and condom use. v) Cremation is incomprehensive. Assumption 2: For a realistic Ebola model, the following conditions must be satisfied: i) Significant control interventions (i.e. intermediary and secondary, which in our present investigation are considered treatment functions denoted by 1 and
2 respectively. ii) Core predominant parameters 0 and k 0 . iii) Recovered
is recruited to susceptible class. iv) Recovered are immune from infection but not for life i.e. q 0 for all
t 0. Now, since the state variables are representative of living organism, we need to verify that these key components are completely non-negative and there exist boundedness of solutions.
Optimal Control Dynamics: Control Interventions for Eradication of Ebola Virus Infection
47
Fig.1. Schematic Transmission Dynamics of Ebola Virus Infection.
2.2. Positivity of State Variables and Boundedness of Solutions Here, we shall show using fundamental theory of functional differential equations [23, 24] that there exist unique solutions si (t ), ei (t ), yi (t ), ri (t ) to model (2) with initial values
si ( ), ei ( ), yi ( ), ri ( ) C .
(3)
Biologically, equation (3) is assumed to be non-negative i.e.
si ( ), ei ( ), yi ( ), ri ( ) C \ C 0, for all [t0 , t f ]
(4)
Therefore, the positivity and boundedness of model (2) for which initial value function satisfies conditions (3) and (4) is defined by the following theorem. Theorem 1: Given that si (t ), ei (t ), yi (t ) and and (4). Then,
ri (t ) are solutions of model (2) and satisfying conditions (3)
si (t ), ei (t ), yi (t ) and ri (t ) are all non-negative and are boundedness for all t 0
at which the
solutions exists. Proof: We start by showing that state variables of the system are life varying integers. That is, from equations of model (2), we differentiate each of them to justify their non-negativity. From the first equation, we have
Optimal Control Dynamics: Control Interventions for Eradication of Ebola Virus Infection
48
dsi bp qri si yi si . dt dsi ds si i si 0 . dt dt The inequality here implies that si is finite and positive or si , since t 0 (from Thm.). Taking the Differentiating with respect to si we obtain
integrating factor, we have IF
e
dt
et . Then multiplying by the integrating factor, we get et {si si (t )} 0 .
d t e si (t ) 0 . Integrating both side becomes dt et si (t ) C . We now divide through by the integrating factor to get si (t ) Cet . Rewriting the left hand side of the equation, we have
Applying the initial conditions i.e. t 0 , such that si (t ) si (0).si (0) C . Then, si (t ) si (0)e
t
for t 0 . When t
, si (t ) 0 . Therefore, si (t ) 0 .
From the second equation,
dei de dei yi si ( 1 k )ei , we have ( 1 k )ei i ( 1 k )dt dt dt ei i.e.
dei ( k )dt . Therefore, ei (t ) ei (0)e( 1 k )t 0, t 0 for t 0 . ei
Similarly, from the third equation,
dyi kei ( 2 ) yi , we have dt
i.e.
dyi ( 2 ) yi dt
dyi ( 2 )dt yi
dyi ( 2 )dt . Therefore, yi (t ) yi (0)e( 2 )t 0, t 0 for t 0 . yi
Finally, the fourth equation is given as
0,
Optimal Control Dynamics: Control Interventions for Eradication of Ebola Virus Infection
49
dri yi ( 3 q)ri , then we have dt dr dri ( 3 q) yi i ( 3 q)dt dt ri i.e.
dri ( 3 q)dt . Therefore, ri (t ) ri (0)e( 3 q )t 0, t 0 for t 0 . ri
Hence, positivity of all model state variables is guarantee and conditions (3) and (4) are satisfied. Next, we verify the boundedness of solution. Let P(t ) q si (t ) q ei (t )
q yi (t ) ri (t ) and n min{ , 1 , 2 2, 3} . By positivity of 2
solution, it follows that
d [ P(t )] q[bp qri (t ) si (t ) yi (t ) si (t )] dx
q yi (t )si (t ) ( 1 k )qei (t ) 1qei (t )
qbp q si (t ) 1q ei (t ) q si nP(t ). Hence, P(t ) is bounded and so are
q 2 yi (t ) qri (t ) 2
q 2 yi (t ) ri (t ) 2
si (t ), ei (t ), yi (t ) and ri (t ) . Therefore, proof completed.
Remark 3: It becomes obvious that from Thm. 1 together with conditions (3) and (4), for ei (0) , yi (0) such that
ri (0) 0 , then si (t ) , ei (t ) yi (t ) and ri (t ) are all positive and thus boundedness of solution exist for all
t 0. So we have seen that our model key components satisfy positivity and have bounded solutions. Therefore, in affirmation of system model (2) and assumptions (1 and 2) we generate (as in table 2 below) from known certify clinical data for both state variables and parameters with which the model can be simulated.
Optimal Control Dynamics: Control Interventions for Eradication of Ebola Virus Infection
50
Table 2 Description of State Variables and Parameter for Optimal Control of Ebola Intervention Strategies. Dependent variables Description
Initial values
si
Susceptible class of individuals at time t
0.5
ei
Exposed class of individuals to virus at time t
0.2
yi
Infectious class of individuals at time t
0.2
ri
Removed (recover or dead) population at time t
0.1
Units
cells/mm3
Variables
Parameters and Constants Values
Natural source of susceptible class
0.2
Natural death rate for all state variables
0.02
1 2 3
Death rate of expose class to virus
0.05
Death rate of active infectious class due to virus
0.07
Death rate at removed class
0.02
k
Rate at which exposed becomes symptomatic and infectious
0.02
Per-capita rate at which infectious recovers (or die)
0.15
q
Recruitment rate of recovered to susceptible class
0.04
Average number of contacts by susceptible with infectious class
0.5
Probability of transmission by infectious per day
i 1,2
Treatment control functions for
si , ei , yi , ri
A1
Optimal weight ratio for 1
A2
Optimal weight ratio for
2
0.2
Units
mm3day-1
bp
Description
day 1
i [0,1) 25
Note: Table 2 is a reflection of data from models [1, 2] clinically = modified to accommodate the present novel model.
Not to lose focus at this point, we must be guided by the fact that the motivational goal of this study is the derivation of a mathematical and quantitative approach for the maximization of the performance index measured by the benefit on susceptible population and amount of recovered class under minimized control intervention cost (treatment functions). Therefore, we are obliged to transform model (2) to an optimal control problem defined by an objective functional. 3. Optimal Control Problem and Characterization To allow the appreciation of cogent control intervention schedules, we are bound to represent our derived model (2) as an optimal control problem. This is followed by a flow-chart description for a typical Ebola virus model under dual treatment functions. The last part of this section is the establishment of the optimal control characteristics and thus shows that the model optimal control pair exists.
Optimal Control Dynamics: Control Interventions for Eradication of Ebola Virus Infection
51
3.1. Optimal Control Problem for system Model For a typical model (2), we seek to redefine the model to yield an optimal control pair, which maximizes healthy susceptible population under a minimized systemic cost of control interventions and maximal suppression of infectious population. From assumption 2, if our control interventions is the treatment functions
1 and 2 defined by lower and upper bounds i.e. (ai , bi ) where {ai 1 ,2 bi \ (1 ,2 ) : ai , bi [0,1], i 1, 2} , then the maximal cost of control interventions is given 2 by (1 (t ) 2 (t )) . The implication is that if i 1 , we experience total effective control intervention and for i 0 , there exist off control intervention. Hence, for i 0 , model (2) is justified. * * Therefore, we opt for an optimal control intervention pair 1 , 2 such that denoted
by
Z (1* , 2* ) max{Z (1 , 2 ) \ (1 , 2 ) S} 0i 1
where, S : (1 , 2 ) \ i is Lebesgue-measurable with ai bi , t [t0 , t f ], fori 1, 2
is the control set.
Mathematically, the objective functional that maximizes the concentration of healthy susceptible population and amount of recovered population is governed by tf
Z (1 , 2 ) {si (t ) ei (t ) [ t0
A1 A (1 (t)) 2 2 (2 (t)) 2 ]}dt 2 2
(5)
Subject to the state system
si bp qri si (1 1 (t ))[ yi si ] ei (1 1 (t ))[ yi si ] ( 1 k )ei y (1 (t ))ke ( ) y i
2
i
2
(6)
i
ri (1 2 (t )) yi ( 3 q )ri
(1 1 (t )) and virus production by infectious class under control intervention is given by (1 2 (t ))(k ) respectively. However, for cases of where infection rate on susceptible class under control function is
severities arising from control interventions, the following proposition holds: Proposition 1: Assume there exist control intervention hazardous effect then, the inequality of the optimal weight factors Ai 1,2 is such that
0 ai i bi 1 is satisfied [25].
Interestingly, we illustrate using flow-chart as in fig. 2 below, the investigation of the treatment function via optimal control strategy for the present model. Here, we see that predominant control functions are streamlined into two major control indicators:
Optimal Control Dynamics: Control Interventions for Eradication of Ebola Virus Infection
52
Fig.2. Flow-chart of Ebola Treatment Functions (BNT – C = Barrier Nursing Technique and Cremation).
3.2. Characterization of an Optimal Control The derivation of a realistic property of an optimal control requires the application of classical Pontryagin’s maximum principle with which the objective functional is the Hamiltonian arguments [26], defined by the following Lagrangian:
L(si (t ), ei (t ), yi (t ), ri (t ), 1 (t ), 2 (t ),1 (t ),2 (t ),3 (t ),4 (t )) si (t ) ei (t ) [
A1 2 A2 2 1 2 ] 2 2
1[bp qri si (1 1 (t ))[ yi si ]] 2 [(1 1 (t ))[ yi si ] ( 1 k )ei ]
(7)
3[(1 2 (t ))kei ( 2 ) yi ] 4 [(1 2 (t )) yi ( 3 q)ri ] u11 (t )(b1 1 ) u12 (t )(1 a1 ) u21 (t )(b2 2 ) u22 (t )(2 a 2 ) where u11 (t ), u12 (t ), u21 (t ), u22 (t ) 0 are penalty multipliers satisfying
u11 (t )(b1 1 ) 0, u12 (t )(1 a1 ) 0
at optimal
1*
and
u21 (t )(b2 2 ) 0, u22 (t )(2 a 2 ) 0
at optimal
The penalty multipliers ensure that i 1,2 remains bounded in the domain
2* .
i [0,1] andi (t ), i 1,.., 4 are
Optimal Control Dynamics: Control Interventions for Eradication of Ebola Virus Infection
53
the model adjoint variables, which determine the adjoint system. Of note, the adjoint system together with the state variables determines the model optimality system. Therefore, we are to establish all possible control of i including those on the boundary {0,1} . i)
The case of the set {t / 0 i
*
(t ) 1}: uij 0, i, j 1, 2 .
Here, for an unconstrained optimal control i 1,2 , the Pontryagin’s maximum principle is satisfied if *
L L 0 and * 0 . * 1 2 Then, we have to find
L , i 1, 2 and solve for 1* and 2* by setting our partial derivative of L equal to * i
zero, i.e.
L A11* (t ) 1 (t )( yi si ) 2 (t )( yi si ) u11 u12 0 at 1* 1* and
L A22* (t ) 3 (t )kei 4 (t ) yi u21 u22 0 at 2* * 2 1* Solving for the optimal control
1 (t )( yi si ) 2 (t )( yi si ) u11 u12
.
1* for uij 0, i, j 1, 2 , then our optimal control 1* is characterized by
1* Similarly, 2 is characterized by *
A1
2*
1 (t )( yi si ) 2 (t )( yi si ) A1
3 (t )kei 4 (t ) yi A2
.
.
Moreso, for boundary cases of i 0 and i 1 , we compute as follows: *
ii)
*
The case of the set the set {t / 0 i
*
(t ) 0, i 1, 2}, u1 j 0, ui 2 0, i, j 1 .
Optimal Control Dynamics: Control Interventions for Eradication of Ebola Virus Infection
54
Then, the optimal control is derive as
0 By definition, since u1 j
1 (t )( yi si ) 2 (t )( yi si ) u1 j A1
.
0 , the above implies that
1 (t )( yi si ) 2 (t )( yi si ) 0 Thus, to insure that 1 is never negative, we rewrite 1 with the notation *
*
yi si (1 (t ) 2 (t )) (t ) A1
* 1
Similarly,
(t )kei 4 (t ) yi 3 . A2 * 2
iii)
For the case of the set the set {t / 0 i
*
(t ) 1, i 1, 2}, ui1 0, u2 j 0, i, j 2 .
Then, the optimal control is obtain as
1
1 (t )( yi si ) 2 (t )( yi si ) u2 j A1
.
This implies that
0 u1 j (t ) 1 (t )( yi si ) 2 (t )( yi si ) A1 or
1 (t )( yi si ) 2 (t )( yi si ) A1 Similarly,
1 1*
Optimal Control Dynamics: Control Interventions for Eradication of Ebola Virus Infection
(t )kei 4 (t ) yi 3 A2
55
* 1 2 .
So, on this set, we must choose
yi si (1 (t ) 2 (t )) 1* (t ) min ,1
A1
and
3 (t )kei 4 (t ) yi A2
2* (t ) min
,1 .
Hence, the complete characterization of the optimal control includes the three cases and is derived as: 1 (t ) min max a1 , yi si (1 (t ) 2 (t )) , b1 A1 * 1
(8)
and 1 (t ) min max a2 , 3 (t )kei 4 (t ) yi , b2 . A2 * 2
(9)
The results of equations (8) and (9) are completely described by the following proposition: Proposition 2: The optimal control for equations (5) and (6) is completely characterized by 1 (t ) min max a1 , yi si (1 (t ) 2 (t )) , b1 A1 * 1
and 1 (t ) min max a2 , 3 (t )kei 4 (t ) yi , b2 . A2 * 2
Thus, it becomes obvious that our control is described in terms of the levels of circulating susceptible,
Optimal Control Dynamics: Control Interventions for Eradication of Ebola Virus Infection
56
exposed and infectious population as well as their related adjoint variables. 3.3. Existence of an Optimal Control Pair The existence of optimal control pair for a typical dynamic model (2) is proved using the boundedness of solution, which accounts the finite time interval. Then, there exist system supersolutions si , ei , yi and
ri
satisfying
dsi de bp 1 (t ) si , i ke , dt dt dyi dr yi and i qri dt dt and are bounded on a time interval t [t0 , t f ] . Theorem 2: Given proposition 2 for a control problem with system of equations as in model (6), there exist an optimal control pair
r
* (1* , 2* ) S
that maximize the objective functional
Z (1 , 2 ) such that
max {Z (1 , 2 ) Z (1* , 2* )
(10)
(1 ,2 )S
Proof: In proving the above theorem, we invoke the result of (Thm. 4.1, pg. 68-69, [26]) to validate that the following conditions are satisfied: i)
The set of all controls i (t ), i 1, 2 are Lebesgue-integrable functions on [t0 , t f ] with values in the
iv)
admissible control sets and such that the corresponding state components are satisfied and non-empty. The control set S is convex and closed. The RHS of the state variables is continuous and bounded by a linear function with coefficients depending on proposition 2 and on the control variables. The integral of the objective functional is concave on S .
v)
There exist constants
ii) iii)
x1 , x2 0 and 1 such
that the integral
J (si , ei , 1 , 2 ) of
the objective
functional satisfies
J (si , e2 , 1 , 2 ) x2 x1 ( 1 2 ) 2 . 2
2
This conditions further leads to the invocation of result from (Thm. 9.2.1, pg. 182, [27]), which gives the existence of solutions of ODEs of equation (6) with bounded coefficients for condition (i). Then, we see that the solutions are bounded and thus, by definition the control set satisfies condition (ii). We notice that state system is bilinear in (1 , 2 ) , then the RHS of model (6) satisfies condition (iii) and are priori bounded.
Optimal Control Dynamics: Control Interventions for Eradication of Ebola Virus Infection
57
Furthermore, the integrand of our objective functional si (t ) ei (t ) [ 1 (1 ) 2 1 (2 ) 2 ] is concave on the A1 A2 admissible control set. So, the last condition is satisfied if
si (t ) ei (t ) [
1 1 2 2 (1 ) 2 (2 ) 2 ] x2 x1 ( 1 2 ) A1 A2
where x2 depends on the upper bound on si and
ei with x1 0 since 1 , 2 0 .
Therefore, there exists an
optimal control pair. At this point, following the result of Thm. 2, we can conveniently establish out optimality system and show that the system is unique. 4. Optimality System and Uniqueness The optimality system is a vital tool in the concept of optimal control problem. it is the optimality system that mirrors the biological and epidemiological behaviours of the model state system following the application of chemotherapies, where in this present case, treatment function have been constituted by our control interventions. Explicitly, growth rate or clearance rate of state variables are often determined by the presence of optimality system. The uniqueness we shall induce by stating a simple leading lemma and allow the proof for the uniqueness of the system for our readers.
4.1. Optimality System for Treated Ebola Model Here, it is important to note that the optimality system consists of the state system coupled with the adjoint system with the initial conditions and transversality conditions together with the derived optimal control pair. For our model, the adjoint system is given by
d1 L d2 L , dt si dt ei d3 L dt yi
and
,
d4 L . dt ri
The simplification of this adjoint system is also a consequence of results of model [26]. Then, taking equation (10), which gives the Lagrangian, the following theorem holds: Theorem 3: Given optimal control pair 1 , 2 and solutions si , ei , yi , ri of the corresponding state system *
*
(6), then there exist adjoint variables1 ,2 ,3 ,4 satisfying
*
*
*
*
Optimal Control Dynamics: Control Interventions for Eradication of Ebola Virus Infection
58
1 1 1[1* (t ) yi* (t )] 2 [1* (t ) yi* (t )] 2 2 k 32* (t )k
(11)
3 1 1[ (t ) s (t )] 2 [ (t ) s (t )] 3 4 4 1 1q 4 q * 1
* i
* 1
* i
* 2
where i (t f ) 0, i 1, 2,3, 4 is the transversality conditions and having 1 (t ) min max a1 , yi si (1 (t ) 2 (t )) , b1 A1 * 1
1 (t ) min max a2 , 3 (t )kei 4 (t ) yi , b2 . A2 * 2
Proof: The form of the adjoint equations and transversality conditions are standard results from the Pontryagin’s maximum principle [28]. Then, taken the differentiation of the Lagrangian as obtained by equation (10) together with the state system (6) with the optimal control pair (8) and (9) and the transversality conditions (11), we have the following optimality system:
si bp qri (t ) si (t ) (1 1* (t ))[ yi (t ) si (t )] ei (1 1* (t ))[ yi (t ) si (t )] ( 1 k )ei (t ) y (1 * (t ))ke (t ) ( ) y (t ) i
2
i
2
i
ri (1 2* (t )) yi (t ) ( 3 q)ri (t )
1 1 1[1* (t ) yi* (t )] 2 [1* (t ) yi* (t )] 2 2 k 32* (t )k 3 1 1[1* (t ) si* (t )] 2 [1* (t ) si* (t )] 3 4 2* 4 1 1q 4 q with 1 (t ) min max a1 , yi si (1 (t ) 2 (t )) , b1 A1 * 1
1 (t ) min max a2 , 3 (t )kei 4 (t ) yi , b2 A2 * 2
(12)
Optimal Control Dynamics: Control Interventions for Eradication of Ebola Virus Infection
where i (t f ) 0, i 1, 2,3, 4 and si (0) s(i )0 , ei (0) e(i )0 , yi (0) y(i )0 , ri (0) r(i )0 , for all
59
t t0 .
4.2. Uniqueness of Optimality System To establish the proof of the uniqueness of the optimality system, the following leading simple lemma (without proof) is necessary. Lemma 1: The function positive constants.
*
( x) (min(max( x, a, b)))
is Lipschitz continuous in x , where a b are some
Theorem 4: Given t f as sufficiently small time interval, then bounded solutions of the optimality system are unique. Proof: Omitted. Remark 4: The uniqueness and proof of the optimality system is a standard result, which can be found in models [29-31].
5. Numerical Simulations and Discussion Keeping in tune with the objective and scope of investigation, which border around control interventions as treatment functions studied as an optimality system, we shall accomplish this section by undertaking a number of simulations to validate our resulting optimality system as well as demonstrate the benefit on control intervention cost. We then collapse this section with the critical analysis of the outcome of our derived result. 5.1. Numerical Simulations In realizing our numerical simulations, we shall draw a number of computer programs based on model equations (12), (8) and (9), which completely describe the objective and scope of the study. Here, we shall explore the application of Runge-Kutter of order 4 in a Mathcad platform in the validation of the derived optimality system with which we mirror the biological maximization of the model susceptible and recovered index and as well, study the level of minimization of cost of corresponding treatment functions. For simplicity, since our optimal weight factors are assigned A1 2000, A2 25 with lower and upper bounds on treatment functions given as: a1 0, a2 0.2, b1 0.2, b2 0.8 such that ai 1,2 denotes lower bounds and bi 1,2 upperbounds,
we can conveniently generate several treatment schedules by constant
regularization until convergence is achieved. Furthermore, we vectored the state components for compatibility with chosen software as follows: Let {si (t ), ei (t ), yi (t ), ri (t ),1 (t ),2 (t ),3 (t ),4 (t )}
8
H i such that i 1
8
T
H i H1 ,..., H8 and i 1
satisfying initial values as in table 2. Then, for an Ebola treated model, the optimality system is depicted by fig. 3 (a-d) below:
Optimal Control Dynamics: Control Interventions for Eradication of Ebola Virus Infection
60
Fig.3(a-d). Graphical Simulations of Ebola Optimality System with
1* (t ), 2* (t ) as Treatment Functions.
From fig. 3(a-d), we study the epidemiological transmissibility and methodological application of control
interventions on Ebola virus infection with i (t ),i 1, 2 , as treatment functions.
Precisely, fig. 3(a)
investigates the performance index of the susceptible population under cogent structured control intervention of
1* (t ) .
The graphical simulation shows spontaneous convex-like inclination through the epidemic duration
with value 0.5 si (t ) 4.746cell / mm3 at t f 30days . From fig. 3(b), following the adherent to treatment function defined by the amount of i (t ),i 1, 2 , we investigate the biological response of exposed class to treatment schedule. The graph indicates gradual declination of the exposed class with initial onset value of ei 0.2 cell / mm3 decreasing to ei 0.05cell / mm3 after t f 30days . We note with interest, that within 21days of life-cycle of the Ebola virus, the exposed class under treatment surveillance had reduced by
ei (t ) 0.12cell / mm3 at t f 20days . Representing the infectious and removed class, fig. 3(c & d) investigate using 2 (t ) as treatment function, *
the biological dynamics of infectious Ebola virus. Here, fig.3(c) shows acidulous declination of the infectious population with value 0.2 yi (t ) 4.332 103 cell / mm3 at t f 30days . The efficacy of the treatment function within the active life-cycle of Ebola virus is seen as infectious population decline to as less as yi (t ) 0.01cell / mm3 at t f 20days . Finally, the trend of the removed class following the continuous
Optimal Control Dynamics: Control Interventions for Eradication of Ebola Virus Infection
subjection of patients to
61
2* (t ) treatment shows that the rate of removed (i.e. die) was on the increase at the
initial onset of infection with value at 0.1 ri (t ) 0.126cell / mm3 in the first t f 4days . The situation thereafter indicated gradual decline of removed class (i.e. infectious recovering) with declination of ri (t ) 0.06cell / mm3 at t f 20days and further declining to ri (t ) 0.031cell / mm3 after t f 30days . Furthermore, we ascertain the quantitative amount of each control pair of treatment function required for the eradication of the Ebola virus infection as simulated in fig. 4(a & b) below:
Fig.4(a-b). Graphical simulation of optimal control pair with
A1 2000, A2 25 .
Here, we show the amount of control pair of treatment functions required under the period of investigation. Accounting for any possible control intervention severities, treatment functions have been defined under optimal weight factors with lower and upper bounds limits specified in the domain (ai , bi ) [0.1], i 1, 2 . Of note, we see from fig. 4(a & b) that both exhibits smooth linear pair dual-like characteristics, which is typical of optimal dynamics. Fig. 4(a) exhibits the amount of intermediary intervention (as treatment function) used with value in the interval 0.3 1* (t ) 0.300015 for t 30days , which represent significantly small amount of control intervention at the susceptible and exposed class stage. Fig. 4(b) representing the secondary intervention demonstrates the amount of
2* (t ) required sustaining significant control of Ebola virus epidemic
with value 0.5 2* (t ) 6.5 for t 30days . Finally, we investigate as depicted by fig, 5 below, our objective functional, which obviously describe the optimal control pair in relation to the susceptible and removed class with respect to applied control interventions.
62
Optimal Control Dynamics: Control Interventions for Eradication of Ebola Virus Infection
Fig.5. Graphical Simulation of Objective Functional for Pair Control Treatment Functions with
A1 2000, A2 25 .
Fig. 5 shows somewhat smooth linear inclination depicting the overall optimal control required of the commercial value for the treatment functions that maximize the susceptible population devoid of Ebola virus. Here, we observe that for treatment duration of t f 30days , the overall commercial cost of control interventions is at 0.8 Z (1 , 2 ) 2.824 1060 . 5.2. Discussion In this present study, we are confronted with the investigation of the efficacy of existing control interventions for the eradication of Ebola virus infection under categorized two predominant indicators – intermediary and secondary interventions, explicitly considered as the main Ebola treatment functions in the absent of outright medical cure. Furthermore, we seek and presented an extended model formulated around the application of intermediary and secondary interventions as Ebola virus infections treatment measures with the model presented as an optimal control problem. The introduction of optimal control theory for an optimal control problem achieved the vested scope of the study, which is the maximization of the performance index based on the level of concentration of susceptible population devoid of Ebola infection as well as the rate of recovery of infectious class under minimized system cost on control interventions, while suppressing the rate of exposed class and the infectious population. We performed our analysis using classical Pontryagin’s maximum principle aided with the establishment of model state variables positivity and boundedness of solutions. The derivation of the existence of an optimal control pair, optimality system and validation of uniqueness of optimality system were conducted within the ambit of our chosen numerical methods. In the validation of the derived result, a number of numerical simulations were conducted using RungeKutter of order 4, in a Mathcad platform. Thus, we sought to the available accuracy the possible solutions that triggered the positive impact of existing control interventions in the eradication of Ebola virus infection. The simulative results as depicted by fig. 3(a), shows maximal increase in the level of susceptible population devoid of Ebola virus following cogent introduction and sustained dual treatment functions within the ambit of Ebola life-cycle of 21days . Evidently, sample population of si (t ) 0.5cell / mm3 was significantly increased to
si (t ) 4.746cell / mm3 with sustenance possibilities after t f 30days . Under the same time interval and similar treatment conditions, the exposed class was reduced to a minimum of ei (t ) 0.05cell / mm3 . Moreso, the efficacy of the system model is clearly depicted by the acidulous reduction of Ebola infectious class to an insignificant value of yi (t ) 4.332 103 with possibility of outright eradication after t f 30days (see fig.
Optimal Control Dynamics: Control Interventions for Eradication of Ebola Virus Infection
63
3(c)). The decrease in the rate of removed class after initial raise in the first 4days is a true vindication of the increase in the performance index of the susceptible class. Furthermore, in realization of the second phase of optimal control criteria, we investigated the minimization of cost effect on treatment functions as depicted by figures (4 & 5) respectively. Fig. 4(a-b) portrait maximal amount of each control interventions required for the maximization of susceptible population from Ebola virus infection. The result here indicated that less amount of 1 (t ) was required while significant amount of 2 (t ) *
*
was needed for the achievement of maximal output by our model. Finally, fig. 5, pictured the commercial cost value of the pair treatment functions to achieve the state result. 6. Conclusion In this study, we present a necessary and sufficient optimal control model, analysed using classical numerical methods to produce as accurate as possible, a mathematical result that depicted the efficacy of structured control interventions for the eradication of Ebola infection epidemic. The study was vested with the investigation of the efficacy of existing intermediary and secondary interventions as substantial Ebola infection treatment functions following the absent of outright medical cure. The introduction of optimal control technique acidulously maximized susceptible population devoid of Ebola virus infection and as well x-rayed the rapid recovery of the removed class, which were subsequently recruited to the susceptible class. Furthermore, results of numerical analysis proved maximal suppression of both exposed and infectious groups under minimized control cost. The investigation thus, encourage the continuous and cogent utilization of identified treatment functions for the eradication of Ebola infection in the absent of yet an outright medical cure.
References [1] [2]
[3] [4]
[5] [6] [7]
[8]
[9] [10]
Bassey E. B. (2017) On Mathematical Model of Transmission of Ebola Virus: Impact of Control Intervention. International Journal of Advances in Computer and Electronics Engineering, 2, 8, 8-14. Chowell, G., Hengartner, N. W., Castillo-Chavez, C., Finimore, W, P. , Hyman, J. M. (2004) The Basic Reproductive Number of Ebola and the Effect of Public Health Measure: The case of Congo and Uganda. Journal of Theoretical Biology, 299, 1, 119-126. National Reference Center for Viral Hemorrhagic Fevers (2014) Emergence of Zaire Ebola Virus Disease in Guinea. N. Engl. J. Med., 371: 1418-25. Centers for Disease Control (CDC). Ebola Hemorrhagic Fever: Table showing known cases and Outbreaks in chronological order. Retrieved date: [09, February, 2017], online available at: http://www.cdc.gov/ncidod/dcvrd/spl/mnpage/dispades/ebotabl.htm World Health Organization (WHO). Ebola Hemorrhagic Fever: Disease Outbreaks Retrieved date: [09, February, 2017], online available at: http://www.who.int/disease-outbreak-news/disease/A98.htm Chowell, G. and Nishiura, H. (2014) Transmission dynamics and control of Ebola virus disease (EVD): are views. BMC Medicine, 12, 196, 1-16. Bringing Ebola under control: how modeling transmission can help. Retrieved date: [10, February, 2017], online available at: http://www.biomedcentral.com/biome/bringing-ebola-under-control-howmodeling-transmission-can-help Fasina F. O., Shitu A., Lazarus D., Tomori O.., Simonson Lone, V. C., and Chowell G. (2014) Transmission dynamics and control of Ebolavirus disease outbreak in Nigeria. Eurosurveillance, 19, 40, 1-7. World Health Organization (2014) Ebola virus disease, West Africa” Update, 2014. Pearson, J. This Mathematical Model Show How Ebola Could Wipe Us Out. Retrieved date: [10,
64
[11]
[12] [13] [14]
[15] [16] [17] [18] [19] [20]
[21] [22] [23] [24]
[25]
[26] [27] [28]
[29] [30] [31]
Optimal Control Dynamics: Control Interventions for Eradication of Ebola Virus Infection
February, 2017], online available at: http://www.motherboard.vice.com/en_uk/read/a-2006mathematical-model–shows-how-ebola-could-wipe-us-out Centers for Disease Control and prevention (CDC): Current Ebola outbreak in West Africa. Retrieved date: [12, February, 2017], online available at: http://www.cdc.gov/ncidod/vhf/ebola/exposure/index.html World Health Organization (2014) Ebola Virus Disease in West Africa – The First 9 Months of Epidemic and Forward Projection. N. Engl. J. Medical, 371, 160, 1481-1495. Breman, J. G., Piot, P., Johnson, K. M., et al. (1977) The Epidemiology of Ebola Hemorrhagic Fever in Zaire. Proc Int Colloquium on Ebola Virus. Inf held in Antwerp, Belgium. Mathematical model to study the outbreak of Ebola. Retrieved date: [11, February, 2017], online available at: https://mtbi.asu.edu/sites/default/files/Mathematical_Models_to_Study_the_Outbreaks_of_Ebola.pdf World Health Organization (2014) Ebola Virus Disease: Cuban Medical Team Heading for Sierra Leone. Retrieved date: [16 November, 2017], Online available at: http://www.who.int/esr/disease/ebola/en/ Chertow, D. S., Klrine, C., Edwards, J. K., Scaini, R., Guilimi, R. and Sprecher, A. (2014) Ebola virus disease in West Africa – Clinical Manifestation and Management. N Engl J. Med., 371, 2054-2057. Birmindham, K. and Cooney, S. (2002) Ebola: Small, but real progress (news feature). Nature Med.,.8, 302-313. Centers for Disease Control, GA, World Wide Web Page. Retrieved date: [11, February, 2017], online available at: http://www.cdc.gov/ncidod/diseases/virifvr/ebolainp.html National Reference Center for Viral Hemorrhagic Fever (2014) Emergence of Zaire Ebola Virus Disease in Guinea. N. Engl. J. Med., 371: 1418-1425. World Health Organization (2017) Ebola Virus Disease: Fact Sheet Update. Antibiotics Medical Centre. Retrieved date: [16, November, 2017], Online available at: http://who.int/medicacentre/factsheets/fs.103/en/ Gire, S. K., et al. (2014) Genomic Surveillance Eradicates Ebola Virus Origin and Transmission during the 2014 Outbreak. Science, 345 (6202): 1369-1372. Culshaw, R., Ruan, S. and Spiteri, R. J. (2004) Optimal HIV Treatment by Maximizing Immune Response. Journal of Mathematical Biology, 48, 5, 545-562. Hale, J. and Verduyn Lunel, S. M. (1993) Introduction to Functional Differential Equations. Applied Mathematical Science, 99, Springer-Verlag, New York. Bassey E. Bassey (2017) Optimal control model for immune effectors response and multiple chemotherapy treatment (MCT) of dual delayed HIV - pathogen infections. SDRP Journal of Infectious Diseases Treatment & Therapy, 1(1) 1-18. Adams, B. M., Banks, H.T., Hee-Dae K. and Tran, H.T. (2004) Dynamic Multidrug Therapies for HIV: Optimal and STI Control Approaches. Retrieved date: [24 November, 2017], Online available at: http://citeseerx.ist.psu.edu/viewdoc/summary?doi=10.1.1.400.9056. Fleming, W. and Rishel, R. (1975) Deterministic and Stochastic Optimal Control. Springer-Verlag, New York. Lukes, D. L. (1982) Differential Equations: Classical to Controlled, Mathematics in Science and Engineering. Academic Press, New York. Pontryagin, L. S., Boltyanskii, V. G., Gamkrelidze, R.V. and Mishchenko, E. F. (1986) The Mathematical Theory of Optimal Process, vol. 4. Gordon and Breach Science Publishers, New York, NY, USA, 4-5. Fister, K. R., Lenhart, S. and McNally, J. S. (1998) Optimizing chemotherapy in an HIV Model. Electr. J. Diff. Eq., 32, 1-12. Kirschner, D. and Webb, G. F. (1996) A Model for Treatment Strategy in the Chemotherapy of AIDS. Bull. Math. Biol., 58: 367-390. Bassey, B. E. (2017) Dynamic Optimal Control Model for Periodic Multiple Chemotherapy (PMC)
Optimal Control Dynamics: Control Interventions for Eradication of Ebola Virus Infection
65
Treatment of Dual HIV - Pathogen Infections. J. Anal. Pharm. Res., 6(3): 00176. DOI: 10.15406/japlr.2017.06.00176, 1-22.
Authors’ Profiles Bassey Echeng B., a Computational Mathematics and Informatics specialist from Kuban State University, Krasnodar Russia and M.Sc. in Industrial Mathematics, Federal University of Agriculture, Makurdi, Nigeria and B.Sc in Mathematic/Statistics, University of Calabar, Calabar, Nigeria. He is a lecturer and presently the Co-coordinator – Head of Pre-degree program, Cross River University of Technology, Calabar, Nigeria. Published more than 24 papers in reputed journals, including monographs’ and author of textbooks. Research interests include but not limited to: Mathematical modeling, numerical methods; simulation analysis, mathematical methods, computer technology and programming.
Bassey Delphine Rexson, born 1996, a project student of the Department of Botany, University of Calabar, Nigeria. She is currently working on a number of articles to be published in the nearest future. Her area of interest includes but not limited to modelling of infectious diseases and plant growth.
How to cite this paper: Bassey B. Echeng, Bassey Delphine Rexson,"Optimal Control Dynamics: Control Interventions for Eradication of Ebola Virus Infection", International Journal of Mathematical Sciences and Computing(IJMSC), Vol.4, No.3, pp.42-65, 2018.DOI: 10.5815/ijmsc.2018.03.04