Optimal Foraging in Semantic Memory Thomas T. Hills (
[email protected]) Center for Cognitive and Decision Sciences University of Basel, Switzerland
Peter M. Todd (
[email protected]), Michael N. Jones (
[email protected]) Department of Psychological and Brain Sciences Indiana University, Bloomington, IN, 47405 USA
A number of studies have also found relationships between animal and human foraging strategies when patch boundaries are determined by the external environment (Wilke et al., 2009; Hutchinson et al., 2008; Payne et al., 2007; Pirolli, 2007). Here, we investigate whether retrieval from semantic memory in a fluency task also follows an optimal foraging policy—called the marginal value theorem—when patches are defined strictly internally, by the structure of semantic memory. The marginal value theorem has been found to describe the search policies of a number of animals (Charnov, 1976; Stephens & Krebs, 1987) as well as the search strategies of humans in external information foraging (Pirolli, 2007). The basic assumptions of the marginal value theorem are that resources are distributed in patches, and that moving from one patch to another involves a travel time. The marginal value theorem seeks to maximize the return from foraging defined as the average rate of energy intake, R, over all patches:
Abstract When searching for items in memory, people explore internal representations in much the same way that animals forage in space. Results from a number of fields support this notion at a deeper level of evolutionary homology, with evidence that goal-directed cognition is an evolutionary descendent of animal foraging behavior (Hills, 2006). Is it possible then that humans forage in memory using similar search policies to the way that animals forage in space? To investigate this, we examine how people retrieve items from memory in the category fluency task: Participants were asked to retrieve as many types of animals from memory as they could in 3 minutes. Clusters or patches of these items, along with their semantic similarity and frequency, were found with an automatic Wikipedia corpus analysis using the BEAGLE semantic memory model (Jones & Mewhort, 2007), and via hand-coded category membership from Troyer et al. (1997). Participants did not seem to use static patch boundaries, such as ‘pets’, to search memory, but instead used fluid patch boundaries that were updated with each new item retrieved. We found that participants leave patches in memory when the marginal (i.e., current) rate of finding items is near the average rate for the entire task, as predicted by optimal foraging theory. Furthermore, participants appear to search within patches using item similarity, but decide where to “land” when moving between patches using item frequency.
R=
∑ p E(Y ) ∑ p E(τ ) + T i
i
i
i
i
(1)
i
In the numerator, the summed product of the relative frequency pi of a given patch i and its expected payoff value E(Yi ) defines the cumulative payoff over all patches. The denominator represents the total time spent foraging, which is a sum of the average travel time between patches T and the summed product of the expected time spent foraging in each patch type E(τ i ) with the frequency of encounter with a patch of that type. The central result from the marginal value theorem is that the optimal foraging policy is to leave patches when the instantaneous rate (or marginal value) of resource intake is equal to the long-term average resource intake R over all patches. The marginal value theorem can be applied to foraging in human memory, given two prerequisites: First, that we have a task in which individuals forage among patch-structured memory representations; and second, that we have an a priori method for determining what those patches in memory are. The task we use here is called the “semantic fluency” or “category fluency” task, and is commonly used in both clinical (Tröster et al., 1989) and experimental settings (Bousfield & Sedgewick, 1944). Participants or patients are simply asked to produce as many instances of some
Introduction Animals often search for resources that occur in spatial patches, such as the berries on a bush or a cluster of clams at the beach. Humans also search for cognitive resources that can be seen as patchy with respect to some other metric, such as memory representations of words grouped by semantic similarity, or sets of solutions that can be navigated by working memory processes in a problemsolving task. Several lines of evidence have given rise to the idea that search in such cognitive spaces shares fundamental properties with foraging in physical spaces, based on an argument from evolutionary homology. That is, these search properties share conserved neural substrates, with similar neuro-molecular processes guiding spatial search in animals and modulating the control of human attention (Hills, 2006). Furthermore, they appear to involve a generalized cognitive search process, based on evidence that humans can be primed to search differently in lexical problem spaces following experience searching in different distributions of spatial resources (Hills et al., 2008b).
620
clustering and switching, described earlier. In the second method, the fluid patch model, subcategories are traversed by searching relative to the most recent term—participants do not choose a category like ‘pets’ and exploit it, but simply search for a next animal term near the current one. Based on these two possible methods for cognitive search in memory, we use the categories in Troyer et al. (1997) to define transitions across patch boundaries in the following ways. In the static patch model, a switch occurs when a person produces an item in a new subcategory, that is, one that does not share at least one common subcategory membership with all items since the last switch (or the beginning of the trial). Hence, in the static patch model, all items in a patch must share at least one common subcategory. For the fluid patch model, a switch occurs when two consecutive entries do not share any subcategory; a fluid patch is a sequence of items with at least one overlapping subcategory between each neighboring pair. When two consecutive items don’t share a subcategory, this is a switch in both fluid and static patch models. However, in the static patch model, the last item must also share at least one common subcategory with all items since the last patch. Thus, fluid switches are also static switches, but the opposite need not be true.
category (e.g., “animals”) as possible in a fixed period of time. The early studies using this task found that word productions was distributed in clusters, with groups of similar words being produced together, and pauses occurring between clusters. This led others to suggest a memory retrieval process composed of two elements: “clustering”—the production of words in a semantic subcategory—and “switching”—making the transition from one subcategory to another (Troyer et al., 1997). These two processes capture the basic assumptions of the marginal value theorem, harvesting items within a patch and travel between patches. We used two methods for characterizing the semantic structure of the memory landscape over which individuals foraged. The first is the BEAGLE model of Jones and Mewhort (2007), which we trained on a Wikipedia corpus. BEAGLE provides measures of pairwise similarity between words based on their co-occurrence in text, and offers a putative search space for the retrieval of category-specific instances from memory. As we describe below, the BEAGLE representation offers numerous methods for analyzing search in memory, while solving many of the technical difficulties previously associated with characterizing item similarity in memory (Romney et al., 1993; Bousfield & Sedgewick, 1944). As a second source of information about semantic memory structure, we used the hand-coded subcategorization of animal terms “derived from the actual patterns of words generated by participants during test performance” on fluency tasks (Troyer et al., 1997). The 22 subcategories include subcategories like “African animals”, “birds”, and “beasts of burden”. Participants’ patterns of transitions through these subcategories correlate with their individual characteristics such as age and clinical condition (e.g., Alzheimer’s or Parkinson’s disease; Troyer et al., 1997; Troyer et al., 1998). As demonstrated by studies of neutral and adaptive evolution with multiple genetic loci (Gavrilets, 1997; Kauffmann & Levin, 1987), movement in high-dimensional spaces is likely to violate our intuitive assumptions about nearness. In this respect, memory is no different. Memory items can reside in multiple patches and multiple subcategories at the same time; consequently, moving from one subcategory to another does not necessarily require leaving one patch to travel to another depending on how the patches are defined (Barsalou, 1983; Hills et al., 2008a). Therefore, before investigating the possibility that participants forage in memory using optimal foraging strategies, it is first necessary to understand how participants employ semantic clusters in terms of subcategories. We explored two possible cognitive hypotheses (Figure 1). The first, which we call the static patch model, is based on the idea that a person first decides on a subcategory, say ‘pets’, and then searches this subcategory until she feels it is sufficiently depleted (e.g., no more terms can be readily retrieved), before switching to a new subcategory. This is identical to the Troyer et al. (1997) process model of
Figure 1: Illustration of different cognitive patch departure rules. The sequential entries are represented by e1, e2, etc. For the static patch model, the transition from “cat” to “lion” is considered a switch because “lion” is not in the category intersection of “dog” and “cat”, i.e., it is not a pet. The fluid patch model assumes that switches are always determined relative to the previous item alone. Thus, “cat” to “lion” is not a switch, because both are felines. The transition from “lion” to “robin” is considered a switch by both models. Though within patch transitions may be driven by semantic similarity, between patch transitions may represent search along other dimensions besides similarity. One candidate for between patch transitions is word frequency. Word frequency predicts a number of aspects of lexical decision times, with, for example, higher frequency words retrieved faster than lower frequency words (Murray & Forster, 2004). We hypothesize that the first word following a switch between patches will be of higher frequency than items immediately before or after that word. In what follows, we first examine how individuals use patch boundaries in memory to navigate the semantic
621
there was a mean of 4157.2 static switches (SD = 25.8) and 4113.8 fluid switches (SD = 23.2). Because there were far fewer switches in our observed data, we can conclude that participants were far more likely than one would expect by chance to follow an entry in one subcategory with another entry in the same subcategory. If people use a process similar to the static patch model— first identifying a subcategory and then depleting it—then static switches should co-occur with fluid switches at the frequency observed in the random data. However, if people use a process similar to the fluid patch model, then when crossing static patch boundaries they will be biased towards choosing items that are within fluid patch boundaries. In other words, the fluid patch model produces a lower proportion of fluid to static patch switches than the static patch model—the latter producing no more static-not-fluid switches than we would expect by change. The fluid patch model is supported by this analysis: from the randomized data, 98.9% of random static switches were also random fluid switches, whereas in our observed data only 94.7% of static switches were also fluid switches. Using a sign-test, the odds of observing our data if participants were using a static patch model are extremely low (p < 0.0001).
memory landscape. Following this, we examine how the patterns of memory retrieval in the semantic fluency task are consistent or inconsistent with the predictions of optimal foraging in a patchy spatial environment.
Methods Participants were 141 undergraduates at Indiana University, Bloomington, who participated for course credit. Participants sat in front of a computer and followed instructions on-screen. They were asked to type in as many items in a given category as they could in three minutes; timing of entries was also recorded. Entries were corrected later for spelling. Participants saw multiple categories in a random order, but there was no correlation between order of category appearance and the number of items entered (p = 0.32). Here we focus solely on the category “animals” (for which we have the predetermined subcategories of Troyer et al., 1997). Participants produced 373 unique animals. We identify category transitions using the two methods outlined above for the static and fluid patch models. To compare participant’s production orders against the structure produced by random orders, we randomly rearranged each participant’s entries 10 times and recomputed category transitions on the randomized data. To compute pairwise word similarity scores, we use BEAGLE’s representation of words as holographic vectors (Jones & Mewhort, 2007). These vectors contain information about a word’s context and order with respect to other words this word is likely to appear with. BEAGLE creates the memory representation for a word by first assigning it a random vector, and then updating this memory representation using the random vectors of the other words that this target word appears with in each sentence of the corpus. After training on the Wikipedia corpus, BEAGLE’s memory representations were used to compute the pairwise cosine similarity matrix for a list of 772 animals, which contained the 373 unique animals produced by our participants plus 399 additional animal names found in the Wikipedia corpus. Adding the extra animals provides the most detailed representation given our current corpus.
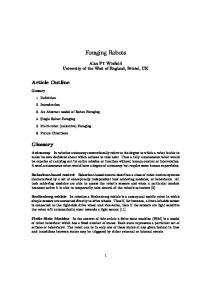
Figure 2. Comparison of inter-item retrieval time (IRT) for different transition classes. Static-not-fluid switches are the only class in dispute. Reference is the IRT of transitions taken from the same reference class as the static-not-fluid switches. Error bars are SEM.
Results Evaluating static and fluid switch models Participants produced a total of 5191 valid animal entries, with a mean per participant of 36.8 (SD = 8.5). Using the static patch model, there was a mean of 18.2 switches per participant (SD = 4.7), and 17.2 (SD = 4.5) using the fluid patch model. Mean items retrieved per patch for the static and fluid patch models were 2.0 (SD = 0.5) and 2.1 (SD = 0.5), respectively. In the present case, out of the 2559 switches identified by the static patch model, only 134 were static but not fluid (static-not-fluid) patch switches; thus, there were 2425 fluid patch switches. To test whether people engaged in subcategory-based search, we first established that patch switches were less frequent than we would expect by a random production process. Over the 10 randomizations for each participant,
Another way of evaluating the switch models is to examine how long it takes to retrieve items when moving within or between patches. True patch switches should produce longer production times than items that are within shared patch boundaries, because patch switches involve both a giving up process, a travel process, and retrieval from the new patch. This requires that we compare the inter-item retrieval times (IRTs) of the static-not-fluid switches with an appropriate reference class of IRTs from the remaining data, to evaluate whether they are significantly longer and hence indicative of a true switch between patches. If this is not the case, then we have evidence that the subcategory-
622
IRT for the first item in a patch comprises the time spent looking (unsuccessfully) for another item in the previous patch plus the travel time to a new patch plus the search and handling time for the first item. Figure 3 shows that indeed only the IRTs for first item in a patch exceed the participant’s mean IRT. We assume that when the time spent looking for an item in the previous patch without finding one exceeds the long-term average IRT, people give up and switch to a new patch, incurring the extra switching times on top of the failed “giving-up” time. To examine this relationship further, we tested, on a perparticipant basis, whether the distribution of IRTs for the single item immediately preceding a switch was significantly different (using a one-sample t-test) from that participant’s own long-term average IRT—with the expectation that participants’ pre-switch IRTs should be at or below their long-term average IRT. Figure 4 presents the results for this analysis. Only 9 of our 141 participants were significantly different from their long-term average IRT, and all of these pre-switch IRTs were less than their longterm averages.
defined static switches do not correspond to actual patch switches by our subjects. The mean IRT of all fluid switches was 6.4s (SD = 6.3). The 134 static-not-fluid switches had a mean IRT of 4.8s (SD = 4.6). As the variances are different, we used a Wilcoxon rank sum test, and found that static-not-fluid switches were significantly shorter than switches identified by the fluid patch model (W = 142563, p < 0.001). The mean IRT for transitions that were not identified as a switch by either model was 3.8s (SD = 3.8), and a similar analysis finds that the static-not-fluid switches were significantly longer than these (W = 195668, p < 0.001). However, the IRT for an item is influenced by where it occurs in a patch—with earlier items taking less time to produce than later items. After weighting the non-switch IRTs so that they came from the same reference class as the static-notfluid switches (“Reference” in Figure 2), the mean expected IRT is 5.0s. This was not significantly different from the IRT of our static-not-fluid switches, using a one-sample ttest (t = -0.6726, df = 133, p = 0.50). In sum, the evidence so far suggests that participants are using a fluid patch process to identify what item to produce next.
Figure 4: The long-term average IRT versus the participant’s mean IRT prior to a switch. The longterm IRT is calculated by dividing the participant’s total time by the total number of entries found. Open circles represent mean IRTs that were significantly different from the long-term average.
Figure 3. The mean ratio between the inter-item retrieval time (IRT) for an item and the participant’s mean IRT over the entire task, relative to the order of entry for the item. The dotted line represents the mean IRT for the entire task, i.e., the long-term average resource intake over all patches. Error bars are SEM.
Marginal value theorem and cosine similarity The second source of data for representing the putative search space in semantic memory mentioned earlier is word co-occurrence in text. To evaluate the possibility that participants are sensitive to similarity in their production order, we performed the following analysis. We first note that the mean similarity across all pairs of animals in our matrix of 772 animals was 0.15 (SD = 0.07). The mean similarity between successive items across participants was 0.36 (SD = 0.02). We also note that it took less time to produce a word that is more similar to the preceeding word: BEAGLE’s cosine similarity and the IRT for a word were significantly negatively correlated (r(5106)=-0.22; p < 0.001; r2=0.05).
Marginal value theorem and the Troyer et al. categories As described in the introduction, the key proposal of the marginal value theorem is that the optimal departure time for a patch should be when the current intake rate in the patch falls to the global intake rate. Figure 3 shows IRTs (inverse of intake rates) for ordered item submissions normalized by the participants’ long-term average IRT, where ‘1’ is the first item produced after a fluid patch switch and ‘-1’ is the last item produced before a fluid patch switch. A perfect fit with the marginal value theorem would find that item IRTs increase (and hence intake rates decrease) towards the switch, but do not exceed the longterm average IRT until the first item after the switch. The
623
We also evaluated the static-fluid hypothesis comparison using cosine similarity in a similar way to our earlier analysis with IRT. Fluid switches have a cosine similarity of 0.32 (SD = 0.10), and transitions which are not switches have a mean similarity of 0.39 (SD = 0.14). Static-not-fluid switches have a similarity of 0.34 (SD = 0.12). As in the IRT analysis , the static-not-fluid switches are significantly different from fluid switches but are not different from the reference class of non-switches (data not shown). Again, this indicates that the static-not-fluid switches do not correspond to “true” patch switches, and supports the fluid switch model. Assuming cosine similarity approximates semantic relatedness, we should observe that words on either side of fluid patch boundaries are less similar than within-patch transitions. Figure 5 shows that words straddling patch boundaries are indeed significantly less similar than words produced following a patch boundary. Using the same reasoning, we can also investigate the marginal value theorem independently of the Troyer et al. (1997) subcategories, by defining switches as happening between words with low pairwise similarity. To do this, we computed the distribution of ratios of all sequential word-pair cosine similarities within each single participant’s data. For example, given a word series A B C D, we found the similarity between each pair, s(A,B), s(B,C), s(C,D). We then computed the ratios, r1=s(B,C)/s(A,B), r2=s(C,D)/s(B,C), allowing us to identify transitions that were low similarity followed by high similarity (as in Figure 5). We then compared the corresponding similarity ratio to the mean ratio for the same participant (using a one-sample t-test), categorizing the first word in any ratio that was significantly below the mean as the first word after a switch. Using this method, participants had a mean of 14.16 (SD = 4.68) switches over 3 minutes. Approximately 54% of these were also fluid patch switches using the Troyer subcategories. Examining the mean IRTs before these cosine-defined switches for our participants against their long-term average IRTs (as we did in Figure 4), 15 participants had pre-switch IRTs that were significantly different from their long-term average IRTs, and all of these pre-switch IRTs were less than their longterm averages. This again supports the notion that internal patch search adheres to the marginal value theorem.
Figure 5. Mean ratio (and SEM) of pairwise similarity for an item to a participant’s mean similarity over all items, by entry position (as in Fig. 3). E.g., the bar above ‘1’ indicates the relative similarity between the first item in a patch and the last item in the preceding patch.
Figure 6. The mean ratio (and SEM) of log(frequency) between a given item and the first item following a patch boundary, in item order relative to the patch switch. (The ratio for the first item to itself is thus 1.)
Are transitions between patches based on frequency? To evaluate whether or not people are searching along a frequency dimension when they move between patches, we examined the frequency ratio of items relative to the frequency of the item following the nearest fluid subcategory-defined patch boundary. Figure 6 shows that frequency of produced items falls as people move through a patch, and that the first item is typically the most frequent item in the patch. This supports the hypothesis that between-patch transitions are not strictly random, but may involve the use of frequency or a correlated property (e.g., see Adelman et al., 2006).
Discussion The main goals of the present work are to identify how people might be using the structure of semantic memory to guide internal memory search and to investigate the possibility that they are searching optimally given certain assumptions about this structure. In this respect, this work makes three novel contributions to memory research. First, our results strongly question what we call the static patch model, presented by Troyer et al. (1997), in which people use a two-component retrieval process composed of
624
Hills, T., Maoune, J., Sheya, A., Maoune, M., Smith, L. (2008a). Categorical structure in early semantic networks of nouns. In V. Sloutsky, B. Love, and K. McRae (Eds.) Proceedings of the 30th Annual Conference of the Cognitive Science Society (pp. 161-166). Mahwah, NJ: Lawrence Erlbaum. Hills, T., Todd, P.M., Goldstone, R.L. (2008b). Search in external and internal spaces: evidence for generalized cognitive search processes. Psychological Science, 19(8), 676-682. Hutchinson, J.M.C., Wilke, A., and Todd, P.M. (2008). Patch leaving in humans: can a generalist adapt its rules to dispersal of items across patches? Animal Behavior, 75, 1331-1349. Jones, M.N., & Mewhort, D.J.K. (2007). Representing word meaning and order information in a composite holographic lexicon. Psychological Review, 104, 1-37. Kauffman, S., & Levin, S. (1987). Towards a general theory of adaptive walks on rugged landscapes. Journal of Theoretical Biology, 128, 11-45. Murray, W.S., & Forster, K.I.(2004). Serial mechanisms in lexical access: The rank hypothesis. Psychological Review, 111(3), 721–756. Payne, S.J., Duggan, G.B., and Neth, H. (2007). Discretionary task interleaving: Heuristics for time allocation in cognitive foraging. Journal of Experimental Psychology: General, 136(3), 370-388. Pirolli, P. (2007). Information Foraging Theory: Adaptive Interaction with Information. Oxford University Press, New York, NY. Romney, A.K., Brewer, D.D., & Batchelder, W.H. (1993). Predicting clustering from semantic structure. Psychological Science, 4, 28-34. Stephens, D.W., & Krebs, J.R. (1986). Foraging theory. Princeton, NJ: Princeton University Press. Tröster, A. I., Salmon, D. P., McCullogh, D., & Butters, N. (1989). A comparison of the category fluency deficits associated with Alzheimer’s disease and Huntington’s disease. Brain and Language, 37, 500-513. Troyer, A.K., Moscovitch, M., & Winocur, G. (1997). Clustering and switching as two components of verbal fluency: Evidence from younger and older healthy adults. Neuropsychology, 11, 138-146. Troyer, A.K., Moscovitch, M., Winocur, G., Leach, L., & Freedman, M. (1998). Clustering and switching on verbal fluency tests in Alzheimer’s and Parkinson’s disease. Journal of the International Neuropsychological Society, 4, 137-143. Wilke, A., Hutchinson, J.M.C., Todd, P.M., & Czienskowski, U. (In press). Fishing for the right words: Decision rules for human foraging behavior in internal search tasks. Cognitive Science, 33, 497-529.
identifying subcategories and then switching between them. When compared with randomized data, our participants produced fewer fluid patch switches than they should have if they were using a static patch model. Also, static-notfluid switches did not take any longer to produce than nonswitches in the same reference class. Our results support the fluid patch model, in which patches are always defined locally based on similarity with the last exemplar, rather than being defined in terms of subcategory membership. Second, we also show—using two separate measures of patch boundaries—that humans do not appear to be significantly different from optimal in terms of their foraging strategy when retrieving items from semantic memory. That is, they appear to transition between patches at approximately the point where their best estimate of their current intake rate (the most recent IRT) is equivalent to their long-term average IRT. However, there is much work to be done to test this preliminary assessment. Finally, we identify a possible dimension along which new patches are found after departure from previous patches: word frequency. The fact that similarity is very low at patch boundaries suggests that, while participants may use similarity within patches, they do not do so between patches. While word frequency is also correlated with other lexical properties that may belie its predictive power (e.g., Adelman et al., 2006; Griffiths et al., 2007), our finding of frequency as a predictor establishes that word patches are not sought randomly in memory. In summary, we find evidence that human memory search can be conceived of as an optimal foraging strategy in a patchy environment. Searching for words and searching for berries may thus share similar underlying mechanisms.
References Adelman, J.S., Brown, G.D.A., Queseda, J. F. (2006). Contextual Diversity, Not Word Frequency, Determines Word-Naming and Lexical Decision Times. Psychological Science 17(9), 814-823. Barsalou, L.W. (1983). Ad hoc categories. Memory & Cognition, 11(3), 211-227. Bousfield, W.A., & Sedgewick, C.H. (1944). An analysis of sequences of restricted associative responses. The Journal of General Psychology, 30, 149-165. Charnov, E.L. 1976. Optimal foraging, the marginal value theorem. Theoretical Population Biology, 9, 129–136. Gavrilets, S. (1997). Evolution and speciation on holey adaptive landscapes. Trends in Ecology and Evolution, 12(8), 307-312. Griffiths, T., Steyvers, M., Tenenbaum, J. (2007). Topics in Semantic Representation. Psychological Review, 114(2), 211-244. Hills, T. (2006). Animal foraging and the evolution of goaldirected cognition. Cognitive Science, 30, 3-41. Hills, T. & Adler, F. (2002). Time’s crooked arrow: optimal foraging and rate-biased time perception. Animal Behavior, 64, 589-597
625