UNIVESITY OF CALIFORNIA. DAVIS. Approved: Professor Kent Wilken (Chair). Professor Charles Martel. Professor Zhendong Su. Committee in Charge. 2006 ...
Optimal Global Instruction Scheduling Using Enumeration by GHASSAN OMAR SHOBAKI B.S.EE (University of Jordan, Amman, Jordan) 1993 M.S.EE (University of Houston, Houston, Texas) 1997 M.S.CS (University of California, Davis) 2002
DISSERTATION Submitted in partial satisfaction of the requirements for the degree of DOCTOR OF PHILOSOPHY in Computer Science in the OFFICE OF GRADUATE STUDIES of the UNIVESITY OF CALIFORNIA DAVIS Approved:
Professor Kent Wilken (Chair)
Professor Charles Martel
Professor Zhendong Su Committee in Charge 2006
i
Optimal Global Instruction Scheduling Using Enumeration
Copyright 2006 by Ghassan Omar Shobaki
This research was supported in part by a University of California dissertation-year fellowship for the academic year 2005/2006
ii
ABSTRACT
Instruction scheduling is one of the most important compiler optimizations. An instruction scheduler reorders instructions to improve performance by minimizing pipeline stalls. Traditional approaches to instruction scheduling were based on heuristics. Over the past decade, however, a number of researchers have proposed optimal solutions to instruction scheduling. This dissertation presents the first set of algorithms to optimally schedule two global instruction scheduling regions: traces and superblocks. A global scheduling region is a collection of basic blocks that a compiler schedules simultaneously to exploit instruction-level parallelism (ILP) across basic block boundaries. Several heuristic techniques have been proposed for scheduling traces and superblocks, but the precision of these heuristics has not been studied relative to optimality. Optimality in this dissertation is defined as minimizing the expected schedule length, which is the weighted sum of schedule lengths across all code paths in the scheduling region. Optimal instruction scheduling is known to be NP-hard. So, the optimal algorithms proposed in this work use branch-and-bound enumeration with a number of novel pruning techniques to efficiently explore the entire solution space within reasonable time. Experimental evaluation of the proposed algorithms shows that, within a per-problem time limit of one second, 93% of the hard traces and 99% of the hard superblocks in the SPEC int2000 benchmarks are scheduled optimally. 87% of the optimally scheduled hard traces and 83% of the optimally scheduled hard superblocks in those benchmarks have improved schedules compared to typical heuristic schedules.
iii
To My Family
iv
Contents
Chapter 1: Introduction ............................................................................... 1 Chapter 2: Background and Definitions..................................................... 5 2.1 Scheduling Regions .................................................................................................. 5 2.1.1 Basic Blocks....................................................................................................... 5 2.1.2 Traces................................................................................................................. 5 2.2 Scheduling Fundamentals ......................................................................................... 7 2.2.1 Data Dependencies............................................................................................. 7 2.2.2 Control Dependencies........................................................................................ 9 2.2.3 Resource Constraints ....................................................................................... 10 2.3 Lower Bounds......................................................................................................... 11 2.4 Objective Functions ................................................................................................ 12 2.4.1 Trace Scheduling ............................................................................................. 12 2.4.1.1 Compensation Cost ................................................................................... 13 2.4.2 Superblock Scheduling .................................................................................... 15 2.4.3 Basic-Block Scheduling................................................................................... 16 2.5 Relaxed Scheduling ................................................................................................ 17
Chapter 3: Previous Work ......................................................................... 19 3.1 Global Scheduling Regions..................................................................................... 20 3.1.1 Linear Scheduling Regions .............................................................................. 20 3.1.2 Non-Linear Scheduling Regions...................................................................... 22 3.2 Scheduling Techniques ........................................................................................... 24 3.2.1 List Scheduling ................................................................................................ 24 3.2.2 Trace Scheduling Heuristics ............................................................................ 25 3.2.3 Superblock Scheduling Heuristics ................................................................... 26 3. 3 Lower Bound Techniques ...................................................................................... 28 3.4 Optimal Instruction Scheduling .............................................................................. 29
Chapter 4: Basic Block Scheduling ........................................................... 31 4.1 Algorithm Overview ............................................................................................... 32 4.2 Static Analysis ........................................................................................................ 32 4.2.1 Static Lower Bounds........................................................................................ 33 4.3 Enumeration............................................................................................................ 33 4.4 Pruning Techniques ................................................................................................ 36 4.4.1 Range Tightening............................................................................................. 37 4.4.2 Relaxed Scheduling ......................................................................................... 37 4.4.3 History-Based Domination .............................................................................. 38 4.4.3.1 Resource Constraints ................................................................................ 39 4.4.3.2 Latency Constraints .................................................................................. 40 4.4.3.3 History Table and Data Structures ............................................................ 42 4.4.3.4 Domination Checking Algorithm ............................................................. 43
v
4.4.3.5 Comparing Nodes at Unequal Depths....................................................... 46 4.4.4 Instruction Superiority ..................................................................................... 46 4.4.5 Absolute versus Relative Pruning Techniques ................................................ 47 4.5 Experimental Results .............................................................................................. 47 4.5.1 Basic-Block Distribution ................................................................................. 48 4.5.2 Heuristic Scheduling........................................................................................ 48 4.5.3 Enumeration..................................................................................................... 50 4.5.4 Time Limit ....................................................................................................... 52 4.5.5 Pruning Techniques ......................................................................................... 53
Chapter 5: Trace Scheduling ..................................................................... 56 5.1 Algorithm Overview ............................................................................................... 57 5.1.1 Total-Length Upper Bound.............................................................................. 58 5.2 Static Analysis ........................................................................................................ 59 5.2.1 Static Lower Bounds........................................................................................ 60 5.2.2 Compensation-Trace Interface......................................................................... 62 5.2.3 Cost Computation Example ............................................................................. 63 5.3 Enumeration............................................................................................................ 64 5.3.1 Scheduling Stalls.............................................................................................. 65 5.4 Pruning Techniques ................................................................................................ 67 5.4.1 Cost-Based Relaxed Scheduling ...................................................................... 68 5.4.1.1 Updating Lower Bounds for Paths with Side Entrances........................... 69 5.4.1.2 Computing Upward Mobility.................................................................... 72 5.4.1.3 Computing Dynamic Path Lower Bounds ................................................ 73 5.4.2 Cost-Based History Domination ...................................................................... 76 5.4.2.1 Pending Compensation Code Effects........................................................ 77 5.4.2.2 History Domination Example ................................................................... 80 5.4.2.3 History Table Data Structures................................................................... 81 5.4.2.4 Compensation Closure/Match Checking Algorithm................................. 82 5.5 Complete Example.................................................................................................. 85 5.6 Experimental Results .............................................................................................. 87 5.6.1 Trace Distribution ............................................................................................ 88 5.6.2 Heuristic Schedules.......................................................................................... 88 5.6.3 Enumeration..................................................................................................... 89 5.6.4 Improvement per Heuristic .............................................................................. 92 5.6.5 Time Limit ....................................................................................................... 93 5.6.6 Pruning Techniques ......................................................................................... 94 5.6.7 Scheduling Stalls.............................................................................................. 96 5.6.8 Solution Time and Problem Size ..................................................................... 96
Chapter 6: Superblock Scheduling............................................................ 98 6.1 Algorithm Overview ............................................................................................... 99 6.2 Static Analysis ........................................................................................................ 99 6.3 Enumeration.......................................................................................................... 101 6.3.1 Exit Combinations and the Subset-Sum Problem.......................................... 101 6.3.2 Dynamic Programming Solution ................................................................... 104
vi
6.3.3 Enumeration with Fixed Exits ....................................................................... 106 6.3.4 Search Orders................................................................................................. 107 6.3.4.1 Cost-By-Cost Enumeration..................................................................... 107 6.3.4.2 Length-By-Length Enumeration............................................................. 108 6.4 Complete Example................................................................................................ 110 6.5 Experimental Results ............................................................................................ 113 6.5.1 Superblock Distribution ................................................................................. 113 6.5.2 Heuristics ....................................................................................................... 114 6.5.3 Enumeration................................................................................................... 115 6.5.4 Sensitivity to the Heuristic............................................................................. 117 6.5.5 Search Order .................................................................................................. 118 6.5.6 Time Limit ..................................................................................................... 120 6.5.7 Comparison with the Trace Scheduling Algorithm ....................................... 121
Chapter 7: Conclusion .............................................................................. 122 7.1 Summary............................................................................................................... 122 7.2 Applications .......................................................................................................... 123 7.3 Future Work .......................................................................................................... 123 7.3.1 More General Machine Models ..................................................................... 124 7.3.2 Scheduling of Non-Linear Regions ............................................................... 125 7.3.3 Interaction between Scheduling and Register Allocation.............................. 125 7.3.4 Characterizing the Hard Problems ................................................................. 126
REFERENCES.......................................................................................... 127
vii
List of Figures 2.1 Example trace and its data dependence graph ……………………..................... 6 2.2 Example superblock and its data dependence graph …………………………... 7 2.3 Path DDSGs for the trace of Figure 2.1 ………………………………………… 9 4.1 Block diagram of the optimal basic-block scheduling algorithm …................... 31 4.2 Enumeration example on a single-issue processor ……………………………. 34 4.3 History domination example on a single-issue processor ………………………… 42 4.4 Number of unsolved problems as a function of time limit ……………………. 53 5.1 Example trace and its data dependence graph ………………………………... 59 5.2 Static lower bound computation for a DDSG ………………………………… 60 5.3 Path lower bounds for the trace of Figure 5.1 ………………………….................. 61 5.4 Instruction lower bounds and scheduling ranges …………………………….. 61 5.5 A heuristic schedule for the trace of Figure 5.1 ………………………………. 63 5.6 Optimal schedule with a stall to avoid costly upward code motion ………….. 66 5.7 Optimal schedule with a delayed entrance …………………………………… 66 5.8 Dynamic lower bounds for compensated paths ………………………………. 70 5.9 History domination example for the trace of Figure 5.7 ……………………… 81 5.10 Cost-based relaxed pruning example ………………………………………… 85 5.11 Optimal schedule for the trace of Figure 5.1 ………………………................ 87 5.12 Unsolved problems as a function of time limit ……………………................. 94 5.13 Solution time as a function of trace size ……………………................. 97 6.1 Static lower bounds and scheduling ranges ……….………………….. 100 6.2 Superblock scheduling heuristics …………………………………………….. 100 6.3 Dynamic programming table for solving the exit-combination problem .......... 105 6.4 Superblock enumeration. First iteration ……………………………………. 111 6.5 Superblock enumeration. Second iteration ………………………………… 112 6.6 Unsolved problems as a function of time limit………………….................. 120
viii
List of Tables 4.1 Basic block sizes in the SPEC CPU2000 benchmarks …………………………... 48 4.2 Percentage of basic blocks scheduled at their lower bounds with CP…………. 49 4.3 Average heuristic schedule length in the SPEC CPU2000 benchmarks ................. 50 4.4.a Enumeration of the hard basic blocks in Fp2000 ……………………………. 50 4.4.b Enumeration of the hard basic blocks in Int2000…………………………… 50 4.5 Unsolved problems for different time limits …………………………………… 53 4.6 Timeouts at different levels of pruning ………………………………………... 54 4.7 Enumerator speed at different levels of pruning ……………………................. 54 5.1 Trace distribution in the SPEC CPU2000 benchmarks ………………………… 88 5.2.a Percentage of traces with zero-cost heuristic schedules in Int2000……….. 89 5.2.b Percentage of traces with zero-cost heuristic schedules in Fp2000……….. 89 5.3.a Trace enumeration results for the hard problems in Int2000 ………………….. 90 5.3.b Trace enumeration results for the hard problems in Fp2000 ………………….. 90 5.4 Schedule improvement for different heuristics …………………………………. 92 5.5 Unsolved problems for different time limits ……………………………………. 93 5.6 Timeouts at different levels of pruning ………………………………………… 95 5.7 Enumerator performance at different levels of pruning ………………………... 95 5.8 Impact of stall enumeration …………………………………………………….. 96 6.1 Superblock distribution in the Fp2000 and Int2000 benchmarks ……………….. 114 6.2.a Percentage of zero-cost schedules in the Int2000 benchmarks …….................. 114 6.2.b Percentage of zero-cost schedules in the Fp2000 benchmarks ………… 114 6.3.a Superblock enumeration in the Int2000 benchmarks ………………................ 116 6.3.b Superblock enumeration in the Fp2000 benchmarks ………………................. 116 6.4 Number of superblocks timing out with different heuristics ………………….. 117 6.5 Number of timeouts for length-by-length and cost-by-cost enumeration …….. 118 6.6 Performance comparison between length-by-length & cost-by-cost enumeration 119 6.7 Unsolved problems for different time limits ……………………………………. 120 6.8 Trace algorithm vs superblock algorithm for superblock scheduling ............. 121
ix
List of Algorithms 4.1 Top-level algorithm for optimal basic-block scheduling ………………………… 32 4.2 Enumeration Engine …………………………………………………................... 36 4.3 Basic-Block Pruning Techniques ……………………………………................... 37 4.4 Checking the latency condition for history domination …………………………. 45 5.1 5.2 5.3 5.4 5.5
Top-level optimal trace scheduling algorithm …………………………………… 57 Pruning techniques for trace enumeration ……………………………………….. 68 Upward mobility …………………………………………………………………. 73 Dynamic path lower bounds …………………………………………................... 75 Compensation condition checking algorithm ……………………………………. 84
6.1 Optimal superblock scheduling using cost-by-cost enumeration ……………….. 107 6.2 Optimal superblock scheduling using length-by-length enumeration ................... 109
x
Acknowledgements
The research presented in this dissertation would not have been possible without the guidance and support of my advisor, Professor Kent Wilken. Not only did he teach me how to do good research, but he also played an important role in improving my technical writing skills. I also appreciate his support and encouragement for me during the critical final stage of writing of this dissertation. My sincere thanks go to the members of my dissertation committee, Professors Charles Martel and Zhendong Su for the great discussions that we had and their constructive comments that helped improve this dissertation. My colleagues at UC Davis have also provided great help. In particular, I’d like to express my gratitude to Mark Heffernan for his insightful comments and his help with the experimental setup. This work has also benefited from discussions with the current and former members of our compiler research group at UC Davis: Charles Fu, Robert Heath, Tim Kong, Jack Liu, Chris Lupo, Andy Riffel and Victor Yip. I also thank all of my friends for encouraging me and continuously reminding me that I need to finish this PH.D. I would also like to thank Kim Reinking, the former graduate program coordinator in the computer science department and Mary Reid, the current coordinator for all the help that they have provided to me. My parents have played an important role in shaping my academic life since the early childhood. Without their help and inspiration, I would not have reached this level of education. My mother was my very first teacher who dealt with my absolute illiteracy and my father was the first to teach me free thinking and lead me to experience the pleasure of intellectual discovery. Finally, my special thanks go to my loving and supportive wife, May for her heroic patience with the double job that I was doing for a few years, working in the industry and conducting doctoral research. I also appreciate her support of my decision to quit my job and be a full-time student during the past couple of years. May has also helped me in preparing this dissertation as well as all related publications and presentations. Without May’s help I would not have been able to complete my PH.D.
xi
CHAPTER ONE Introduction Due to the latencies associated with many instructions in modern pipelined architectures, the execution of an instruction cannot start until the data and resources that it needs are ready. This may result in empty cycles (stalls) that degrade performance. Instruction scheduling is a compiler optimization phase that tries to find an ordering of instructions that minimizes pipeline stalls without changing the program’s semantics or violating hardware resource constraints [44]. Due to the complexity of the problem, there is no known method for scheduling a whole program at once. Rather, compilers decompose the program into a number of smaller sections, called scheduling regions, and schedule one region at a time. A scheduling region is selected with certain properties that make scheduling manageable and efficient. In earlier compilers the scheduling region was a single basic block. A basic block is a straight-line piece of code, which is entered only at the first instruction and contains no branches except perhaps the last instruction in the block. The basic block was originally used as the scheduling region to avoid the complexities arising when instructions cross basic-block boundaries. However, as wider issue machines were designed, the basic block no longer provided enough parallel instructions to utilize the larger number of functional units. The problem is more pronounced in control-intensive programs, which are characterized by smaller basic blocks. This has stimulated substantial research effort to schedule regions larger than a single basic block. Instruction scheduling within a basic block is called local instruction scheduling, while scheduling of multiple basic blocks at once is called global instruction scheduling. Many region shapes have been proposed for performing global instruction scheduling. A global scheduling region is a collection of basic blocks with certain control-flow characteristics.
1
Usually, the scheduling region is an acyclic sub-graph of the program’s control flow graph. Common examples are traces [21], superblocks [30] and arbitrary acyclic regions [6, 8]. A trace is a sequence of contiguous basic blocks forming a high probability execution path in the program’s control flow graph (CFG) [44]. Each jump target in the trace is an entrance while each branch is an exit. The trace can have multiple entrances and multiple exists. The superblock is a special case of a trace that has only one entrance. A trace can be transformed into a superblock by a compiler transformation called tail duplication that eliminates side entrances. The purpose of eliminating side entrances is to simplify scheduling by avoiding the complexities arising from moving instructions across these entrances. A recent paper by Faraboschi et al. provides an excellent survey of region shapes and scheduling techniques [19]. It should be noted that the scope of this dissertation is limited to instruction scheduling of acyclic code, which is usually performed in a late compiler phase on a low-level representation of the code. Cyclic scheduling techniques such as loop unrolling and software pipelining [1, 37], which are usually performed in earlier phases on higher level code representations, are beyond the scope of this dissertation. Global instruction scheduling is a two-step process. In the first step, called region formation, the scheduling region is formed by selecting the set of basic blocks to be scheduled simultaneously. In the second step, called schedule construction, instructions in the formed region are scheduled as if they were in a single basic block [19]. This dissertation addresses the schedule construction problem for an already formed region. Most previous work on global instruction scheduling uses heuristic techniques for constructing schedules. This dissertation studies optimal techniques for scheduling two global scheduling regions, namely traces and superblocks, for which there are no existing optimal solutions. Because instruction scheduling is NP-hard [29] on realistic machines it is not likely that there is an algorithm that exactly solves all instances in polynomial time. Hence, this work uses branch-
2
and-bound enumeration, a common combinatorial optimization technique, to explore the exponential solution space. A number of pruning techniques are developed to achieve efficient exploration. The experimental results show that the pruning techniques developed in this work make it possible to optimally solve 93% of the hard traces and 99% of the hard superblocks in the SPEC int2000 benchmarks within one second per instance. This constitutes experimental evidence that intractable instances of the trace and superblock scheduling problems rarely occur in practice. In addition to generating improved code as an advanced compiler optimization, optimal instruction scheduling provides the most accurate way of assessing the success of existing heuristics at exploiting instruction-level parallelism (ILP). Studying the limits of ILP can also be used as a guide by hardware architects to avoid wasting hardware resources on architectural features that compilers are unable to utilize. In spite of the many global scheduling techniques, very few attempts have been made to evaluate their quality relative to optimality. The contributions of this dissertation can be summarized as follows: 1. Studying optimal basic block scheduling based on previously proposed ideas and enhancing previous ideas to produce an efficient optimal scheduler using branch-and-bound enumeration. 2. Formulating trace scheduling as an optimization problem based on a path analysis and devising an efficient branch-and-bound algorithm for solving the problem. The optimal formulation encompasses the conflicting objectives that were implicitly addressed by previous heuristic solutions. Efficiency of the optimal algorithm was achieved by developing a number of trace-specific pruning techniques. 3. Devising an optimal solution to superblock scheduling by transforming a superblock scheduling problem into a set of basic-block scheduling problems that are solved efficiently using enumeration.
3
The dissertation is organized as follows. Chapter 2 provides the background and formally defines the problems and terms used throughout the dissertation. Chapter 3 surveys previous work and discusses how it relates to this work. Chapter 4 lays the foundation by describing an optimal solution to basic block scheduling. The optimal solutions for trace scheduling and superblock scheduling are developed in Chapters 5 and 6. Chapter 7 summaries the findings of this work, describes possible applications and outlines potential future work.
4
CHAPTER TWO Background and Definitions This chapter formally defines the scheduling problems and the terms used in the dissertation. Section 2.1 defines the structure of the three scheduling regions addressed in this work. Section 2.2 introduces the fundamentals of instruction scheduling. Section 2.3 defines the lower bounds used in the formulation. Section 2.4 defines the objective function to be optimized for each of the three scheduling regions. Section 2.5 introduces the different forms of relaxation that are used in computing lower bounds.
2.1 Scheduling Regions This dissertation studies optimal scheduling of three scheduling regions: the basic block, the superblock and the trace. The trace is the most general scheduling region among the three regions. A superblock is a special case of a trace and a basic block is a special case of a superblock. This section defines the structure of each region.
2.1.1 Basic Blocks A basic block is a single-entry single-exit sequence of contiguous instructions. A basic block can be entered only at the first instruction and has no branches except possibly the last instruction in the block. The basic block is the simplest scheduling region.
2.1.2 Traces A trace is a sequence of contiguous basic blocks in the program’s control-flow graph (CFG) [21]. A basic block in the trace with a CFG predecessor outside the trace is called an entry block and the first instruction in that block is called an entrance (also known as a join). A basic block in
5
the trace with a CFG successor outside of the trace is called an exit block and the last instruction in that block is called an exit (also known as a split). A trace can have multiple entrances and multiple exits. A code path in the trace is a sequence of basic blocks starting at an entrance and ending at an exit below the entrance. The code path that starts at the first entrance and ends at the last exit in the trace (thus including the entire trace) is called the main path. All other paths are called side paths. The weight of a code path is the probability that the path is executed. Path weights in a trace sum to unity. Figure 2.1.a shows an example trace with three basic blocks, two entrances and three exits. The four code paths in the trace and their weights are listed in Figure 2.1.c. P3 is the main path and all other paths are side paths. The optimal formulation of this paper does not assume that the main path is necessarily the most likely path.
(a) Trace example
(b) Data dependence graph A
BB1
A B C
BB2
D E
BB3
F G H I
Path
1 1
B
1
1 D
1
1 E
1
Basic blocks
Weight
P1
BB1
0.24
P2
BB1, BB2
0.28
P3
BB1, BB2, BB3
0.28
P4
BB3
0.2
F
C
1
(c) Code paths
G
3 H
1 I
Figure 2.1: Example trace and its data dependence graph (DDG)
2.1.3 Superblocks The superblock is a global scheduling region that consists of a single-entry multiple-exit (SEME) sequence of basic blocks. The superblock is a special case of a trace with only one entrance. Branch instructions inside the superblock are called side exits, while the last instruction in the last basic block is called the final exit.
6
Figure 2.2 shows an example superblock with three exists. Since there is only one entrance to the superblock, each exit defines a path. Path weights, which are also exit probabilities in the superblock case, are shown next to the corresponding exists.
(a) Superblock
(b) Data dependence graph A
A B C
1
1 G
B 1
1
0.3
D E F
C 0.3
H
1
1
D
E
0.2
G H I
1
3 F
0.5
3
1
0.2 I 0.5
Figure 2.2: Example superblock and its data dependence graph
2.2 Scheduling Fundamentals Given a scheduling region and a target processor, a feasible schedule is an assignment of an issue cycle to each instruction in the region that satisfies the following three constraints: 1. Data dependencies 2. Control dependencies 3. Resource constraints A schedule starts at cycle 1, and the total length of a schedule is the number of the last cycle in which an instruction is issued. The three scheduling constraints are explained next.
2.2.1 Data Dependencies Given two instructions i and j, where i precedes j in the original program order, three types of data dependencies may exist between i and j [48]:
7
•
Read-after-write (RAW) dependency: if instruction j reads the output of instruction i from a register or memory location. For example, if instruction i is a load instruction that loads data into a register and instruction j is an arithmetic instruction that uses the value loaded in the register, j is RAW dependent on i.
•
Write-after-read (WAR) dependency: instruction j writes to a register or memory location that i reads.
•
Write-after-write (WAW) dependency: instruction j writes to a register or memory location that i writes to. If instruction j is data dependent on instruction i, the latency of the dependency is the
minimum number of cycles that are needed between the issue cycles of i and j. The latency is a non-negative integer. If the latency is zero, both i and j can be issued in the same cycle. If the latency is one, j cannot issue until at least one cycle after i and so on. In RAW dependencies, the latency is the number of cycles needed for the result of the writing instruction to become available to the reading instruction. Typical latency values for WAR and WAW dependencies are zero and one respectively. For any scheduling region, data dependencies among instructions in the region are represented by a directed acyclic graph (DAG), called the data dependence graph (DDG). Each node in a DDG represents an instruction. A directed edge from node i to node j with label l indicates that instruction j depends on instruction i with latency l. A DDG node with no predecessors is called a root node and the corresponding instruction is called a root instruction, while a node with no successors is called a leaf node and the corresponding instruction is called a leaf instruction. The DDGs in this dissertation are represented in a standard format in which there is only one root node and one leaf node. Any DDG can be converted to standard format by introducing a dummy root and/or leaf node and connecting them to the original root and/or leaf nodes with unit-latency edges. When the DDG of a scheduling region is in standard format, the last exit in the region is
8
always the DDG’s leaf node. The data dependence graphs for the trace of Figure 2.1.a and the superblock of Figure 2.2.a are shown in Figures 2.1.b and 2.2.b respectively. The data dependencies in a single code path of a trace are represented by a subgraph of the overall data dependence graph. That subgraph is called the path’s data dependence subgraph (DDSG). Figure 2.3 shows the DDSGs for the four paths in the trace of Figure 2.1.
(b) Path 2
(a) Path 1 A
(c) Path 3
A
1
(d) Path 4 F
1
1
1 B
B
1 C
1 C
D
G
Whole DDG
3 H 1
1 1 E
I
Figure 2.3: Path DDSGs for the trace of Figure 2.1
2.2.2 Control Dependencies Control dependencies are the constraints imposed by control-flow relations between basic blocks. Code motions across basic blocks are prohibited if they change the program’s semantics. Fortunately, the linear structure of the scheduling regions covered in this dissertation makes it possible to incorporate all control dependencies into the DDG without a need for a separate data structure. Illegal or undesirable code motions across branches can be disabled by introducing DDG edges between the problematic instructions and the branches as follows: Disabling Illegal Upward Code Motion: Moving an instruction above a branch is illegal in two cases: •
The instruction can potentially generate an exception (such as invalid memory access or division by zero) and the hardware does not support speculative execution [30].
•
The instruction defines a variable that is live at the branch’s off-trace target [21, 30]. A variable is live at a certain point in the program if the variable is used by a subsequent
9
instruction without being defined [44]. In this case, if the instruction is moved above the branch, the off-trace code at the branch target will be using the wrong definition for the variable. In each of these two cases, a unit-latency DDG edge is added from the node representing the branch to the node representing the problematic instruction to disable the potential illegal code motion [21]. Disabling Downward Code Motion: The scope of this dissertation is limited to upward code motion, that is, instructions are not allowed to move below branches. Studying optimal trace scheduling in the presence of downward code motion is left for future investigation. Disabling downward code motion is a typical limitation in global schedulers [6], and previous experimental studies have shown that this limitation does not cause a significant loss of performance [23]. Downward code motions are disabled by introducing a zero-latency edge in the DDG from each instruction to the subsequent branch (if any) unless a DDG path already exists between the instruction and the branch.
2.2.3 Resource Constraints In addition to satisfying the data and control dependencies represented by the DDG, a schedule must satisfy the hardware resource constraints represented by a machine model. The machine model used in this work is similar to that used in recent previous work not targeting a specific machine [15, 42]. This machine model consists of an arbitrary number of functional-unit types (pipelines) and a number of instances of each type, along with a mapping of instructions to functional-unit types. It is assumed that all functional units are fully pipelined and that each instruction can execute on only one functional-unit type. A fully pipelined functional unit can issue a new instruction each cycle as long as data dependencies are satisfied. The type of the functional unit on which an instruction can execute is called the instruction’s issue type. When
10
multiple functional units of a certain type are available, an instruction of that issue type can execute on any of these functional units. For machine models that are more complex than the models used in this dissertation, modern compilers use finite state automata to represent resource constraints [5, 18, 49, 50].
2.3 Lower Bounds The optimal algorithms in this dissertation are based on computing a tight lower bound on each instruction’s issue cycle and on the schedule length of each code path in a region. In a given DDG, the forward lower bound (FLB) of an instruction is a lower bound on the difference between the instruction’s issue cycle and the root instruction’s issue cycle. Similarly, the reverse lower bound (RLB) of an instruction is a lower bound on the difference between the instruction’s issue cycle and the leaf instruction’s issue cycle. The release time of an instruction is the earliest cycle in which the instruction can be scheduled. Since the root instruction is always scheduled in cycle 1, the release time of an instruction is equal to one plus its forward lower bound. When scheduling is done to achieve a certain target length, it is useful to define a deadline for each instruction. The deadline of an instruction relative to a target length is the latest cycle in which the instruction can be scheduled for the target length to be feasible. In a schedule of length L, the leaf instruction is scheduled in cycle L. Thus, each instruction i must be scheduled by the deadline L-RLB(i) for the target length L to be feasible. For a given target length, the scheduling range of an instruction is the interval starting at the release time and ending at the deadline. In a given DDG, the critical-path distance of a node from the root (leaf) is the length of a longest DDG path between the node and the root (leaf), where a DDG path length is the sum of edge labels along the path. A node’s critical-path distance from the root (leaf) of the DDG is a valid but often loose forward (reverse) lower bound of the instruction represented by that node. Techniques for computing tighter lower bounds by accounting for resource constraints are presented in Section 3.3.
11
Given a set of forward and reverse lower bounds for all instructions, a lower bound on the total schedule length of a DDG can be computed by adding one to the maximum of the leaf instruction’s FLB and the root instruction’s RLB. Similarly, a lower bound on the schedule length of any code path in a region can be computed by applying the same technique to the path’s DDSG.
2.4 Objective Functions This section defines the objective function to be minimized for optimal scheduling of each region.
2.4.1 Trace Scheduling The advantage of scheduling a whole trace at once instead of scheduling each basic block individually is that ILP may be exploited across basic block boundaries to minimize the total schedule length. However, code motion across basic blocks has two undesirable side effects. The first side effect is that code may have to be duplicated in certain cases to preserve program semantics. For example, if Instruction F is moved from BB3 to BB2 crossing the second entrance in the trace of Figure 2.1.a, a duplicate of Instruction F must be added before entry to BB3 to preserve correctness. The duplicate code added is called compensation code. It is usually desirable and sometimes necessary to limit the amount of compensation code. The second side effect is that aggressive code motion across blocks may cause the schedules of some side paths to be unnecessarily long. For example, if Instruction F is moved from BB3 to BB1 in the trace of Figure 2.1.a, side paths P1 and P2 will have to execute an extra instruction. Since the introduction of trace scheduling, a number of heuristic techniques have been proposed to address the issues of excessive compensation code generation and unnecessary degradation of side paths [23, 36, 39, 53, 54]. In this dissertation, optimality is defined so that it encompasses the three conflicting objectives addressed by previous work: minimizing the total
12
schedule length, avoiding side-path degradation and limiting the amount of compensation code. This is achieved by defining the objective as minimizing the weighted sum of schedule lengths across all code paths, where the schedule length of each path includes any added compensation code. The weighted length f of a schedule S is defined as N
f ( S ) = ∑ | S i | wi
(2.1)
i =1
where N is the number of code paths in the trace, |Si | is the length of code path i in schedule S and wi is the weight of code path i. In the next sub-section, it is shown how compensation code is factored into this weighted sum. When lower bounds on path schedule lengths are known, it is convenient to rewrite Equation 2.1 as a weighted sum of differences from the lower bounds and define a cost function relative to the path lower bounds as follows: N
Cost ( S ) = ∑ Di wi
(2.2)
i =1
where Di = |Si| - Li is the difference between the schedule length |Si| of path i and the path’s lower bound Li. 2.4.1.1 Compensation Cost In trace scheduling, instructions can move from one basic block to another. Recall that only upward code motions are considered in this dissertation. When an instruction is moved from a source basic block Bs to a destination basic block Bd, the paths that pass through Bs but not Bd are called losing paths, because they lose an instruction. On the other hand, the paths that pass through Bd but not Bs are called gaining paths, because they gain an instruction. Paths that pass through both basic blocks (and therefore don’t lose or gain instructions) are called common paths with respect to this code motion. For example, if Instruction F is moved from BB3 to BB1 in the
13
trace of Figure 2.1, P4 is a losing path, both P1 and P2 are gaining paths, and P3 is a common path with respect to this motion. When an instruction is moved above a side entrance in a given trace schedule, each path that starts at that entrance and includes the moved instruction is a losing path. To compensate that path for its loss, the moved instruction needs to be duplicated before the entrance. In this dissertation it is assumed that a new basic block, called the compensation block, is created between the off-trace predecessor blocks and the entry block of a losing path. As mentioned above, the duplicate instructions in the compensation block are called compensation code. When an instruction is moved above a given entrance, not all paths starting at the entrance are losing paths. Paths starting at that entrance and ending at an exit that appears before the moved instruction in the original program order are not losing paths, because they did not originally include the moved instruction. However, these paths still execute the compensation block in the trace schedule. All paths executing a compensation block are called compensated paths. Losing paths must be compensated paths in any correct trace schedule. However, some compensated paths may not be losing paths. For example, if there had been an entrance at BB2 in the trace of Figure 2.1, moving Instruction F from BB3 to BB1 would have made the path consisting of BB2 a compensated path but not a losing path. Since during the scheduling of one trace it is not known how the compensation block will be scheduled with the neighboring off-trace basic blocks, the cost of the compensation code needs to be estimated according to some reasonable cost model. The model used here estimates the cost of the compensation code as the lower bound of the DDSG that represents the duplicate instructions. This is the minimum cost that is necessary to ensure that the loss of instructions by upward code motion is not treated as an improvement of the losing paths, which is consistent with the purpose of global code motion. Code motion between two basic blocks is intended to provide more flexibility in scheduling the common paths, not to falsely improve the losing paths by taking instructions out of them.
14
On a machine where compensation code avoidance is more critical (for stringent code-size constraints), the cost estimate can be adjusted to more accurately reflect the negative impact of compensation code. In particular, a code-size component can be added to account for cache performance degradation. It is important to note here that the optimal algorithm described in this dissertation is valid as long as the compensation cost is not less than the compensation block’s lower bound. Any magnification of the compensation cost will not affect the correctness of the proposed solution. When compensation code is involved, the differential path length Di in Equation 2.2 has to be modified to account for the compensation cost. That’s accomplished by adding the cost of the compensation block to the cost of each compensated path. This leads to the following definition for Di
Di =| S i | +Ci − Li ,
(2.3)
where |Si| and Li are as defined above and Ci is the estimated length of the compensation block preceding path i if path i is a compensated path in schedule S. Examples for computing the cost of a schedule are given in Chapter 5.
2.4.2 Superblock Scheduling The absence of side entrances in a superblock simplifies the scheduling problem for the following reasons: •
Since a superblock has a single entrance, a code path in a superblock is uniquely defined by an exit, which is a branch for side exits and the DDG’s leaf node for the final exit. Unlike an entrance, which can vary from schedule to schedule depending on upward code motion, an exit is the same instruction in any schedule.
•
The number of paths in a superblock is equal to the number of basic blocks, while the number of paths in a trace is, in the worst case, a quadratic function of the number of basic blocks.
15
•
No compensation code is ever necessary when code is moved across branches in a superblock as long as the motion is in the upward direction. Using the special properties of superblocks, the weighted-length formula (Equation 2.1)
reduces to: N
f (S ) = ∑ Ci wi
(2.4)
i =1
where N is the number of exits, which is also the number of paths in a superblock, Ci is the issue cycle of exit i in schedule S and wi is the weight of the path defined by exit i. The main difference between this formula and the general trace formula is that in this formula a path’s schedule length is equal to the issue cycle of a definite instruction that defines the end of the path. Similarly, the cost function of Equation 2.2 can be written as a weighted sum of delays from exit lower bounds: N
N
i =1
i =1
Cost ( S ) = ∑ Di wi = ∑ (Ci − Li )wi
(2.5)
where Li is a lower bound on the issue cycle of exit i and Di=Ci-Li is the delay of exit i from its lower bound.
2.4.3 Basic-Block Scheduling A basic block is a degenerate special case of a trace in which there is a single entry and a single exit, hence a single path. The optimization problem in this case reduces to minimizing the schedule length of the only path, which is equal to the total schedule length. Therefore, the cost of a basic-block schedule is trivially equal to the difference between the total-schedule-length and the total-schedule-length lower bound. Even for this simple objective, optimal instruction scheduling is known to be an NP-hard problem unless both the maximum latency in the DDG and the machine’s issue rate are one, which is not an interesting case [29].
16
2.5 Relaxed Scheduling In this dissertation the term relaxed scheduling refers to a relaxation of a DDG or DDSG to a release-time deadline problem for the sake of computing lower bounds. As detailed in later chapters, the lower bound techniques used in this work are based on relaxing the NP-hard scheduling problem with latency constraints to an easier problem with release times and deadlines that can be solved optimally in polynomial time. Multiple forms of relaxation are used to compute various lower bounds for different purposes. This section defines the release-time and deadline problems that are used. Solutions to the relaxed problems and their use in optimal scheduling are explained in later chapters. Definition 2.1: The Release-time Deadline (RD) Problem: Given p fully pipelined functional units of type T and n instructions i1, i2, …, in of issue type T with release times r1, r2, …, rn and deadlines d1, d2, …, dn, a relaxed schedule S is an assignment of an issue cycle sk to each instruction ik such that rk ≤ sk and no more than p instructions are scheduled in each cycle. The first assigned cycle in a relaxed schedule S is denoted by first(S), and the last assigned cycle is denoted by last(S). The lateness lk of an instruction ik in relaxed schedule S is sk-dk if sk>dk and zero otherwise. The lateness of a relaxed schedule S, denoted by l(S), is the maximum lk across all instructions ik, 1≤ k ≤n. The size of a schedule S, denoted by |S|, is the number of assigned cycles, or in equation form: |S| = last(S) - first(S) + 1 In this work, the following solutions for the RD problem are considered: •
A minimum-completion-time (MCT) solution: a relaxed schedule with minimum last cycle.
•
A minimum-lateness (ML) solution: a schedule with minimum lateness.
•
A minimum-size (MS) solution: a relaxed schedule with minimum size.
17
•
A zero-lateness (ZL) solution: a schedule with zero lateness, that is, a schedule in which no instruction misses its deadline. An instance of the RD problem does not necessarily have a zero-lateness solution.
18
CHAPTER THREE Previous Work This dissertation extends previous work on global instruction scheduling by devising optimal solutions to scheduling problems that have been previously solved by heuristics. The optimal solutions are built on previous work on lower bound techniques and branch-and-bound enumeration. This section summarizes previous work on global instruction scheduling, lower bound techniques and branch-and-bound enumeration. It also covers related work on optimal instruction scheduling using integer linear programming, an alternate combinatorial optimization technique. As mentioned above, all existing instruction schedulers operate on one region at a time, and the scheduling process consists of two steps: region formation and schedule construction. Scheduling techniques differ in the region shapes they use, the allowed code motions within the region and the heuristics used to generate the schedules. Section 3.1 of this chapter provides a summary of global scheduling regions to show how superblocks and traces compare to other global scheduling regions. Section 3.2 surveys the heuristics that have been proposed for scheduling traces and superblocks. Lower bounds play an important role in instruction scheduling. In this work, lower bounds are used to both filter out easier problems before enumeration and as pruning techniques during enumeration. Section 3.3 describes the lower bound techniques that are used in this work. Finally, section 3.4 covers existing optimal solutions to instruction scheduling and how they relate to this work.
19
3.1 Global Scheduling Regions Researchers have recognized the lack of parallelism within a basic block since the early seventies [52]. Earlier attempts to exploit parallelism beyond basic block boundaries used a “schedule-and-improve” approach [32, 55]. In this approach each basic block is scheduled separately (local scheduling) then opportunities of code motion from one basic block to another are detected and applied iteratively to improve some of the local schedules. This approach is usually inferior to the modern approach of scheduling multiple basic block simultaneously, because once the individual basic blocks have been scheduled, many bad scheduling decisions have been committed already. Interestingly, however, the optimal scheduling analysis of this dissertation identifies certain cases were the obsolete “schedule-and-improve” approach produces better schedules than modern simultaneous approaches. Since the early eighties, researchers proposed global scheduling regions consisting of multiple basic blocks that are scheduled simultaneously. In virtually all global instruction scheduling research, a scheduling region is an acyclic sub-graph of the program’s control flow graph. A maximal scheduling region is an entire loop body. Region selection starts from the innermost loops and progresses outward in the control flow graph, and nested loops are treated as single instructions within the enclosing region. Loop unrolling is usually performed before instruction scheduling to allow the scheduler to find larger acyclic scheduling regions. Over the past two decades many global scheduling regions have been proposed. Global scheduling regions can be classified, based on shape, into linear regions and non-linear regions.
3.1.1 Linear Scheduling Regions A linear region is a sequence of basic blocks forming a simple path in the program’s controlflow graph. A linear region consists of a main path including all the basic blocks in the region and a number of sub-paths of the main path.
20
The earliest linear scheduling region is the trace proposed by Fisher in 1981 [21]. A trace is formed by using static analysis [27] or profiling information [61] to identify control-flow paths with high probability of execution. The most common and effective heuristic for forming traces is the “mutually most likely” heuristic [19, 40]. Two basic blocks A and B are mutually most likely if B is A’s most likely successor and A is B’s most likely predecessor or vise versa. To form a trace, a seed basic block with high frequency of execution is first identified, then the trace is grown by adding a mutually-most-likely block if such a block exists. The trace growing process stops when none of the next blocks is a mutually-most-likely block or when a loop back edge is reached or when the next mutually-most-likely block has already been selected for a previous trace. In an attempt to avoid the complexities associated with side entrances, Hwu et al. introduced the superblock [30] scheduling region, which is a single-entry trace. A superblock is formed by first finding a trace then applying a process called tail duplication to the trace to eliminate side entrances [27, 30]. The tail of a trace consists of all basic blocks below the first side entrance. By duplicating the tail and redirecting all side entrances to the duplicate code, a superblock is obtained. The superblock philosophy is simplifying the schedule construction phase by paying a code duplication cost during the region formation phase. This approach essentially generates maximal compensation code before scheduling starts. Duplication can potentially result in substantial increase in code size. For this reason, heuristics were proposed to avoid excessive code duplication during superblock formation [30]. Yet another derivative of the trace is the hyperblock structure proposed by Mahlke et al. [41]. The hyperblock utilizes hardware supported predication to simultaneously schedule multiple control-flow paths. Similar to the superblock, a hyperblock is a trace with no side entrances, but, unlike the superblock, a hyperblock can possibly include basic blocks from multiple control-flow paths. A hyperblock is considered a linear region because control dependencies within the
21
hyperblock are converted into data dependencies using predication. This has the advantage of including both successor basic blocks of an unpredictable branch. However, excessive inclusion of paths and allowing them to compete for system resources (registers, issue slots, pre-fetching buffers, etc.) with the instructions on the critical path may result in an overall performance degradation. To address this issue, the criteria used in selecting basic blocks to be included in a hyperblock give lower priority to larger basic blocks and to those with lower execution frequencies.
3.1.2 Non-Linear Scheduling Regions Linear regions work well when most branches are biased in one direction that can be identified at compile time. This is not the case in programs with a significant number of unbiased or unpredictable branches [53]. Control intensive programs in particular tend to have many branches that are not biased in one direction, which makes linear regions less effective in this case. Code generated using a linear scheduling region will give different performance results on different inputs, with the possibility of degrading performance if the trace selection was based on imprecise profiling information. It should be noted here, that the optimal formulation of trace scheduling in this dissertation addresses this issue by incorporating side paths into the cost function. This disadvantage of linear regions has led researchers to propose non-linear scheduling regions. Many forms of non-linear regions have been proposed [6, 8, 16, 25, 26, 28, 43]. A nonlinear region includes multiple control flow paths that are not necessarily sub-paths of one main path. Unlike a linear region, a non-linear region consists of basic blocks that cannot be traversed by one simple control-flow path. A non-linear scheduling region is usually an acyclic sub-graph of the program’s control flow graph, often with certain restrictions such as having a tree structure (Treegion by Havanki et al. [28]) or preferences such as having a single entry (Wavefront Scheduler [8]).
22
Scheduling a non-linear region is harder than scheduling a linear region. One of the main challenges in scheduling non-linear regions is the need to keep track of control dependencies between basic blocks within the region. A common solution to this problem is the Program Dependence Graph (PDG) proposed by Ferrante et al. [20]. The program dependence graph is an intermediate code representation that summarizes both control dependence and data dependence information. More recently, alternate methods have been proposed for representing control and data dependence information to serve global instruction scheduling, such as the on-demand method used by Gupta [26] and the path-based representation used in the Wavefront Scheduler [8]. An important control-dependence relation between two basic blocks that a non-linear global scheduler needs to be aware of is domination. Basic block A pre-dominates basic block B if every control-flow path from the entry block to B passes through A. Basic block B post-dominates basic block A if every control flow path from A to the exit block passes through B. Two basic blocks A and B are control-flow equivalent if A pre-dominates B and B post-dominates A, or vise versa. Keeping track of control dependence information within non-linear regions is critical to determine whether a candidate code motion between blocks is legal and generate the appropriate compensation code if needed. Code motions across basic blocks can be classified into three categories according to the control dependence relation between the source and destination blocks [6]: 1. Useful Code Motion: Moving code between two basic blocks that are control-flow equivalent. This kind of code motion can be performed without any need for hardware support, provided that it does not violate data dependencies. No compensation code is necessary in this case. 2. Speculative Code Motion: Moving code upward from basic block B to basic block A when B does not post-dominate A. Speculative code motion can be performed if it does not violate
23
data dependencies or if the machine supports speculative execution for the instruction type in question. Certain types of instructions, such as store instructions and exception generating instructions, are naturally unsuitable for speculative execution, since their execution changes the state of the machine irreversibly. 3. Duplicative Code Motion: Moving code upward from basic block B to basic block A when A does not pre-dominate B, or moving code downwards from basic block A to basic block B when B does not post-dominate A. This type of code motion is called duplicative because preserving the program’s semantics requires duplicating the moved instruction in all controlflow paths that lose the instruction. In global scheduling techniques moving code upward in the control flow graph is more common than downward code motion. This is because most scheduling methods traverse the region’s basic blocks in control-flow order. When a basic block is scheduled, the global scheduler considers moving code from unscheduled basic blocks to the current basic block. As mentioned in Chapter Two, separate data structures for representing control dependencies are not necessary for linear scheduling regions, such as traces and superblocks, due to the relative simplicity of control-flow relations within a linear region. From an engineering point of view, this is an advantage of linear regions that makes them more attractive for some compiler designers.
3.2 Scheduling Techniques Most schedule construction techniques are based on list scheduling and differ in the heuristics that are used for selecting instructions. In this section list scheduling is first described. Then existing heuristics for scheduling superblocks and traces are surveyed.
3.2.1 List Scheduling List scheduling is a greedy algorithm that maintains a ready list of instructions and selects one ready instruction for scheduling based on certain heuristics. An instruction is ready if all of its
24
predecessors in the DDG have been scheduled and their latencies have been satisfied. The critical-path (CP) distance from the leaf is a commonly used heuristic for selecting an instruction from the ready list. Previous work has shown that CP works very well in local instruction scheduling but does not work as well in superblock and trace scheduling [17, 53]. Hence, other heuristics have been proposed for superblock and trace scheduling [12, 15, 17, 36, 39, 53, 54]. The next two subsections survey these superblock-specific and trace-specific heuristics. The optimal scheduling algorithms of this dissertation allow for a precise evaluation of these heuristics by comparing them to optimal schedulers. It should be noted that some backtracking versions of list scheduling have been proposed to address deficiencies in the original greedy version. An example is the backtracking scheduler used to fill branch delay slots [3].
3.2.2 Trace Scheduling Heuristics In the original presentation of trace scheduling [21], critical-path list scheduling was the proposed scheduling algorithm. Most subsequent work on trace scheduling focused on improving the original algorithm by limiting the amount of compensation code [23, 39, 53, 54], a problem that was recognized in the original paper [21]. The paper by Freudenberger et al. [23] provides an extensive study of compensation code and makes the distinction between two different approaches to limiting compensation code: avoidance (avoiding code motions that lead to compensation code) and suppression (using global data flow and control flow information to detect cases where compensation code is redundant). This dissertation work only considers compensation code avoidance because it is part of the NP-hard scheduling problem for which an optimal solution is sought. In contrast, compensation code suppression is a program-flow problem that has a polynomial-time solution, which can be used with both heuristic and optimal trace schedulers.
25
Prior work on compensation code avoidance focuses on disabling certain kinds of global code motion, usually by adding extra edges to the DDG. Examples include disabling global code motion involving basic blocks with low execution frequency [21], global motion of instructions that are not on the DDG’s crtical path [54] and code motion below branches [23]. Another problem addressed by previous work is the potential side-path degradation when the scheduling objective is minimizing the total schedule length. Smith et al. observe that in nonnumerical code it is often hard to identify the most likely path, and thus ignoring side paths can lead to poor overall performance [53]. They propose an approach that they call Conscientious Trace Scheduling, which is also known as Successive Retirement (SR) [12]. In Successive Retirement, basic blocks in the trace are scheduled in control-flow order, and instructions belonging to earlier basic blocks are given priority over ready instructions from later basic blocks. Within each basic block, another heuristic such as CP is used as a tie breaker. Although this approach does well at avoiding side-path degradation, it tends to be too conservative as far as total-length minimization is concerned. The optimal algorithm proposed in this dissertation is based on an explicit cost model that encompasses the three conflicting objectives addressed by previous heuristics: minimizing total schedule length, avoiding side-path degradation and minimizing code size. The resulting schedules are optimal with respect to the cost model. If a schedule that satisfies all three objectives exists, it is found by an enumerative search. If no such schedule exists, a schedule with the least expensive compromise is selected. Note that the amount of compensation code tolerated on a given machine can be controlled by adjusting the estimated cost of compensation blocks.
3.2.3 Superblock Scheduling Heuristics When the superblock was introduced [30], it was first scheduled using the critical-path heuristic. However, subsequent research revealed that a priority based only on the critical path from the final exit may unnecessarily delay side exits [15, 17]. This led to the development of
26
superblock-specific scheduling heuristics. Two fast heuristics that work well in practice are the Successive Retirement heuristic described in the previous sub-section and the Dependence Height and Speculative Yield (DHASY) heuristic [17]. DHASY is a generalization of the critical-path heuristic to superblocks. The weighted sum of critical path distances to all exits is used instead of the critical-path distance to the final exit. This results in a more balanced heuristic that takes all exits into account. In addition to these fast heuristics, three more accurate but computationally expensive heuristics have been proposed. The G* heuristic tries to find a compromise between Critical Path and Successive Retirement by applying successive retirement only to the critical branches [12]. Speculative Hedge avoids over-speculation by setting each instruction’s priority to the sum of weights of the branches that it helps schedule early [15]. The most recent heuristic is Balance Scheduling, which is based on tight superblock lower bounds [17]. It tries to achieve more accuracy than all previous heuristics by determining the instructions that each branch needs to have scheduled early and selecting branches with compatible needs. Meleis et al. [42] studied the performance of the six heuristics mentioned above and found that Balance Scheduling, on average, generates the best schedules. It finds the optimal schedule for 50% to 88% of the non-trivial superblocks on different machine models. They also found that Balance Scheduling is less sensitive than other heuristics to the processor’s issue rate. However, their compile-speed measurements show that Balance Scheduling is relatively slow. It is, on average, 26 times slower than critical-path list scheduling. These results suggest that even the most complex heuristic-based approaches produce sub-optimal schedules on a significant number of real problems.
27
3. 3 Lower Bound Techniques Various lower-bound techniques have been developed for basic-block scheduling based on relaxing the NP-hard scheduling problem to a release-time deadline problem. These techniques can be applied to any DDG whether it represents a basic block or a trace. One relaxation that is used extensively in this work is Rim and Jain’s relaxation [51]. In the Rim-Jain algorithm, release times and deadlines for all instructions in the DDG are first computed using forward and reverse critical-path distances. Deadlines are computed for a target length equal to the DDG’s critical-path-based lower bound. Rim and Jain show that a minimum-lateness solution to the resulting RD problem can be found using Jackson’s earliest deadline rule [31]. According to the earliest deadline rule, instructions are considered in non-decreasing deadline order and each instruction is scheduled in the earliest available cycle such that its release time is satisfied. Once a minimum-lateness solution has been found, a lower bound on the DDG’s total schedule length is obtained by adding the resulting minimum lateness to the critical-path lower bound. In a scheduling problem with multiple issue types, one RD problem is created for each issue type and the number of slots per cycle p in Definition 2.1 is equal to the number of slots per cycle of that issue type. For instance, when scheduling for a 3-issue machine with 2 integer pipelines and one floating-point pipeline, two RD problems are created: one for the integer instructions with p=2 and another for the floating-point instructions with p=1. This approach does not capture the cross dependencies between instructions of different issue types, thus resulting in looser lower bounds when there are more issue types. In subsequent work, Langevin and Cerny [38] observe that a tighter lower bound can be computed if the release times of the nodes are computed by recursively applying the Rim-Jain algorithm to the subgraph between each node and the root node. This recursive technique has the
28
advantage of computing potentially tighter release times for the individual instructions in the DDG. Lower-bound techniques can be applied to the DDG in both directions. In the reverse direction, the roles of the root and leaf nodes are interchanged and the directions of all edges are reversed. The same technique is then applied to compute tighter reverse lower bounds leading to tighter deadlines. In this work, the Langevin-Cerny technique is applied to the DDG and the path DDSGs in a preprocessing step that computes tight lower bounds before enumeration. During enumeration, the faster but less precise technique of Rim and Jain is applied to the whole DDG as a pruning technique. To compute path lower bounds during trace enumeration, however, a new technique that solves a minimum-size RD problem for each DDSG is developed in Subsection 5.4.1.3.
3.4 Optimal Instruction Scheduling Previous research on optimal instruction scheduling used two different optimization methods: integer linear programming [2, 34, 35, 58, 59] and enumeration [13, 46]. All previous work is on basic block scheduling, except for the optimal global scheduling algorithm by Winkel [59]. Winkel provides an optimal solution using integer programming for a non-linear scheduling region (a whole routine) but with some limitations including the assumption of unit latencies across basic block boundaries. In contrast, the enumerative algorithm presented in this dissertation is limited to traces but can handle arbitrary latencies across basic blocks. Winkel presents experimental results for only 9 scheduling regions, while this dissertation reports results on an entire benchmark suite. Branch-and-bound enumeration is a well-known technique in combinatorial optimization [60]. In branch-and-bound enumeration, the entire solution space is explored but pruning techniques are used to make the search efficient. This dissertation work uses two pruning ideas from previous work on basic-block enumeration:
29
•
Using relaxed scheduling to compute the lower bounds during branch-and-bound enumeration [46]. However, this dissertation extends the idea to compute path lower bounds and solve global instruction scheduling problems. To compute path lower bounds during enumeration, a new iterative algorithm that solves a minimum-size RD problem is introduced.
•
Instruction superiority [13]: Using infeasibility of an instruction in a certain issue slot to prove infeasibility of another instruction in the same slot as described in Section 4.4.4.
30
CHAPTER FOUR Basic Block Scheduling Basic block scheduling is the fundamental instruction scheduling problem that needs to be studied thoroughly before optimal global scheduling algorithms can be developed. In basic block scheduling the objective is to minimize the total schedule length. This chapter describes an enumeration framework for optimally scheduling a basic-block. Using this framework, optimalbasic block scheduling is studied experimentally. The basic-block optimal solution provides the foundation for the optimal global scheduling algorithms. This chapter is organized as follows. Section 4.1 gives an overview of the algorithm. Section 4.2 describes the static analysis performed before enumeration. Section 4.3 describes the enumeration framework, and Section 4.4 covers the pruning techniques in detail. In the Section 4.5 the results of the experimental study are presented.
Heuristic Schedule
Lower Bounds
Optimal
Yes
No Yes Done
Optimal
Enumerator
No
Figure 4.1: Block diagram of the optimal basic-block scheduling algorithm
31
Done
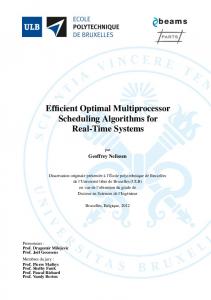
4.1 Algorithm Overview Figure 4.1 depicts a block diagram for the optimal scheduling framework. In the first stage, a heuristic algorithm is applied to the input DDG to compute an initial feasible schedule. The heuristic schedule length is an upper bound on the total schedule length. In the second stage, lower bound techniques are applied to compute a lower bound on the total schedule length as well as instruction lower bounds. If the total-length lower bound is equal to the total-length upper bound, optimality is proven and the algorithm terminates. If not, the enumerator is invoked iteratively as detailed below to search for an optimal schedule. The top level algorithm is listed as Algorithm 4.1. Each stage is explained in the next sections.
OpimalScheduleBasicBlock(DDG) 1 UB FindHeuristicSchedule(DDG) 2 LB ComputeLowerBounds(DDG) 3 For each length, LB≤length Cnext(x). Intuitively, instructions scheduled in the critical cycles of a partial schedule are the instructions that may have unsatisfied latencies with unscheduled instructions. These are the only instructions in a partial schedule that may affect the latency-based dynamic release times of unscheduled instructions. Theorem 4.2: The latency condition in Theorem 4.1 is satisfied if for each instruction i that is scheduled in a critical cycle of Px, the following condition is met for each unscheduled immediate successor j of i: rix (j)≤ ry(j) Proof: To prove the theorem it suffices to show that the condition of Theorem 4.2 will not be satisfied if for some unscheduled instruction j, rx(j) is greater than ry(j). Assume that rx(j) is greater than ry(j) for some unscheduled instruction j. The definition of rx(j) in Equation 4.2 implies that there is a predecessor i of j such that rix (j) = rx(j) > ry(j). First assume that i is scheduled. Since ry(j)≥ Cnext(y) and Cnext(x)=Cnext(y), it follows that rix (j) > Cnext(x). By Equation 4.1 and Definition 4.3, i must be scheduled in a critical cycle in Px and therefore the partial release time ri x(j) will be compared with ry(j) when the condition of Theorem 4.2 is checked. Since ri x(j) is greater than ry(j), the condition of Theorem 4.2 will not be satisfied. If, on the other hand, i is not scheduled, i must have a predecessor (not necessarily an immediate predecessor) i’ that is scheduled in Px. By applying the above argument to the first edge in the path from i’ to j rather than the edge i-j, it is concluded that i’ must belong to a critical cycle in Px.
44
Theorem 4.3: The minimum critical cycle C*min in a partial schedule Px with next cycle Cnext(x) is given by C*min(x)= Max (Cnext(x)+1-Lmax, 0)
(4.4)
where Lmax is the maximum latency in the DDG. Proof: When C*min(x)=0 there is nothing to prove. When C*min(x)> 0, consider the cycle before C*min(x), that is C*min(x)-1= Cnext(x)-Lmax. Let i be a maximum-latency instruction scheduled in C*min(x)-1. The partial dynamic release time of i’s unscheduled successors is Cnext(x)-Lmax+Lmax = Cnext(x). By Definition 4.3, C*min(x)-1 is not a critical cycle, nor is any earlier cycle C*min(x)-2,…, 0. Therefore, C*min(x) is the minimum critical cycle. Given a partial schedule of a history node, the condition of Theorem 4.2 needs to be checked only for the instructions occupying the cycles between the minimum critical cycle and the last cycle in the partial. The number of these instructions on an r-issue processor is at most r.(Lmax-1), which is independent of the DDG size. The algorithm for checking the latency condition is listed as Algorithm 4.4.
bool CheckLatencyCondition (historyNode, currentNode) histNode 1 node DepthToCycle(node.depth) 2 cycle 3 while (IsCritical (cycle) = TRUE) 4 inst = node.inst 5 if(inst = NULL) continue //if the instruction is a stall, no checking is necessary 6 For each successor suc of inst 7 if(suc.curCycle = INVALID) //if the successor is not scheduled 8 histReleaseTime cycle + latency (inst, suc) 9 if(histReleaseTime > suc.curReleaseTime) return FALSE // no domination 10 node node.parent // Move up to the parent tree node 11 cycle DepthToCycle(node.depth) //Get the corresponding cycle 12 return TRUE // domination condition is satisfied ←
←
←
←
←
Algorithm 4.4: Checking the latency condition for history domination
The main loop in the algorithm (starting on Line 3) traverses the history nodes corresponding to the critical cycles in the partial schedule of the history node in question. The IsCritical function
45
uses Equation 4.4 to check if the cycle number of a history node is less than C*min. Each history node corresponds to an issue slot in the partial schedule. For each history node, the inner loop (starting on Line 6) examines all unscheduled successors of the corresponding instruction (if it is not a stall). The partial dynamic release time of each unscheduled successor is computed on Line 8 and compared with the successor’s current dynamic release time (Line 9). If the history release time is greater than the current release time, the latency condition is not satisfied and domination cannot be proved. If, on the other hand, the condition on Line 9 is satisfied for all unscheduled successors of all the instructions in the critical cycles, domination is proved successfully. 4.4.3.5 Comparing Nodes at Unequal Depths In the above discussion history-based domination checking was limited to comparing nodes of equal depth in the enumeration tree. Comparing nodes of unequal depths requires a more complex analysis that is omitted in this dissertation due to its limited value. It has been found experimentally that considering nodes of unequal depth adds very little benefit to the pruning process. The reason is that if node y at depth d(y) is dominated by node x at depth d(x) (d(x) must be less than d(y)), it is likely that there exists a node z that is a successor of node x at depth d(y) and dominates y as well.
4.4.4 Instruction Superiority At a given tree node there may be multiple instructions that are ready to be scheduled. If the enumerator explores a ready instruction i and does not find a feasible schedule, it may be possible under certain conditions to prove that no feasible schedule exists using another ready instruction j at the same tree node. In this case it is said that instruction i is superior to instruction j. Definition 4.4: A ready instruction i at tree node n is superior to another ready instruction j at n if for each feasible schedule below n in which j is scheduled before i, swapping i and j preserves feasibility.
46
Theorem 4.4: Instruction Superiority [13]: At tree node n, a ready instruction i is superior to a ready instruction j if the following three conditions are satisfied: •
Instructions i and j have the same issue type.
•
Each immediate successor of j in the DDG is also a successor of i.
•
For each common successor k of both i and j, the latency from j to k is less than or equal to the latency from i to k.
Proof: Let S be a feasible schedule of length L in which instruction j appears before instruction i. Assume that i and j are swapped resulting in schedule S’. First, because i and j are of the same issue type, the swap does not violate the resource constraints. Moving i up preserves feasibility, because both i and j are ready at node n. On the other hand, moving j down does not violate the latency constraints to any successor of j, because each successor of j is also a successor of i with at most the same latency and all latencies were satisfied in schedule S.
4.4.5 Absolute versus Relative Pruning Techniques Pruning techniques that check the feasibility of a tree node based on the infeasibility of another tree node are called relative pruning techniques, while pruning techniques in which one tree node is checked without considering a previously examined tree node are called absolute pruning techniques. According to this classification, instruction superiority and history-based domination are relative pruning techniques, while range tightening and relaxed scheduling are absolute pruning techniques.
4.5 Experimental Results The optimal basic block scheduling algorithm described in this chapter was implemented and applied to the basic blocks generated by the Gnu Compiler Collection (GCC). GCC was set in the local scheduling mode, and the SPEC CPU int2000 and fp2000 benchmarks were compiled. Loop
47
unrolling was enabled to maximize basic block sizes. The basic-block DDGs generated by GCC were then input to the optimal scheduler. Scheduling was performed for four machine models: •
Single issue processor with a unified pipeline
•
Three issue processor, with two integer and one floating point (FP) pipeline (branch and memory operations execute on the integer pipeline)
•
Four issue processor, with one integer, one memory, one FP and one branch pipeline
•
Six issue processor, with two integer, two memory, one FP and one branch pipeline Instruction latencies are 2 cycles for FP adds, 3 cycles for loads and FP multiplies, 9 cycles for
FP divides and 1 cycle for all other instructions. The scheduling experiments were performed on a 3-GHz Pentium 4 processor with 2 GB of main memory.
4.5.1 Basic-Block Distribution Table 4.1 shows the size distribution of the basic blocks used in the experiments. There are a total of 54439 basic blocks in the fp2000 suite and 120446 basic blocks in the int2000 suite. The set includes large basic blocks with up to 2048 instructions. The fp2000 basic blocks are on average larger than the int2000 basic blocks. This is because the int2000 benchmarks are more control-intensive and include more branches than the fp2000 benchmarks. The fp2000 benchmarks, on the other hand, include more straight-line numerical computation.
Table 4.1: Basic block sizes in the SPEC CPU benchmarks BENCHAMRK SUITE Total basic blocks Max basic-block size Avg. basic-block size
FP2000 54439 2048 9.5
INT2000 120446 966 5.7
4.5.2 Heuristic Scheduling In the proposed optimal scheduler, a heuristic technique is used first to find an initial feasible schedule. In basic block scheduling the heuristic technique is Critical Path (CP). After applying
48
the heuristic to a DDG, the static lower bounds are computed and the static cost is evaluated. If the static cost is zero, the heuristic schedule is optimal. Otherwise, it may be sub-optimal and the DDG is passed to the enumerator to search for an optimal schedule. Scheduling problems that are passed to the enumerator are considered hard problems. Table 4.2 shows the number and percentage of basic blocks that are scheduled with zero cost (at their lower bounds) with the CP heuristic. The CP heuristic schedules the vast majority of basic blocks at their lower bounds. The percentage of basic blocks scheduled at their lower bounds is higher in the INT2000 benchmarks, because the INT2000 basic blocks are on average smaller and easier to schedule. The fact that 98.4 to 99.9% of the basic blocks are already scheduled optimally by the CP heuristic leads to the conclusion that the CP heuristic is a very precise heuristic for basic block scheduling regardless of the enumeration results for the remaining 1.6 to 0.1% of the basic blocks.
Table 4.2 Percentage of basic blocks scheduled at their lower bounds with CP MACHINE MODEL FP2000 INT2000 1-Issue 99.5% 99.9% 3-Issue 98.8% 99.9% 4-Issue 98.4% 99.8% 6-issue 99.1% 99.9%
Table 4.3 shows the average length of a critical-path list schedule for each machine model under study. Although the 4-issue processor has more issue slots per cycle than the 3-issue processor, its functional units are more specialized. The more specialized functional units result in a more resource-constrained scheduling problem, which explains why the schedules for the 4issue processor are on average longer than those for the 3-issue processor used in these experiments.
49
Table 4.3 Average heuristic schedule length (in cycles) in the SPEC CPU2000 benchmarks MACHINE MODEL FP2000 INT2000 10.7 6.6 1-Issue () (99) 8.5 5.7 3-Issue (98.) (99.) 9.5 6.2 4-Issue (98.4%) (99.8%) 8.3 5.6 6-issue (99.1%) (99.9%)
4.5.3 Enumeration Optimal scheduling results for the hard problems for each heuristic and machine model under study are shown in Tables 4.4.a and 4.4.b. The first row in each table shows the number of hard basic blocks. Enumeration results are analyzed next in terms of scheduling time, schedule improvement and problem difficulty.
Table 4.4.a: Enumeration of the hard basic blocks in FP2000 1-ISSUE
3-ISSUE
4-ISSUE
6-ISSUE
AVG
248
659
881
508
-
1
Hard basic blocks
2
Basic blocks scheduled optimally
240 (97%)
611 (93%)
803 (91%)
492 (97%)
(95%)
3
Basic blocks improved
118 (48%)
297 (45%)
471 (53%)
233 (46%)
(48%)
4
Schedule length improvement (cycles)
147 (1.1%)
391 (1.3%)
816 (1.9%)
311 (1.5%)
(1.5%)
5
Avg. solution time (ms)
23
33
30
47
33
Table 4.4.b: Enumeration of the hard basic blocks in INT2000 1-ISSUE
3-ISSUE
4-ISSUE
6-ISSUE
AVG
133
65
273
78
-
1
Hard basic blocks
2
Basic blocks scheduled optimally
133 (100%)
65 (100%
271 (99%)
77 (99%)
(99%)
3
Basic blocks improved
87 (65%)
42 (65%)
223 (82%)
66 (85%)
(74%)
4
Schedule length improvement (cycles)
101 (4.1%)
47 (4.4%)
329 (6.0%)
74 (4.4%)
(4.7%)
5
Avg. solution time (ms)
3
13
4
14
9
50
Scheduling Time: The enumeration time limit was set to one second per basic block. First consider the fp2000 results in Table 4.4.a. The number and percentage of hard basic blocks that were scheduled optimally within this limit are shown in Row 2. On average, 95% of the hard fp2000 basic blocks were scheduled optimally within one second. Row 5 shows the average solution time per problem for the problems that did not timeout. The numbers indicate that the majority of basic blocks were optimally scheduled within tens of milliseconds per basic block. Table 4.4.b shows the results for the int2000 benchmarks. The percentage of solved problems is much higher (99%) and the solution times are smaller. This is consistent with fact that the int2000 basic blocks are smaller and thus easier to schedule than the fp2000 benchmarks as shown in Table 4.1. Schedule Improvement: Row 3 shows the number and percentage of hard basic blocks whose optimal schedules were improved relative to their heuristic schedules, and Row 4 shows the difference in cycles between the aggregate optimal schedule and the aggregate heuristic schedule. In the fp2000 benchmarks, 48% of the hard basic blocks were improved by enumeration with an average schedule-length improvement of 1.5%. In the int2000 benchmarks, 74% of the basicblock schedules were improved with an average improvement of 4.7%. Problem Difficulty across Machine Models: The enumeration results vary across machine models. An interesting question is whether the relation between problem difficulty and the target machine model can be characterized. All the scheduling problems studied in this dissertation are NP complete, and there is no fine-grain theoretical definition of difficulty that addresses the relative difficulty across machine models. However, the following metrics seem to be reasonable experimental indicators of difficulty within the class of problems studied in this dissertation: 1. A larger percentage of problems whose heuristic schedule lengths are not equal to their lower bounds. 2. A larger percentage of timeouts.
51
3. A larger percentage of problems whose optimal solutions are improved relative to their heuristic solutions. 4. A larger percentage of cycle improvement relative to the heuristic solution In the fp2000 benchmarks, all four indicators suggest that the 4-issue model is the hardest machine model to schedule for. In the int2000 benchmarks, all but one metric suggest that the 4issue model is the hardest to schedule for. This is attributed to lower bound looseness. Recall, that in this work lower bounds are computed by considering each issue type separately. This approach does not precisely account for data dependencies across issue types (for example, a DDG edge between a memory instruction and an integer arithmetic instruction on the 4-issue processor). Since lower bounds are used in the static analysis phase to filter easy problems and during enumeration as a pruning technique, loose lower bounds will increase Metrics 1 and 2. Metrics 3 and 4 increase when the heuristic produces more sub-optimal schedules. Since the critical path-heuristic considers distances in the DDG and is not aware of issue types, it is expected to have worse performance on machines with more specialized functional units.
4.5.4 Time Limit In the previous experiments the time limit for enumeration was set to one second and tens of problems in the fp2000 benchmarks timed out. It is interesting to study the decrease (increase) in the number of problems that timeout when the time limit is increased (decreased). To study this experimentally, the time limit was varied from 10 ms to 10000 seconds (about 2.8 hours) in scheduling the 724 hard problems in both benchmark suites for the 3-issue processor and the resulting number of timeouts was measured. The results are shown in Table 4.5. To show the rate of decrease of timeouts as the time limit is increased, the two variables are plotted in Figure 4.4 on a logarithmic scale. The first region of the log-log graph between 10ms and 10 seconds is essentially linear, which suggests a polynomial relation of the form y=axb with b being a negative fraction. As the time limit is increased beyond 10 seconds, the decline in
52
timeouts gets slower. Extrapolating the graph suggests that it is unlikely that the proposed algorithm will solve all the hard problems within reasonable time.
Table 4.5: Unsolved problems for different time limits TIME LIMIT (S) UNSOLVED PROBLEMS 0.01 0.1 1 10 100 1000 10 000 (2.8 hours)
247 102 48 29 23 17 16
Unsolved Problems
1000
100
10
1 0.01
0.1
1
10
100
1000
10000
Time (second) Figure 4.4: Number of unsolved problems as a function of time limit (logarithmic scale)
4.5.5 Pruning Techniques In the experiments presented so far all pruning techniques were used. This subsection studies the effectiveness of the different pruning techniques proposed. To this end, enumeration experiments were performed at four different levels of pruning:
53
Level One: Only range tightening was applied. (the range tightening feasibility test is necessary and cannot be eliminated). Level Two: Range tightening and relaxed scheduling were applied. Level Three: Range tightening, relaxed scheduling and instruction superiority were applied. Level Four: All pruning techniques, including history-based domination, were applied. The three-issue machine model was used as a representative model for these experiments. First, the number of timeouts with a 1-second limit was measured at all four levels of pruning and the results are shown in Table 4.6. The percentage of timeouts dropped from 59% with the first level of pruning to 7% with the highest level of pruning. The results suggest that history-based domination is the most effective technique, then relaxed scheduling then instruction superiority. However, since the experiment does not study all eight possible combinations of the three optional pruning techniques, it is not possible to make a definite conclusion about the relative effectiveness. Table 4.6: Timeouts at different levels of pruning Hard Basic Blocks Timeouts
LEVEL 1 659 387 (59%)
LEVEL 2 659 242 (37%)
LEVEL 3 659 204 (31%)
LEVEL 4 659 48 (7%)
To fairly compare enumeration speed at the four levels, an enumeration experiment was performed on a set of basic blocks that are scheduled optimally with all levels of pruning. The enumerator with level-one pruning was first applied to the hard problems in the fp2000 benchmark suite. The basic blocks that were solved optimally within 10 seconds with level-one pruning were then enumerated using the higher levels of pruning. The results are shown in Table 4.7. Table 4.7: Enumerator speed at different levels of pruning Avg soln. time per basic block (ms) Avg tree nodes per basic block
LEVEL 1 497 335162
54
LEVEL 2 347 222820
LEVEL 3 11 3928
LEVEL4 3 509
328 basic blocks were solved optimally by all four levels of pruning. Two metrics are used to evaluate the enumerator’s performance: the average solution time per basic block (Row 1) and the average number of enumeration tree nodes that were needed to schedule a basic block optimally (Row 2). The experiment shows that each pruning technique reduces the average number of nodes needed to solve a problem optimally and consequently reduces the solution time. Interestingly, enabling instruction superiority (by moving from Level 2 to Level 3) results in a significant reduction in tree nodes while it only resulted in a modest reduction in timeouts in the previous experiment. Apparently, in the first experiment there are many problems whose solution time was reduced by instruction superiority but not to the degree that they are solved within the time limit.
55
CHAPTER FIVE Trace Scheduling Unlike optimal basic-block scheduling where the objective is minimizing the schedule length of one path, the objective of optimal trace scheduling is minimizing the weighted sum of schedule lengths across multiple paths. The trace consists of multiple overlapping paths with conflicting scheduling requirements. Minimizing the schedule length of one path may lengthen the schedules of other overlapping paths. The optimal trace scheduling algorithm presented in this chapter employs a path-based analysis that first searches for a schedule which satisfies the needs of all paths. If such a schedule does not exist, it finds a schedule that compromises lower weight paths such that the weighted schedule length is minimized. Similar to the optimal basic-block scheduling algorithm, the search for an optimal schedule is based on an enumerative approach that exhaustively explores the solution space. To handle the multi-path cost function in traces, two cost-based pruning techniques are introduced: a cost-based version of relaxed scheduling and a cost-based version of history domination. Efficiently updating and checking the dynamic lower bounds of multiple paths during enumeration is the main challenge in applying branch-and-bound enumeration to optimal trace scheduling. A number of path-based algorithms and data structures are developed to achieve this goal. The analytical and experimental results of this chapter show that the gap between optimal solutions and heuristic solutions is much wider for traces than it is for basic blocks. Due the added complexity, greedy heuristic approaches have a much higher failure rate in trace scheduling. For instance, a greedy heuristic cannot determine during the construction of a schedule whether it is beneficial to leave certain issue slots empty even if some instructions are
56
available for filling them. The optimal enumerative algorithm can make this decision intelligently and efficiently as detailed in Subsection 5.3.1. This chapter is organized as follows. Section 5.1 gives an overview of the algorithm. Section 5.2 describes the algorithms used for computing static lower bounds. Section 5.3 describes the enumeration framework and how it handles the complexities associated with trace scheduling. Section 5.4 explains the trace-specific pruning techniques. Section 5.5 illustrates the algorithm by a complete example. Section 5.6 presents the experimental results.
5.1 Algorithm Overview The optimal algorithm for trace scheduling uses a similar framework to that used in basicblock scheduling. At a high level, the framework can be represented by the same block diagram as basic-block scheduling (Figure 4.1). The algorithm listing is shown as Algorithm 5.1.
OptimalScheduleTrace(DDG) 1 schedLB ComputeLowerBounds (DDG) FindHeuristicSchedule (DDG) 2 bestCost 3 schedUB ComputeSchedUpperBound (bestCost) 4 targetLength schedLB 0 5 costLB 6 For each targetLength, schedLB ≤ targetLength < schedUB 7 bestCost Enumerate (DDG, targetLength) 8 if (bestCost = costLB) break 9 costLB costLB + mainPathWeight 10 schedUB ComputeSchedUperBound (bestCost) ←
←
←
←
←
←
←
←
Algorithm 5.1: Top-level optimal trace scheduling algorithm
First, the static path lower bounds are computed. Then a heuristic technique is applied to the given trace. Using the path lower bounds, the cost of the heuristic schedule is computed. If the cost is zero (all paths are scheduled at their lower bounds), the heuristic schedule is optimal and the solution is complete. Otherwise, the heuristic schedule is saved as the best known schedule and enumeration is used to search for a feasible schedule with a lower cost. Similar to the basicblock case, the search iteratively explores one total schedule length at a time instead of exploring
57
all possible total lengths at once. Exploring one total schedule length at a time results in tighter scheduling ranges for the instructions during each iteration. However, because feasible trace schedules with the same total length may have different costs, the trace enumerator may explore multiple feasible schedules at each total schedule length. The enumerator returns the lowest cost schedule if a feasible schedule exists. In the first iteration, feasible schedules with total length equal to the total-length lower bound are explored and the process continues until the total-length upper bound has been explored. A formula for computing the total-length upper bound for trace scheduling is developed in Subsection 5.1.1. The lower level algorithms of the framework are explained in the next sections.
5.1.1 Total-Length Upper Bound Given a feasible schedule of total length L and cost UC, UC is an upper bound on the cost, but L is not necessarily an upper bound on the total schedule length. A schedule with total length L+1 or greater may have a cost less than UC if some of its high-weight side paths have shorter schedules. A formula can be derived for computing a total-length upper bound US given a cost upper bound UC. First, Equation 2.2 is rearranged so that the main path cost appears as a separate term: N −1
N −1
i =1
i =1
Cost ( S ) = Dm wm + ∑ Di wi = (| S | − LS ) wm + ∑ Di wi
(5.1)
where |S| is the total schedule length, LS is a lower bound on the total schedule length and Dm and wm are the differential length and weight of the main path. A lower bound Lc on the cost at a given total length can be obtained by setting side-path schedule lengths to their lower bounds. In this case the summation in Equation 5.1 vanishes, and the cost lower bound at length L is
LC ( L) = ( L − LS ) wm
58
(5.2)
A total schedule length whose cost lower bound is equal to or greater than the cost upper bound UC does not need to be considered. Hence, to find the maximum interesting schedule length US, the right-hand side in Equation 5.2 is equated to the cost upper bound UC and US is substituted for L:
U C = (U S − LS ) wm
(5.3)
Solving this equation for US gives
US =
UC + LS wm
(5.4)
This equation gives the desired exclusive upper bound on the total schedule length. In searching for schedules with a lower cost than a known cost UC, total schedule lengths greater than or equal to Us need not be examined. The function ComputeSchedUpperBound invoked on Lines 3 and 10 of Algorithm 5.1 uses this formula.
5.2 Static Analysis This section describes the first two stages of the algorithm (Lines 1 and 2), where static lower bounds are computed and used to evaluate the schedule cost. The trace example of Figure 2.1 is used to illustrate the algorithms in this section and in most of the chapter. It is repeated in Figure 5.1 below for convenience.
(a) Trace example
(b) Data dependence graph A
BB1
A B C
BB2
D E
BB3
F G H I
Path
1 1
B
1
1 D
1
1 E
1
Basic blocks
Weight
P1
BB1
0.24
P2
BB1, BB2
0.28
P3
BB1, BB2, BB3
0.28
P4
BB3
0.2
F
C
1
(c) Code paths
G
3 H
1 I
Figure 5.1: Example trace and its data dependence graph (DDG)
59
5.2.1 Static Lower Bounds A static lower bound on the schedule length of each path can be computed by applying one of the lower bound techniques of Section 3.3 to the path’s data dependence sub-graph (DDSG). Figure 5.2 shows how a lower bound can be computed for a DDSG using the Rim-Jain algorithm, which computes a minimum-lateness solution to an RD problem. The DDSG for Path 2 in the trace of Figure 5.1 is used as an example. A single-issue processor is assumed. The critical-path-based release times and deadlines are shown next to each DDSG node in Figure 5.2.a. The deadlines are computed for a target length of 4, which is the leaf node’s critical-pathbased release time. In Figure 5.2.b the earliest deadline rule is applied to the release times and deadlines to compute a minimum-lateness relaxed schedule for the DDSG. Since each of instructions C and E misses its deadline by one cycle, the minimum lateness is one cycle and the Rim-Jain lower bound is equal to 4+1=5 cycles.
(a) DDSG
(b) Relaxed Schedule
A
[1, 1]
1 1 B
[2, 2]
1
[2, 3]
C
D
1: 2: 3: 4: 5:
A B D C E
[3, 3]
Lateness = 1
[4, 4]
DDSG LB = 4+1 = 5
1 1 E
Figure 5.2: Static lower bound computation for a DDSG
The Langevin-Cerny algorithm applies the same technique recursively to the sub-graph between each node and the root node. In each sub-graph lower bound computation, lower bounds from previous sub-graph computations are used as release times instead of using the critical-pathbased release times. For the above example, using the Langevin-Cerny algorithm will give the
60
same result as the Rim-Jain algorithm. In general, however, the Langevin-Cerny technique often produces tighter lower bounds. Hence, it is used to compute the static lower bounds.
(a) Path 1
(b) Path 2
A
(c) Path 3
(d) Path 4
A
F
1
1
1
1 B
B
1
G
Whole DDG
1
C
3
C
D
H 1
1 1 I
E
LB = 3
LB = 5
LB = 9
LB = 6
Figure 5.3: Path lower bounds for the trace of Figure 5.1
Figure 5.3 shows the result of applying the Langevin-Cerny algorithm to each of the four paths in the trace of Figure 5.1. These path lower bounds are used throughout the algorithm to evaluate the cost function.
(a) DDG and scheduling ranges for target length 9 A
1
1
1
[1, 1]
INS
1 B
[2, 5]
C
[3, 6]
1 [2, 6] D
(b) Forward lower bounds (FLBs) and reverse lower bounds (RLBs)
[2, 4]
F
1
1 E
[5, 7]
G
[3, 5]
1 [8, 8] H 1
3
A B C D E F G H I
FLB 0 1 2 1 4 1 2 7 8
RLB 8 4 3 3 2 5 4 1 0
[9, 9] I
Figure 5.4: Instruction lower bounds and scheduling ranges for the trace of Figure 5.1. Ranges are for a target length of 9 cycles on a single-issue processor.
61
When the Langevin-Cerny algorithm is applied to the main path’s DDSG, which is the whole DDG, the recursive nature of the algorithm is used to compute instruction lower bounds that are potentially tighter than the critical-path-based lower bounds. The Langevin-Cerny algorithm is applied to the whole DDG once in each direction to compute tighter forward and reverse lower bounds. These lower bounds are then used to compute a scheduling range for each instruction at each target schedule length. Figure 5.4.a shows the static scheduling ranges of the instructions in the trace of Figure 5.1 for a target schedule length of 9 cycles on a single-issue processor. The ranges are based on the forward and reverse lower bounds shown in Figure 5.4.b.
5.2.2 Compensation-Trace Interface If a compensation block contains instructions with long latency (greater than one), a correct trace schedule must include the right number of stalls between the compensation block and the on-trace code to ensure that all latencies are satisfied before the execution of on-trace code. The number of stalls is a function of both the on-trace schedule and the off-trace (compensation) schedule. However, the compensation schedule is not known when a trace is scheduled and the compensation cost is a lower bound on the compensation block’s schedule length. Hence, stalls are accounted for in the compensation cost by introducing a dummy leaf node to the compensation DDSG and adding an edge between each compensation instruction with unsatisfied latency and the dummy leaf node. This accounts for the unsatisfied latency between the compensation instruction and on-trace code. The lower bound of the resulting DDSG is then computed. For example, Figure 5.5 shows a heuristic schedule for the trace of Figure 5.1. The compensation block for the side entrance includes instruction G with latency 3. The first on-trace instruction at the entrance is Instruction H, which is dependent on Instruction G with latency 3. Since Instruction H is scheduled in the first cycle following the compensation block, an edge with latency 3 is added to the compensation DDSG (the dummy leaf node is not shown in the figure).
62
Had Instruction H been scheduled in the second cycle following the compensation block, the latency of the added edge would have been 2, and so on. The section of a trace schedule that may have unsatisfied latencies with instructions in a compensation block is called the compensationcritical section for that compensation block. In the example of Figure 5.5, the compensationcritical section consists of the instructions in Cycles 8 and 9.
BB1
1: 2: 3: 4: 5: 6:
A F G B D C
Estimated length of compensation block: L(CB) = 4 (2 cycles+2 stalls) F
1 G
BB2
7: E
BB3
8: H 9: I
3
CB
Cost (P1) = (6 - 3) * 0.24 = 0.72 Cost (P2) = (7 - 5) * 0.28 = 0.56 Cost (P3) = (9 - 9) * 0.28 = 0 Cost (P4) = (2 + 4 - 6) * 0.2 = 0 Total cost = 0.72 + 0.56 = 1.28
Figure 5.5: A heuristic schedule for the trace of Figure 5.1
5.2.3 Cost Computation Example Cost computation is illustrated in Figure 5.5 using a critical-path list schedule for the trace of Figure 5.1. Note that the entrance of the third basic block (BB3) has changed from Instruction F to Instruction H. To estimate the cost of the compensation block, a lower bound is computed for the 2-node DDSG with an unsatisfied latency of 3. This lower bound is four cycles on a single-issue machine. That includes two cycles for the instructions and two cycles for the stalls needed to satisfy compensation-block latencies before the dependent on-trace code is executed. The estimated length of the compensation block is then added to the schedule length of each compensated path. In this case, the only compensated path is P4. To compute the cost, the path lower bound computed in Figure 5.3 is subtracted from the schedule length of each path. The cost of 1.28 indicates that, considering all paths, the schedule is on average 1.28 cycles longer than the lower bound.
63
5.3 Enumeration Enumeration in trace scheduling uses the same branch-and-bound approach used in basicblock enumeration but with two main differences: •
Multiple feasible schedules may be explored at each schedule length
•
A different set of pruning techniques is used. Enumeration of multiple schedules per length is explained in this Section, while pruning
techniques for trace scheduling are discussed in the next Section. A fundamental difference between trace scheduling and basic block scheduling is that the cost of a basic block schedule is solely determined by the total schedule length, while the cost of a trace schedule is a function of the schedule lengths of multiple paths. Therefore, feasible schedules with a given total length have the same cost in basic block scheduling but may have different costs in trace scheduling. For this reason, a trace enumerator may explore multiple feasible schedules at a given total length. When the enumerator is invoked at a given total schedule length, its objective is to find a feasible schedule with cost between the cost lower bound and the best known cost. Initially, the cost lower bound is zero and the best cost is the heuristic cost. For each total schedule length explored, Equation 5.2 gives the cost lower bound at that total schedule length. Equation 5.2 expresses the fact that incrementing the total schedule length increases the cost lower bound by a value equal to the main path weight. When the enumerator finds a feasible schedule, the cost of that schedule is computed and compared to the best known cost. If the new cost is less than the best cost, the new schedule is now the best known schedule and the best cost is updated. The process continues until the entire solution space at the current total schedule length has been explored or a schedule with cost equal to the cost lower bound has been found. The enumerator for trace scheduling uses the same algorithm as basic block scheduling
64
(Algorithm 4.2), but with two differences: •
The procedure WasObjectiveMet returns TRUE if a feasible schedule with cost equal to the cost lower bound is found. In basic-block scheduling the procedure returns TRUE if any feasible schedule is found.
•
The procedure ExamineNode applies a different set of pruning techniques as explained in Section 5.4. During schedule construction, the trace enumerator keeps track of the current basic block. A
ready instruction that belongs to the current basic block is called a local ready instruction, while a ready instruction belonging to another basic block is called an external ready instruction.
5.3.1 Scheduling Stalls When a trace schedule is constructed, it is sometimes beneficial to leave an issue slot empty even if a ready instruction can be scheduled in that slot. Identifying cases where scheduling a stall results in a better schedule is one advantage of the proposed enumerative approach over greedy heuristic approaches. Scheduling a stall instead of a ready instruction can be beneficial in two cases: Case 1: Avoiding costly upward code motion Moving an instruction from its original basic block to the current basic block may improve the schedule of the common paths between the two basic blocks. However, the upward code motion results in gaining and/or compensated paths. Sometimes, the added cost of the gain and/or compensation overweighs the benefit. When the ready list includes an external instruction and the added cost of moving the instruction up is greater than the cost reduction resulting from scheduling the instruction early, scheduling a stall instead of the external instruction results in a lower cost schedule. An example is shown in Figure 5.6. The trace in the figure consists of two basic blocks with two entrances and one exit. Each entrance defines a path. After Instruction A is scheduled in
65
Cycle 1, Instruction D, which is external to the first basic block, is ready for scheduling in Cycle 2. However, moving Instruction D above the second entrance would require compensation code and would not shorten the schedule of either path. This costly upward code motion can be avoided by not filling the empty slot in Cycle 2 and leaving Instruction D in its original basic block as shown in Figure 5.6.c.
(b) DDG
(a) Trace
(c) Optimal Schedule
P1 A B
2
P2
A
1
B
C D E
1: A 2: stall 3: B
D
1 C
4: C 5: D 6: E
2 E
Figure 5.6: Optimal schedule with a stall to avoid costly upward code motion
Case 2: Avoiding early side entrances The schedule length of a path starting at a side entrance increases when the entrance is scheduled early. However, scheduling an entrance early may be beneficial to other paths. Optimal scheduling resolves this trade off in a systematic manner. If the paths starting at a side entrance have high enough weights, the schedule-length increase caused by scheduling their entrance early overweighs the benefit to other paths (if any). In this case, delaying the entrance and scheduling a stall results in a lower cost schedule.
(a) Trace
(b) DDG
(c) Optimal Schedule
P1 A
1
A
3
P2 B C
B
1: A 2: stall
C
3: B 4: C
Figure 5.7: Optimal schedule with a delayed entrance
66
An example is shown in Figure 5.7. The trace consists of two paths: P1 and P2. Instruction B, which is the entrance to P2, is ready at Cycle 2. However, because Instruction C cannot be scheduled earlier than Cycle 4, scheduling B in Cycle 2 would lengthen P2 without shortening P1. This is avoided by scheduling a stall in Cycle 2 and delaying the entrance of P2 to Cycle 3 as shown in Figure 5.7.c. No trace scheduling heuristic has been proposed to address the two cases described above. All existing trace scheduling heuristics greedily schedule an instruction when the ready list is not empty. Ironically, the earlier “schedule-and-improve” approach to global instruction scheduling (developed before trace scheduling) may correctly avoid costly upward code motion, because it first schedules individual basic blocks separately and then moves code across basic blocks only if the motion shortens a basic block schedule. However, the “schedule-and-improve” approach generally lacks the power of simultaneously scheduling multiple basic blocks. .The enumerator’s ability to decide intelligently whether scheduling a stall is beneficial can result in a significant reduction in compensation-code size, especially on wider issue machines as shown by the experimental results.
5.4 Pruning Techniques Efficient enumeration requires effective pruning techniques. A pruning technique is a feasibility test at a tree node that determines whether finding a schedule of the desired property is possible below that node. The desired properties in the optimal trace scheduling framework of this dissertation are a total schedule length equal to the target schedule length and a cost less than the best known cost. To check for these properties the following feasibility tests are applied at each node: •
Range Tightening
•
Cost-based history domination
67
•
Cost-based relaxed scheduling The range tightening test is identical to that used in basic-block scheduling. Cost-based
relaxed scheduling and cost-based history domination are generalized versions of the corresponding basic-block pruning techniques. The generalization accounts for the multiple-path feature of traces as described in the next sub-sections. Generalizing instruction superiority to traces is not addressed in this dissertation; it is currently under investigation by another member of the research group. The trace version of the ExamineNode procedure called by the top-level enumeration algorithm (Algorithm 4.2) is listed in Algorithm 5.2.
boolean ExamineNode(inst) 1 if(TightenRanges(inst) = FALSE) 2 return FALSE 3 if(IsHistroryCostDominated(currentNode) = TRUE) 4 return FALSE 5 if(CostRelaxSchedule(DDSGs) = FALSE) 6 return FALSE 7 return TRUE Algorithm 5.2: Pruning techniques for trace enumeration
5.4.1 Cost-Based Relaxed Scheduling Using the release times obtained in the range tightening test, a dynamic lower bound on each path’s schedule length is computed. Dynamic path lower bounds, which are potentially tighter than the static lower bounds, are used to compute a tighter dynamic cost lower bound. The dynamic cost lower bound at each tree node is compared to the best known cost. If the dynamic cost lower bound is not less than the best known cost, no better schedules exist below the current tree node. Therefore, infeasibility is detected and backtracking occurs. Initially, at the root tree node, the lower bound of each code path is equal to its static lower bound. Then, as instructions are scheduled, the path lower bounds potentially increase for one or two of the following three reasons:
68
1. The range of at least one instruction in the path has been tightened. The range of an instruction is tightened if its release time is tightened by the first feasibility test, or if the instruction is scheduled. In this case the path is called a tightened path. 2. An upward code motion occurred and the path is a gaining path. 3. An upward code motion occurred and the path is a compensated path. The lower bound of a gaining, tightened or compensated path is recomputed by applying relaxed scheduling to the updated DDSG as detailed below and the cost lower bound is updated. At a tree node, a code path can be fully scheduled, partially scheduled or completely unscheduled. In the first case, the path’s final schedule length is known and relaxed scheduling is not needed. In the second and third cases, the dynamic path lower bound algorithm described below is applied to the mix of scheduled and unscheduled instructions. Unlike static lower bounds that are computed by applying the lower bound technique to an isolated DDSG, dynamic path lower bounds are computed in-context using each instruction’s scheduling range in the total DDG. This captures the interactions among overlapping paths as instructions’ scheduling ranges are tightened. 5.4.1.1 Updating Lower Bounds for Paths with Side Entrances Schedules in this work are constructed in the forward direction, that is, by considering issue cycles in increasing time order. During schedule construction, the entrance to a side path is not known until the basic block above the side path has been fully scheduled. The next instruction scheduled will then be the entrance to the side path. When the first instruction of a side path is scheduled, the entrance is resolved. After scheduling an entrance, no compensation code can be added to the entrance’s compensation block, and the compensation block is declared closed. Subtlety: Even though a basic block can be empty in a trace schedule, a path’s on-trace schedule cannot be empty, because a path must have an exit, which is a branch or the DDG’s leaf node.
69
Since branches cannot move up and the leaf node is always scheduled last, the on-trace schedule of each path will include at least the path’s exit. A path starting at a side entrance consists of two components: the on-trace code and the offtrace (compensation) code. Computing a lower bound for each component and then adding the lower bounds does not necessarily give a correct lower bound for the path. This is because if an instruction moves from an on-trace component to a compensation block with empty slots, it may make the on-trace component shorter without making the off-trace component longer. For example, consider scheduling the trace of Figure 5.8.a on a dual-issue processor. Let Side Path CDE be the side path containing the three instructions C, D and E. The DDSG for Side Path CDE is shown in Figure 5.8.b. Figure 5.8.c shows a partial schedule in which Side Path CDE is a compensated path due to the upward code motion of Instruction C. The boundary between the first basic block and the second basic block is drawn in a dotted line because the actual boundary will not be determined until Instruction B is scheduled. Side path CDE then has an unresolved entrance.
(a) Trace
(b) DDSG of Path CDE
A B D
C D E
C
(d) Complete Schedule
(c) Partial Schedule 1: A 2: C
C
1
1: A 2: C D 3: B
C D
E
4: E
F
5: F
Figure 5.8: Dynamic lower bounds for compensated paths
Consider the problem of computing a dynamic lower bound on the schedule length of Side Path CDE in the partial schedule shown in the figure. The lower bound on the on-trace schedule length of the path is 2 cycles and the lower bound on the compensation block cost is 1 cycle. Summing these two lower bounds gives an incorrect path lower bound of 3 cycles. This lower
70
bound is incorrect because if Instruction D is scheduled next as shown in the complete schedule of Figure 5.8.d, it will be moved to the compensation block. Since Instructions C and D are independent, the compensation-block can be scheduled in 1 cycle on a dual-issue processor. The on-trace schedule length will be 1 cycle because Instruction E is the only on-trace instruction left in Path CDE. This gives a total schedule length of 2 cycles for Path CDE. A dynamic lower bound for any path starting at a side entrance can be computed by summing the on-trace lower bound and the off-trace lower bound when instructions can no longer move into the compensation block. This is the case when one of the following two conditions is satisfied: •
The compensation block at the path’s entrance has been closed due to entrance resolution.
•
The path no longer includes any instructions that can move above the entrance. Both conditions are checked dynamically at each tree node to determine whether adding the
on-trace lower bound and the off-trace lower bound is legal. The first condition can be checked by keeping track of the current basic block number (basic blocks are numbered sequentially in control-flow order within the trace). When all the original instructions of the current basic block are scheduled, the current basic block number is incremented. A side-path’s entrance is resolved when the current basic block number is equal to or greater than the path’s first block number. Checking the second condition requires keeping track of the number of instructions in a path that may move upward. Once the number of upward movable instructions in a path has been computed before enumeration (as described in the next subsection), the enumerator can keep track of upward mobility by decrementing the count of movable instructions each time an instruction is moved above an entrance. When the dynamic count of movable instructions in a path drops to zero, the on-trace and off-trace lower bounds can be added to compute a tighter dynamic lower bound for the path.
71
When neither condition is satisfied at a given tree node, the lower bound of a path with a side entrance is updated at that node only if the path is a gaining path with respect to the last scheduling decision made by the enumerator. 5.4.1.2 Computing Upward Mobility An instruction may move above a side entrance if it is data independent of at least one instruction above the entrance. Hence, to determine whether a given instruction may move above a side entrance, instructions above the entrance need to be checked for data dependencies with the instruction in question. In principle, it suffices to check the leaf instructions of the DDSG representing all instruction above the entrance. However, finding the leaf instructions of a DDSG requires traversing the entire DDSG anyway. So, the checking all the instruction above the entrance does not add to the complexity. The algorithm for computing upward mobility is listed as Algorithm 5.3. The main loop starting on Line 1 examines entrances in program order. The second loop on Line 2 processes all the instructions below the given entrance and computes upward mobility for each instruction with respect to that entrance. The innermost loop on Line 4 examines all instructions above the entrance and sets upward mobility to TRUE if one of these instructions is not a DDG predecessor of the instruction in question or if it is a predecessor but the latency is zero. If instruction j is dependent on instruction i with zero latency, i and j may be scheduled in the same cycle. If instruction i is scheduled in a basic block above the entrance, scheduling j in the same cycle as i is an upward code motion. The last three lines update the movable instruction counts in the related paths. If an instruction is upward movable with respect to a given entrance, the number of upward movable instructions in each path starting at that entrance and containing the instruction is incremented.
72
ComputeUpwardMobility(Trace) 1 For each side entrance ent in program order 2 For each instruction inst below ent 3 isUpwardMovable FALSE 4 For each instruction prevInst above ent in program order 5 if(IsPredecessor(inst,prevInst) = FALSE OR GetDistance(inst, prevInst) = 0) 6 isUpwardMovable TRUE; break; 7 if(isUpwardMovable = TRUE) 8 For each path starting at ent and containing inst 9 Path.upwardMovableInsts++ ←
←
Algorithm 5.3: Upward mobility
5.4.1.3 Computing Dynamic Path Lower Bounds Section 5.2.1 describes an algorithm for computing static path lower bounds by applying relaxed scheduling to each path DDSG in isolation of other paths. That isolated-DDSG algorithm does not produce tight dynamic lower bounds during enumeration because it fails to capture interactions among overlapping paths. In fact, if the isolated-DDSG algorithm is used during enumeration, a path’s dynamic lower bound will be the same as its static lower bound unless the path’s DDSG is modified by gaining or losing instructions. To illustrate the looseness of the lower bounds computed by the isolated-DDSG algorithm, consider a side path consisting of two independent instructions i and j. On a single-issue processor, the isolated lower bound for this path is 2 cycles regardless of the instructions’ scheduling ranges. Assume that during enumeration, scheduling instructions in other paths has tightened i and j’s scheduling ranges to [1,2] and [5, 7] respectively. Clearly, a tighter lower bound under these constraints is 4 cycles, which is obtained when instruction i is scheduled in Cycle 2 and instruction j is scheduled in Cycle 5. This example shows that a tight dynamic path lower bound, which accounts for inter-path dependencies during enumeration, can be computed by using instructions’ global release times and deadlines. The global release time or deadline of an instruction is its release time or deadline in the overall DDG.
73
Given a path DDSG with global release times and deadlines, a lower bound on the path’s schedule length can be computed by finding a minimum-size (MS) solution (defined in Section 2.4) to the release time deadline problem. Note that a minimum-completion-time (MCT) solution does not give a correct lower bound in this case. For example, consider the above example with two instructions and ranges [1,2] and [5,7]. A MCT solution schedules the first instruction in cycle 1 and the second instruction in cycle 5, giving an incorrect lower bound of 5 cycles. For a path starting at a side entrance, scheduling all instructions as early as possible does not necessarily give an optimal schedule for that path. An optimal solution to the MS problem is developed next. In the context of this sub-section, a feasible schedule for the RD problem is a zero-lateness schedule, and a feasible schedule at cycle c is a zero-lateness schedule that starts at cycle c. A greedy schedule is a schedule constructed by the earliest deadline rule. It has been shown in previous work that the MCT problem can be solved optimally using the earliest deadline rule [24]. Applying this result to the MS problem, it follows that for a given first cycle, a greedy schedule has a minimum size among all schedules starting at that cycle. Hence, a minimum-size solution can be found iteratively by solving a MCT problem at each possible first cycle. If rmin is the minimum release time and dmin is the minimum deadline among all instructions in the DDSG, any cycle in the interval [rmin, dmin] is potentially the first cycle of a feasible schedule. Hence, an algorithm for solving the minimum-size problem examines all cycles in the range [rmin, dmin] and searches for a feasible schedule at each cycle. The following theorem establishes a result that can be used to speedup the search in the interval [rmin, dmin]. Theorem 5.1: If C* is the latest cycle in the range [rmin, dmin] at which a feasible schedule exists, then the minimum-size schedule starting at C* is also a global minimum, that is, no schedule starting at a cycle in the interval [rmin, C*-1] can be shorter than the shortest feasible schedule starting at C*.
74
Intuition: This theorem states that given a minimum-size feasible schedule that starts at cycle c+x, starting the schedule x cycles earlier cannot help produce a more compact schedule. This is because allowing the schedule to start earlier may allow some instructions to be scheduled early, but scheduling instruction early has a double effect: a potentially earlier last cycle (positive effect that tends to reduce the size) and a potentially earlier first cycle (a negative effect that tends to increase the size). The proof below shows that the positive effect can at best compensate for the negative effect. So, the net gain can never be positive. Proof: The theorem can be proven by showing that a feasible greedy schedule S that starts at cycle c has at least the same number of empty cycles as a feasible greedy schedule S* that starts at cycle c+x, where x is a positive integer. Consider an empty cycle sv in S*. All instructions scheduled before sv in S* can also be scheduled before sv in S because in S more cycles are available before sv. Furthermore, because S* schedules each instruction in the earliest available cycle, all the instructions that are scheduled after sv in S* must have release times greater than sv. Therefore, all the instructions that are scheduled after sv in S* are also scheduled after sv in S. Hence, every empty cycle sv in S* is also an empty cycle in S, which implies that the size of S is equal to or greater than the size of S*.
ComputeDynamicLowerBound(DDSG) 1 Find rmin and dmin 2 For each cycle c from dmin to rmin 3 Set each release time r to Max(r, c) 4 feasible FindGreedyRelaxedSchedule(DDSG) 5 If(feasible = TRUE) 6 return lastCycle-firstCycle+1 7 return INFEASIBLE ←
Algorithm 5.4: Dynamic path lower bounds
It follows from this theorem that given a DDSG with minimum release time rmin and minimum deadline dmin, the search for a minimum-size schedule can start at dmin and examine potential first
75
cycles in decreasing order. The algorithm terminates as soon as a feasible schedule has been found. The algorithm is listed as Algorithm 5.4.
5.4.2 Cost-Based History Domination The history domination technique used in basic-block scheduling is length based, that is, pruning is based on a set of conditions under which infeasibility of the target length below a history node implies infeasibility of the same length below the current node. In optimal trace scheduling, the enumerator searches for a feasible schedule at the target length with cost less than the current best cost. Hence, it is desirable to develop a domination technique based on cost rather than length. This sub-section develops such a technique. First, it is noted that there are differences between the trace scheduling algorithm and the basic-block scheduling algorithm. These differences can be summarized as: •
In basic-block scheduling the objective is minimizing the schedule length of one path, while in trace scheduling the objective is minimizing a weighted sum of schedule lengths across multiple paths. In order for a given tree node x to dominate another tree node y in trace scheduling, x has to dominate y for all paths.
•
Basic block enumeration at a given target length is complete as soon as a feasible schedule is found, while trace enumeration may explore multiple feasible schedules at each target length. Hence, tree nodes that have been fully explored during trace enumeration may have feasible schedules below them. The objective of history-based domination in this case is to determine whether any of the feasible schedules below the current tree node may have a cost less than the best feasible schedule below the history node.
•
Unlike basic-block scheduling, trace scheduling involves compensation code. At a given tree node, each code path in a trace schedule has, in general, three sections: the compensation code, scheduled on-trace code and unscheduled on-trace code. The difficulty with compensation code is that it is not scheduled; rather, its cost is estimated according to the cost
76
model. Therefore, when compensation code is involved, comparison between the current node and the history node must take the compensation cost into account. These differences indicate that cost-based domination requires a stronger condition than the length-based domination (Section 4.4.3). For a history node x to cost dominate a current node y, not only does x have to have a feasible schedule whenever y has one, but x also has to have a feasible schedule whose cost is less than or equal to the minimum cost of a feasible schedule (if any) below y. As shown below, the sufficient condition for cost domination includes the resource and latency conditions of Theorem 4.1 as well as two cost-specific conditions: the partial-cost condition and the compensation-code condition. Definition 5.1: Cost Domination: Tree node x cost dominates a similar tree node y if for any feasible schedule PyQy below y there is a feasible schedule PxQy below x such that cost(PxQy) ≤ cost(PyQy). Given two similar tree nodes x and y, it can be proven that x dominates y if the cost of the partial schedule Px is less than or equal to the cost of the partial schedule Py and the remaining scheduling sub-problem below x is not more constrained than the remaining sub-problem below y. The cost of a partial schedule is defined in a similar manner to the cost of a complete schedule: only scheduled instructions are included in the cost and unscheduled instructions are ignored. The constraints on the remaining sub-problems are the resource constraints, the latency constraints and pending compensation code effects. Resource and latency constraints are the same as the corresponding constraints in basic block scheduling. Compensation-code effects, however, are trace specific and are discussed next. 5.4.2.1 Pending Compensation Code Effects Comparison between the partial schedules at two tree nodes should include both compensation code and on-trace code. However, compensation code and on-trace code are treated differently in cost computation: the cost for on-trace code is an actual schedule length while the cost of
77
compensation code is estimated according to the cost model. This makes the comparison difficult unless compensation blocks are either identical or closed in both partial schedules. For example, consider a trace with one side entrance on a dual-issue machine. Let Px and Py be two partial schedules with equal cost, but in Px the compensation block includes one instruction i while the compensation block is empty in Py. If an instruction j that is parallel to i and has the same latency is later scheduled above the side entrance, the compensation cost in Px will not change while the compensation cost in Py will increase. To rule out such situations, the sufficient domination condition requires each compensation block to be either closed in both partial schedules or to include the same instructions in both partial schedules. This is called the compensation closure/match condition. The closure or match of compensation blocks must account for the compensation-trace interface. Recall that the compensation-block cost accounts for the stalls that are appended to satisfy any latencies between compensation code and on-trace code. The number of stalls needed is a function of the compensation-critical section of the schedule. One straightforward solution to this problem is to require all compensation-critical sections in both partial schedules to be either identical (in the case of match) or fully scheduled (in the case of closure). Whenever the compensation closure/match condition is referenced below, the compensation-critical sections are also included. When two partial schedules Px and Py are compared, a path entrance may be resolved in Px but not in Py or vise versa. Similarly, a path exit may be scheduled in one partial schedule and unscheduled in the other. However, if the compensation closure/match condition is satisfied for two similar partial schedules, every path entrance or exit either appears in both partial schedules or does not appear in either partial schedule. This is shown in the next lemma. Lemma: Given two partial trace schedules Px and Py at two similar tree nodes, such that the compensation closure/match condition is satisfied, then for each side path in the trace: 1. The path entrance is resolved in Px if and only if it is resolved in Py
78
2. The path exit is scheduled in Px if and only if it is scheduled in Py Proof: 1. Assume that a side path is resolved in Px but not resolved in Py. Let B be the first basic block in that path. Since the same instructions are scheduled in both Px and Py, there must be an instruction i that is scheduled in Block B in Px but is scheduled in some earlier basic block in Py. Instruction i will then appear in the path’s compensation block in Py but will not appear in the path’s compensation block in Px. It follows that compensation blocks are not identical in both partial schedules and that the path’s compensation block in Py is not closed, which contradicts the compensation closure/match condition. 2. The path exit is necessarily a branch instruction. It immediately follows from the similarity condition that if a branch instruction is scheduled in Px it must be scheduled in Py. Since Px and Py in this lemma are indistinguishable, only one direction of the implication (“if” or “only if”) needs to be proved. Theorem 5.2: A tree node x cost dominates a similar tree node y if all the following conditions are satisfied: 1. Partial-Cost Condition: cost(Px) ≤ cost(Py) 2. Resource Condition: For each issue type, the number of available issue slots below x is greater than or equal to the number of available slots below y. 3. Latency Condition: For each unscheduled instruction i, rx(i) ≤ ry(i). 4. Compensation Closure/Match Condition: Every open compensation block and its compensation-critical section are identical in both Px and Py. Proof: By Theorem 4.1, the resource and latency conditions imply that a feasible schedule below y is also a feasible schedule below x. It remains to show that the cost of PxQy is less than or equal to the cost of PyQy. The cost of a schedule consists of an on-trace component and a compensation component.
79
First consider the on-trace component. For any code path in the trace, it follows from the above lemma that there are only three cases to consider: Case 1: The path is fully scheduled in both Px and Py. In this case cost(PxQy) = cost(Px) and cost(PyQy) = cost(Py) for this path, and the initial inequality still holds. Case
2:
The
path
is
totally
unscheduled
in
both
Px
and
Py.
In
this
case
cost(PxQy)=cost(PyQy)=cost(Qy) for this path, and both costs increase by the same amount. Case 3: The path starts in Px or Py and ends in Qy. Since nodes x and y are at the same depth, the number of cycles added to the path’s length by Qy is the same below both x and y, thus preserving the initial inequality. Next consider the compensation component. By the compensation condition, each compensation block either matches or is closed in both partial schedules. If a compensation block is closed in both partial schedules, its cost is totally accounted for in the costs of Px and Py. If, on the other hand, a compensation block is open, then by the compensation match condition, the compensation cost of Px is equal to that of Py. Appending Qy to both partial schedules will add the same instructions to each compensation block and its compensation-critical section, thus preserving the initial inequality. 5.4.2.2 History Domination Example To illustrate history-based domination, consider the enumeration tree of Figure 5.9 for the trace of Figure 5.7. The target schedule length is four cycles on a single-issue processor. Assume for illustration that the lower bounds are three cycles for P1 (which is clearly a loose bound) and 2 cycles for P2 and that the two paths have equal weights. The enumerator first explores nodes 1 through 4 and finds the feasible schedule: . Relative to the lower bounds, the cost of this schedule is 0.5 cycles because the schedule length for P1 is one cycle longer than its lower bound. Since the cost is not zero, the enumerator continues the search and backtracks to Node 1, storing Nodes 4, 3 and 2 in the history table.
80
Starting from Node 1 again, the enumerator constructs the partial schedule at Node 6. At this point, Node 6 is similar to Node 3 in the history table and history domination checking is performed between the partial schedules Px = and Py = as follows:
0
A 1
stall 2
B 5
B
stall
3
6
C
C
4
7
Figure 5.9: History Domination Example for the trace of Figure 5.7
Partial-Cost Condition: The cost of Px is less than the cost of Py because the side-path schedule is one cycle shorter. Resource Condition: There is one empty slot available below each node. Latency Condition: Instruction C is the only unscheduled instruction. The dynamic release time of Instruction C is 4 under both nodes. Compensation Condition: No instructions are moved above the side entrance. Therefore, the compensation block is empty in both partial schedules, and this condition is satisfied. Since all the domination conditions are satisfied, Node 3 dominates Node 6 and the enumerator does not need to explore Node 6 any further. If Node 6 had been visited first, the partial-cost condition would not have been satisfied and domination checking would have failed. 5.4.2.3 History Table Data Structures Designing the history table to support cost domination checking must account for the requirements of the additional two conditions that are not present in basic block checking: the partial-cost condition and the compensation closure/match condition. This checking involves a
81
space-time tradeoff. In principle, all the data needed for checking the two additional conditions can be reconstructed at checking time and no additional elements need to be added to the history table entry. Recall that the history table entry used in basic block history domination includes enough information to reconstruct the corresponding partial schedule. Once the partial schedule has been reconstructed, partial-schedule costs and compensation block contents can be recomputed to check the partial-cost condition and the compensation condition. However, it is possible to avoid this expensive computation by adding a reasonable amount of data to the history table entry. First, the partial cost can be included in each history entry to be used for checking the partial-cost condition. Secondly, two additional data fields can be added to facilitate checking the compensation condition as described in the next sub-section. 5.4.2.4 Compensation Closure/Match Checking Algorithm This sub-section describes an algorithm for checking the compensation closure/match condition using a limited amount of space without explicitly reconstructing the compensation blocks. To simplify the presentation, accounting for the compensation-critical section is omitted; it is rather involved and has very little conceptual value. To efficiently check for the compensation condition, two data elements are added to each history entry: •
The basic block number: the number of the basic block in which the last instruction in the corresponding partial schedule is scheduled.
•
The last closed entrance: the number of the latest entrance that is closed in the history node’s partial schedule Using these two elements, the compensation closure/match condition can be checked by
implicitly comparing the compensation blocks in the history partial schedule against the compensation blocks in the current partial schedule. Compensation blocks can be compared implicitly by comparing the set of entrances that each scheduled instruction has crossed in the
82
history partial schedule with the corresponding set of entrances in the current partial schedule. The algorithm for performing this implicit comparison is based on the notion of the nearest entrance, which is defined next. Definition 5.2: The nearest entrance number e(b) of basic block b in a trace is the number of the latest entrance (in control flow order) that starts at or above b. For example, the trace of Figure 5.1 has two entrances: entrance #1 with weight 0.8 and entrance #2 with weight 0.2. Entrance #1 is the nearest entrance to blocks BB1 and BB2, and entrance #2 is the nearest entrance to block BB3. The next theorem shows that compensation blocks can be compared implicitly by comparing the nearest entrances of the basic blocks in which each instruction is scheduled. Theorem 5.3: Let Px and Py be two similar partial schedules and let bx(i), by(i) be the basic blocks in which instruction i is scheduled in Px and Py respectively, then Px and Py have identical compensation blocks if and only if for each scheduled instruction i, e(bx(i)) = e(by(i)). Proof: To prove the if part, assume that e(bx(i)) = e(by(i)) for each instruction i. It follows that there are no entrances between the basic block in which instruction i is placed in schedule Sx and the basic block in which instruction i is placed in schedule Sy. Since code is only allowed to move upward, instruction i has crossed exactly the same set of entrances (if any) between its original basic block and its destination basic block in both Sx and Sy. Since compensation code is generated only when an instruction crosses a side entrance, it follows that instruction i appears in the same set of compensation blocks in Sx and Sy. Since this is true for all scheduled instructions, it follows the all compensation blocks are identical in both Sx and Sy. The only if part is proved by contradiction. Assume that compensation blocks are identical in partial schedules Px and Py and that for some scheduled instruction i, e(bx(i))!=e(by(i)). It follows that there is at least one entrance between bx and by. But, that implies that instruction i will appear in that entrance’s compensation block in one partial schedule but not the other. It follows that
83
there is at least one compensation block that does not have same instructions in both Px and Py, which contradicts the assumption that all compensation blocks are identical. Using this theorem an algorithm can be devised to check the compensation closure/match condition without explicitly reconstructing the compensation blocks. The algorithm is listed as Algorithm 5.5.
Bool CheckCompensation(histNode) 1 for each node from histNode up to root //traverse tree nodes from the given history node up to the root 2 histNE GetNearestEntrance(node.basicBlock) 3 curNE GetNearestEntrance(node.inst.currentBasicBlock) 4 if(histNE != curNE) 5 maxNE MAX(histNE, curNE) 6 minClosedEn MIN(histNode.LastClosedEntrance, currentLastClosedEntrance) 7 if( maxNE > minClosedEn) return FALSE 8 return TRUE ←
←
←
←
Algorithm 5.5: Compensation condition checking algorithm
The main loop in the algorithm traverses the history node’s tree ancestors to examine all scheduled instructions in the corresponding partial schedule. For each instruction, the nearest entrance to its basic block in the history partial schedule histNE is compared to the nearest entrance to its basic block in the current partial schedule curNE. If the nearest entrances are different, there is a compensation block mismatch. In the latter case, the mismatching compensation blocks are checked for closure. The mismatching compensation blocks correspond to the entrances between curNE and histNE. The latest entrance with a mismatching compensation block maxNE is compared to the latest entrance that is closed in both partial schedules minClosedEn. If the last mismatching block is not closed, the procedure returns indicating failure. The algorithm return a success indication if after examining all scheduled instructions, it does not detect any mismatching compensation block that is not closed on both sides.
84
5.5 Complete Example The proposed optimal algorithm is illustrated by applying it to the trace of Figure 5.1. Scheduling is done for a single-issue processor. The analysis of the example focuses on the second pruning technique, cost-based relaxed scheduling. A feasible schedule is first produced using a heuristic technique. The critical-path list schedule of Figure 5.5 is used in this example. The heuristic schedule’s cost of 1.28 cycles is the initial cost upper bound UC. This cost upper bound and the total-schedule-length lower bound of 9 are plugged into the upper-bound formula (Equation 5.4) to compute an exclusive upper bound on the total schedule length: US = 9 + 1.28 / 0.28 = 13.6
(a) Enumeration tree 0
Cost = 0
(b) Path 1 DDSG at Node 0
A Cost = 0
1
F 2
Cost = 0.52 B
3
Cost = 0.52 G
4
A [1, 1] 1
A
C [3, 6]
[1, 1]
A [1, 1] 1
1
B [3, 5]
B [2, 5] 1
(d) Path 1 DDSG at Node 4
(c) Path 1 DDSG at Node 2
1
1
B [3, 3]
F [2, 2]
1
1
C [4, 6]
[5, 6]
F
[2, 2]
1
G [4, 4]
C
Cost =1.04 C
LB = 3
LB = 4
LB = 5
Figure 5.10: Cost-based relaxed pruning example. Computation of dynamic path lower bounds during enumeration of the trace of Figure 5.1.
Thus, the maximum schedule length that needs to be examined is 13. Any schedule of total length of 14 or greater will have a cost greater than 1.28. The first iteration explores all schedules whose total length is 9 cycles. Figure 5.10.a shows the first five nodes in the enumeration tree during this iteration. In Figures 5.10.b,c,d the DDSG of Path 1 is used as an example to illustrate the computation of dynamic path lower bounds. Initially, the ranges of all instructions in Path 1 are equal to their static scheduling ranges.
85
In the first enumeration step, Instruction A is scheduled in Cycle 1 and the enumerator steps forward to Node 1. This step does not tighten any lower bounds, and the cost at Node 1 maintains its initial value of zero (see Figure 5.10.a). In the second step, Instruction F is scheduled in Cycle 2. Since Cycle 2 is now occupied, the release time of Instruction B is tightened to 3 as shown in Figure 5.10.c. This in turn tightens the release time of Instruction C to 4. With the scheduling of Instruction F, Path 1 is a tightened path and a gaining path. Due to this gain and tightening, the dynamic lower bound of Path 1 is now 4. A similar lower bound tightening of 1 cycle occurs in Path 2 (not shown in the figure). Tightening the lower bounds of these two paths by one cycle per path tightens the cost lower bound by 0.52 (the weight of Path 1 plus the weight of Path 2). This dynamic cost appears next to Node 2 in Figure 5.10.a. A similar 1-cycle tightening of Instruction C’s release time (Figure 5.10.d) occurs when the enumerator steps from Node 3 to Node 4, scheduling Instruction G in Cycle 4 (Figure 5.10.a). The resulting dynamic cost of 1.04 is shown next to Node 4 in Figure 5.10.a. Enumeration continues down that path in the tree, and a feasible schedule of cost 1.04 is found (not shown in the figure). The enumerator then back tracks to the deepest tree node whose cost is less than 1.04, namely Node 3. The search continues with lower bound and cost tightening as described above until a feasible schedule of cost 0.8 (not shown) then a feasible schedule of cost 0.56 are found before the search at length 9 terminates. The schedule of cost 0.56, which is the best schedule at length 9, is shown in Figure 5.11. All paths are scheduled at their lower bounds except for Path 2, which has gained two instructions. With a best cost of 0.56, the schedule-length upper bound becomes: US = 9 + 0.56 /0.28 = 11 Thus, a schedule of total length 11 will at best have a cost equal to the current best cost of 0.56. Therefore, to complete the search only length 10 needs to be examined. An iteration at length 10 (not shown) is performed and no feasible schedule with cost less than 0.56 is found. This concludes the search with the optimal schedule of cost 0.56 shown in Figure 5.11.
86
BB1
1: A 2: B 3: C
BB2
4: 5: 6: 7:
F G D E
Estimated length of compensation block: L(CB) = 4 (2 cycles + 2 stalls)
F
1 G
CB
Cost (P1 ) = (3 - 3) * 0.24 = 0.0 Cost (P2 ) = (7 - 5) * 0.28 = 0.56 Cost (P3 ) = (9 - 9) * 0.28 = 0.0 Cost (P4 ) = (2 + 4 - 6) * 0.2 = 0.0
3
BB3
8: H 9: I
Total Cost = 0.56
Figure 5.11: Optimal schedule for the trace of Figure 5.1
In this search, with the aid of cost-based relaxed scheduling, only three feasible schedules are examined. If the search is performed without this pruning technique, 30 feasible schedules will be examined (18 schedules at length 9 and 12 schedules at length 10), mainly due to the many possible placements of the upwardly movable instructions F and G.
5.6 Experimental Results The optimal trace scheduling algorithm described in this chapter was implemented and applied to a set of traces generated by the Gnu Compiler Collection (GCC). The superblock formation feature in GCC 3.4 was modified to generate traces by bypassing the tail duplication phase and eliminating the single-entrance restriction.
The SPEC CPU2000 benchmarks were compiled
with the modified GCC compiler and the DDGs of the traces were input to the optimal scheduler. Scheduling was performed for the same four machine models used in basic block scheduling, namely: •
Single issue with a unified pipeline
•
Three issue, with two integer and one floating point (FP) pipeline (branch and memory operations execute on the integer pipeline)
•
Four issue, with one integer, one memory, one FP and one branch pipeline
87
•
Six issue, with two integer, two memory, one FP and one branch pipeline Instruction latencies are 2 cycles for FP adds, 3 cycles for loads and FP multiplies, 9 cycles for
FP divides and 1 cycle for all other instructions. The scheduling experiments were performed on a 3-GHz Pentium 4 processor with 2 GB of main memory.
5.6.1 Trace Distribution Table 5.1 shows some statistics for the traces used in the experiments. There are a total of 10679 traces in the fp2000 suite and 33645 traces in the int2000 suite, including large traces with up to 1292 instructions, 54 basic blocks and 681 paths. On average, the fp2000 traces have more instructions but fewer basic blocks and fewer paths per trace than the int2000 traces. This is an expected distribution because int2000 programs are more control intensive and therefore have more branches and smaller basic blocks.
Table 5.1: Trace distribution in the SPEC CPU2000 benchmarks
Instructions per trace Basic blocks per trace Paths per trace Main path weight
FP2000 Max Avg. 1292 27 23 3.1 212 4.1 99% 51%
INT200 Avg. Max 454 20 54 3.7 681 6.0 99% 49%
5.6.2 Heuristic Schedules In the proposed optimal scheduler, a heuristic technique is used first to find an initial feasible schedule. Two different heuristics were used in the experiments: Critical Path (CP) and Successive Retirement (SR). After applying each heuristic to a trace, static path lower bounds were computed and the cost function was evaluated. If the cost is zero, the heuristic schedule is optimal. Otherwise, it may be sub-optimal. Table 5.2 shows the percentage of traces whose heuristic schedules had zero cost.
88
There does not seem to be any interesting difference between the two benchmark suites. The results are consistent with the objective of each heuristic. The CP heuristic tries to minimize total schedule length resulting in many upward code motions that cause side–path degradation and excessive compensation code. That explains why CP performs better on wider-issue machines where the abundance of issue slots leaves enough slots for side paths, thus limiting their degradation. The SR heuristic, on the other hand, tries to minimize side-path degradation and compensation code size by limiting the amount of upward code motion. Hence, SR out-performs CP on narrow-issue machines where there is stronger competition among paths for issue slots. Overall, CP slightly over-performs SR on most machines. Therefore, CP is used to generate the initial feasible schedule for the enumeration results presented below.
Table 5.2: Percentage of traces with zero-cost heuristic schedules (a) Int2000 ISSUE RATE 1-Issue 3-Issue 4-Issue 6-Issue
CP 65% 72% 79% 82%
SR 79% 71% 78% 81%
CP 71% 74% 74% 81%
SR 79% 74% 72% 80%
(b) Fp2000 ISSUE RATE 1-Issue 3-Issue 4-Issue 6-Issue
5.6.3 Enumeration When the heuristic cost is non-zero, the trace is passed to the enumerator to search for an optimal schedule. Trace scheduling problems that are passed to the enumerator are considered hard problems. Optimal scheduling results for the hard problems for each machine model under study are shown in Table 5.3.a for the int2000 benchmarks and in Table 5.3.b for the fp2000
89
benchmarks. The CP heuristic was used to generate the initial feasible schedule. The first row shows the number of hard traces in each case. Enumeration results are analyzed next in terms of scheduling time and schedule improvement.
Table 5.3: Trace enumeration results for the hard problems (a) Int2000 1-ISSUE
3-ISSUE
4-ISSUE
6-ISSUE
AVG
1
Hard Traces
11665
9363
7078
6216
2
Traces scheduled optimally
11229 (96%)
8668 (93%)
6522 (92%)
5675 (91%)
93%
3
Traces improved and optimal
10088 (86%)
7284 (78%)
5747 (81%)
5226 (84%)
82%
4
Traces improved and non-optimal
291 (2%)
437 (5%)
353 (5%)
379 (6%)
5%
5
Traces optimal with zero cost
8707 (75%)
5827 (62%)
5114 (72%)
4800 (77%)
72%
6
Schedule length improvement (weighted cycles)
6016 (2.6%)
3634 (2.5%)
3740 (2.8%)
2717 (2.8%)
2.7%
7
Avg. solution time (ms)
18
34
43
50
36
1-ISSUE
3-ISSUE
4-ISSUE
6-ISSUE
AVG
(b) Fp2000
1
Hard Traces
3105
2728
2805
2038
2
Traces scheduled optimally
2867 (92%)
2434 (89%)
2562 (91%)
1800 (88%)
90%
3
Traces improved and optimal
2682 (86%)
2229 (82%)
2444 (87%)
1709 (84%)
85%
4
Traces improved and non-optimal
192 (6%)
189 (7%)
159 (6%)
169 (8%)
7%
5
Traces optimal with zero cost
2424 (78%)
1981 (73%)
2313 (82%)
1636 (80%)
78%
6
Schedule length improvement (weighted cycles)
1739 (1.6%)
1347 (1.9%)
2170 (2.7%)
1188 (2.1%)
2.1%
7
Avg. solution time (ms)
25
46
57
73
50
90
Scheduling Time: The enumeration time limit was set to one second per trace. The number and percentage of hard traces that were scheduled optimally within this limit are shown in Row 2. On average, 93% of the hard int2000 traces and 90% of the hard fp2000 traces were scheduled optimally within one second. Row 7 shows the average solution time per problem for the problems that did not timeout. The average trace was solved optimally within tens of milliseconds per trace. The average solution time in the fp2000 benchmarks is greater than the int2000 average because the set of hard problems in the fp2000 case includes a smaller number of traces that are on average larger than the int2000 traces. Schedule Improvement: Row 3 shows the number and percentage of hard traces whose optimal schedules were improved relative to the heuristic schedules. Row 4 shows the number and percentage of traces, which were improved but did not solve optimally in one second. Recall that the optimal trace scheduler may find improved schedules even if it does not reach optimality within the time limit. On average, 87% of the hard int2000 traces and 92% of the hard fp2000 traces were improved by enumeration. Row 5 shows that, on average, 72% of the optimal int2000 schedules and 78% of the optimal fp2000 schedules had zero cost. In a zero-cost schedule every path is scheduled at its lower bound, and hence optimality is guaranteed regardless of path weights. Row 6 shows the improvement made by the optimal scheduler relative to the heuristic scheduler as measured by the weighted schedule length. In the int2000 benchmarks, the improvement ranges from 2.6% to 2.8% with an average of 2.7%. In the fp2000 benchmarks, the improvement ranges from 1.6% to 2.7% with an average improvement of 2.1%. The larger improvement in the int2000 benchmarks is attributed to the fact that the int2000 benchmarks, on average, have more paths per trace. The more paths a trace has, the harder it is for a heuristic scheduler to find a schedule that is optimal along all paths.
91
5.6.4 Improvement per Heuristic Table 5.4 shows how the improvement varies from heuristic to heuristic. Detailed improvement data in the int2000 benchmarks is shown for two heuristics: CP and SR. Row 1 shows the overall improvement measured by the weighted schedule length, while each of Rows 2 and 3 shows the improvement of one component of the weighted length: total schedule length (or main-path length) in Row 2 and compensation cost in Row 3. The improvement in weighted schedule length ranges from 2.6% to 3.4% with an average of 2.9%. The improvement relative to the SR heuristic is systematically greater than the improvement relative to CP. This is best understood by studying the two components of improvement in Rows 2 and 3.
Table 5.4: Schedule improvement for different heuristics CRITICAL PATH 1-issue
3-issue
SUCCESSIVE RETIREMENT 4-issue
6-issue
1-issue
3-issue
4-issue
AVG 6-issue
3634 3740 2717 4049 4880 4486 3048 6016 (2.6%) (2.5%) (2.8%) (2.8%) (2.8%) (3.2%) (3.4%) (3.0%) (2.9%)
1
Weighted length imp.(cycles)
2
Total length imp. (cycles)
60 (0%)
62 (0%)
874 (0.1%)
42 (0%)
3
Comp. cost imp. (cycles)
4324 (36%)
2933 (17%)
2791 (15%)
2359 -2278 (13%) (-33%)
5543 3911 2924 768 (0.7%) (0.7%) (0.4%) (0.1%) (0.3%) 669 (4%)
593 (4%)
1872 (10%)
(8%)
When one component of the weighted length is considered, the two heuristics behave quite differently. CP tends to minimize total schedule length at the expense of generating more compensation code, while SR tries to minimize the amount of compensation code at the expense of producing longer schedules. That explains why the optimal scheduler provides more improvement in total length over SR (Row 2), while it provides more improvement in compensation cost over CP (Row 3). Row 3 shows that optimal schedules have significantly less compensation code than the heuristic schedules in all cases except for the SR schedules on a single-issue machine. Significant improvement in compensation-code size of the optimal scheduler over CP is expected because CP is not compensation-code conscious. Interestingly, the optimal scheduler also reduces 92
compensation cost compared to SR on all multiple-issue machines. Although SR tries to minimize compensation code by avoiding upward code motion, it greedily schedules an instruction when the ready list is not empty. As explained in Section 5.3.1, this greedy strategy often results in costly upward code motions when the ready list contains only external instructions. The greedy strategy results in more upward code motions on wider issue machines where there are more opportunities for moving external instructions up without conflicting with local instructions. On narrower issue machines, fewer issue slots are available, which makes it less likely for the ready list to contain only external instructions. The negative compensation-cost improvement in the single-issue case thus reflects the fact that the optimal scheduler was not able to optimize the weighted schedule length without often favoring an external instruction over a local instruction.
5.6.5 Time Limit Similar to the basic block case, an experiment was done to study the rate of decrease in timeouts as the time limit is increased. The 3-issue model and the CP heuristic were used in the experiment. The 12091 hard problems in both benchmark suites were scheduled using time limits between 10 ms and 1000 seconds. The results are shown in Table 5.5 and plotted in Figure 5.12. Table 5.5: Unsolved problems for different time limits TIME LIMIT (S) UNSOLVED PROBLEMS 0.01 0.1 1 10 100 1000
3572 1901 972 567 349 210
Unlike the basic-block graph, the log-log graph in this case exhibits a consistent linear behavior. Since the number of timeouts for traces is much larger than the corresponding number for basic blocks, the trace data is more statistically significant than the basic block data.
93
Therefore, the trace results of this sub-section are likely to be more accurate than the basic block results of Subsection 4.5.4. The linear log-log graph corresponds to a polynomial relation of the form U = a Tb, where T is the time limit, U is the number of unsolved problems, a and b are constants with b equal to approximately -0.3. The slow decay rate in this empirical formula suggests that the proposed optimal algorithm is unlikely to solve all the problems within reasonable time.
Unsolved Problems
10000
1000
100
10
1 0.01
0.1
1
10
100
1000
Time Limit (second) Figure 5.12: Unsolved problems as a function of time limit (logarithmic scale)
5.6.6 Pruning Techniques To study the effectiveness of the different pruning techniques presented in this chapter, enumeration experiments were performed at three different levels of pruning: Level One: Only range tightening was applied. Level Two: Range tightening and cost-based relaxed scheduling were applied. Level Three: All pruning techniques, including cost-based history domination, were applied.
94
These experiments were run on the int2000 benchmarks targeting the three-issue machine model. The heuristic was CP. First, the number of timeouts with a 1-second limit was measured at all three levels of enumeration and the results are shown in Table 5.6. The percentage of timeouts dropped from 33% with the first level of pruning to 7% with the highest level of pruning.
Table 5.6: Timeouts at different levels of pruning LEVEL 1 LEVEL 2 LEVEL 3 Hard traces 9363 9363 9363 3103 1595 695 Timeouts (33%) (17%) (7%)
To fairly compare enumeration performance at the three levels, an enumeration experiment was performed on a set of traces that are solved optimally with all levels of pruning. The enumerator with level-one pruning was first applied to the hard problems in the int2000 benchmark suite. Then the traces that were solved optimally within 10 seconds with level-one pruning were enumerated using the second and third levels of pruning. The results are shown in Table 5.7. Table 5.7: Enumerator performance at different levels of pruning LEVEL 1
LEVEL 2
LEVEL 3
Number of Traces
6824
6824
6824
Avg soln. time per trace (ms)
365
43
5
Avg nodes per trace
16858
2512
181
Avg feasible schedules per length
530
15
1.6
6824 traces were solved optimally by all three levels of pruning. Three metrics are used to evaluate the enumerator’s performance: the average solution time per trace (Row 2), the average number of enumeration tree nodes that were needed to schedule a trace optimally (Row 3) and the average number of feasible schedules enumerated at each schedule length (Row 4). The experiment shows that cost-based relaxed scheduling reduces each of the three metrics by one
95
order of magnitude, and that cost-based history domination results in another order-of-magnitude reduction. Assuming ideal pruning, the enumerator does not explore more than one feasible schedule (if any) at each length. The experiments show that the ideal behavior is very well approximated when history-based pruning is used.
5.6.7 Scheduling Stalls To study the impact of scheduling stalls when the ready list is not empty, stall enumeration was disabled in an experimental version of the enumerator, and the resulting sub-optimal scheduler was compared to the optimal scheduler. The results are shown in Table 5.8. This experiment was run on the int2000 benchmarks using the CP heuristic. The time limit was one second.
Table 5.8: Impact of stall enumeration WITH STALLS 1 Hard traces
WITHOUT STALLS
1-issue
3-issue
4-issue
6-issue
1-issue
3-issue
4-issue
6-issue
11665
9363
7078
6216
11665
9363
7078
6216
Traces solved optimally
11229 8668 6522 5675 11175 8387 6259 5421 (96%) (93%) (92%) (91%) (96%) (90%) (88%) (87%)
3 Traces improved
10379 7721 6100 5605 8443 3573 2347 1459 (88%) (83%) (86%) (90%) (72%) (38%) (33%) (23%)
Weighted length imp.(cycles)
6016 3634 3740 2717 4884 1378 1378 524 (2.6%) (2.5%) (2.8%) (2.8%) (2.1%) (1.0%) (1.0%) (0.5%)
2
4
The schedule improvement due to stall enumeration is more pronounced on wider issue machines. As the issue rate increases, more opportunities become available for upward code motion. The heuristic performs an upward code motion if no local instructions are ready, while the optimal scheduler performs the upward code motion only if it improves the overall cost.
5.6.8 Solution Time and Problem Size To study the relationship between the problem size (number of instructions) and the solution time, the two variables were plotted for the fp2000 traces. The 4-issue machine model was used
96
in this experiment. Problem sizes were grouped into buckets of width 10. A trace size was rounded down to the nearest multiple of ten, and the average solution time across all traces in a size group was plotted against the corresponding multiple-of-ten size. For statistical significance, only groups with 10 or more traces were included in the graph. The solution time for a trace that did not solve was set to the time limit of 1 second. The results are shown in Figure 5.13.
Avg Solution Time (ms)
900 800 700 600 500 400 300 200 100 0 0
50
100
150
200
250
Size (instructions) Figure 5.13: Solution time as a function of trace size
Excluding the last data point, the graph exhibits a near linear relation between trace size and average solution time. The statistical correlation between the two variables in the graph is 0.87. Although this dissertation does not derive an analytical formula that expresses the average solution time as a function of the problem size, the above graph represents a rough empirical relation between these two variables. A more accurate relation can be obtained by studying a larger sample. Recall that due to the NP-completeness of the problem, the worst-case solution time is an exponential function of the trace size.
97
CHAPTER SIX Superblock Scheduling The superblock is one of the simplest global scheduling regions, which makes it an attractive choice for some compiler writers. Scheduling a superblock is more difficult than basic-block scheduling due to the presence of multiple paths. However, superblock scheduling is easier than trace scheduling because a superblock has only one entrance and requires no compensation code. Since a superblock is a special case of a trace, the trace scheduling algorithm of the last chapter can be used to optimally schedule superblocks. This chapter, however, presents a superblockspecific solution that works more efficiently than the general trace solution. The optimal superblock scheduling algorithm of this chapter is built on top of the basic-block scheduling algorithm of Chapter 4. The algorithm takes advantage of the fact that the cost of a superblock schedule is uniquely determined by the issue cycles of the exits, which are branch instructions. Exploring the solution space in monotonically increasing cost order can then be achieved by enumerating combinations of exit issue cycles. It is shown that the problem of finding exit combinations with monotonically increasing cost can be reduced to a subset-sum problem and then solved efficiently using dynamic programming. The superblock-specific solution of this chapter can be viewed as a transformation that decomposes a superblock scheduling problem into a set of basic-block scheduling problems that can be solved optimally using enumeration. The chapter is organized as follows. Section 6.1 gives an overview of the algorithm. Section 6.2 describes the static analysis that takes place before enumeration. Section 6.3 describes the details of the enumerative algorithm for superblocks. In Section 6.4 the algorithm is explained with a complete example. Section 6.5 presents and analyzes the experimental results.
98
6.1 Algorithm Overview The optimal superblock scheduling algorithm presented in this chapter is based on searching for a feasible schedule at monotonically increasing cost values. Initially, a feasible schedule of zero cost is sought by fixing all exits at their lower bounds and using the enumerator to search for a feasible schedule with non-exit instructions scheduled in the remaining issue slots. If no such schedule is found, the cost is incremented by the minimum possible value by scheduling one or more exits in later cycles within their scheduling ranges. The enumerator is then invoked again with the new fixing of exits and so forth. Fixing exits imposes additional constraints on the scheduling problem by tightening the scheduling ranges of the exits and some of their DDG successors and predecessors. Once the exits have been fixed and the ranges have been tightened, the same enumerator used for optimal basicblock scheduling (Algorithm 4.2) can be used to search for a feasible schedule that satisfies these additional constraints. All basic-block pruning techniques (Algorithm 4.3) can be applied during enumeration. The only difference then between basic block scheduling and superblock scheduling is in fixing the exits before enumeration. The details are described in the next sections.
6.2 Static Analysis Similar to basic block and trace scheduling, a heuristic is first used to find an initial feasible schedule. Path lower bounds are then evaluated and the cost of the heuristic schedule is computed. The superblock is a special case of a trace in which all paths have the same entrance and each path is uniquely determined by an exit. Therefore, the lower bound of a superblock path is equal to the static release time of the path’s exit, which is a branch instruction for side exists and the DDG’s leaf node for the final exit. This makes it possible to compute all path lower bounds by applying the Langevin-Cerny technique once in each direction to the whole DDG without having to analyze individual path DDSGs. Once the path lower bounds have been
99
computed, Equation 2.2 is used to compute the cost of the heuristic schedule. If the cost is zero, optimality is proven. Otherwise, enumeration is used to search for a minimum-cost schedule. (a) DDG A
1 [2,3]
(b) Lower Bounds
[1,1] 1 G
B
1
[2,5]
1
[3,4] C
[3,6]
H
0.3 1
1 [4,5] D
[4,7] 3
E
1 [7,8] 1
3 F
0.2
I
Inst
FLB
RLB
A
0
8
B
1
6
C
2
5
D
3
4
E
3
2
F
6
1
G
1
4
H
2
3
I
8
0
[9,9]
0.5
Figure 6.1: Lower bounds and static scheduling ranges for the superblock of Example 2.2. Ranges are for a target length of 9 cycles on a single-issue processor
Figure 6.1 shows the forward and backward lower bounds for the superblock of Figure 2.2 as computed by the Langevin-Cerny algorithm. It also shows the static scheduling ranges for a target length of 9 cycles on a single-issue processor.
(a) DDG
(b) CP
(c) SR
A 1
1
1: A G
B 1
1
C 0.3
2:B 3:G 4: C
H
5:D 1
1
6:H D
3
E
8:F
1
3
9:I
F 1
0.2
7:E
I
Cost = 0.5
0.5
1:A 2:B 3:C 4:D 5:E 6:G 7: F 8:H 9:x 10: x 11: I
Cost = 1.0
Figure 6.2: Superblock scheduling heuristics on a single-issue processor (b) Critical Path (c) Successive Retirement.
100
Figure 6.2 shows two heuristic schedules for the same superblock: a critical-path (CP) schedule and a successive-retirement (SR) schedule. The CP heuristic, which ignores side exits, succeeds in scheduling the final exit at its lower bound of 9, but delays each side exit by one cycle. Since the weights of the side paths ending at the side exists are 0.2 and 0.3. The cost of the CP schedule is 0.5 as shown in Figure 6.2.b. SR, on the other hand, schedules the side exits at their lower bounds, but at the cost of delaying the final exit by two cycles. Since the cost of the main path ending at the final exit is 0.5, the cost of delaying the final exit by 2 cycles is 1.0 as shown in Figure 6.2.c.
6.3 Enumeration As mentioned in Section 6.1, the enumerator for superblock scheduling is identical to that used for basic-block scheduling. The difference between the basic-block algorithm and the superblock algorithm, however, is that the latter fixes the exits before enumeration. This section describes the exit fixing feature and how it is used to optimally solve a superblock scheduling problems.
6.3.1 Exit Combinations and the Subset-Sum Problem According to Equation 2.5, the cost of a superblock schedule is determined by the exit issue cycles. The cost is zero when all exits are scheduled at their lower bounds. If one or more exits are scheduled at later cycles the cost is non-zero. Let possible costs for a given superblock be denoted by C0, C1, C2, …, Cn in ascending order. Each possible cost Ci is produced by a number of combinations of exit issue cycles. Each combination is called an exit combination. Exit combinations yielding a cost Ci are denoted by E1(Ci), E2(Ci), …, Em(Ci). Each exit combination Ej(Ci) can be represented as a tuple (e1, e2, …, eN) of N integers (recall that N is the number of exits), in which the element ei is the delay of exit i from its lower bound.
101
For example, consider a superblock with three exits of weights 0.1, 0.2, 0.7 and scheduling ranges [3,5], [6,7], [10,15] respectively. The zero-cost exit combination (0,0,0) corresponds to scheduling all exits at their lower bounds of 3, 6 and 10. The next possible cost is C1 = 0.1. C1 is obtained by only one exit combination: E1(C1) = (1,0,0), in which the first exit is scheduled one cycle off its lower bound while the other two exits are scheduled at their lower bounds. Note that all costs between 0 and 0.1 are not possible. C2 is equal to 0.2 with two exit combinations: B1(C2) = (2,0,0) and B2(C2) = (0,1,0). The maximum cost for the given scheduling ranges is obtained when all exist are scheduled at their upper bounds, giving the exit combination (2,1,5) with cost 3.9 cycles. In this simple example, finding all possible costs in increasing order and finding the corresponding exit combinations producing each cost could be done by inspection. However, this computation is in general non-trivial. In fact, the problem of deciding whether a given cost is possible can be reduced to a Subset-Sum problem, which is known to be NP-complete [14]. The reduction is described next. Definition 6.1: The Exit-Combination Problem: Given a set of N exits with weights w1, w2, …, wN and scheduling ranges [r1, d1], [r2, d2], …, [rN, dN], is there an exit combination that gives a cost C? Definition 6.2: The Generalized Subset-Sum Problem: Given a set S of N positive integers {n1, n2, … , nN} with integer quantities {q1, q2, … , qN} and a positive integer K, is there a linear combination a1n1 + a2n2 +…+ aNnN , (ai is an integer, 0 ≤ ai ≤ qi) that is exactly equal to K? Digression: The presence of multiplicities (element quantities) in this definition is not standard. In the standard definition of the Subset-Sum problem, each element can be used only once. However, since the standard version is known to be NP-complete, the generalized version presented here is also NP-complete. Theorem 6.1: The exit combination problem is NP-Complete
102
Proof: First it is shown that the exit combination problem is NP-hard by reducing the Generalized Subset-Sum problem to it. Let the exit weights and costs in the exit-combination problem be represented as integers relative to some common denominator. Given an instance of the Generalized Subset-Sum problem, each element ni of the set S is mapped to an exit weight wi in the exit-combination problem. The integer K maps to the cost C. Each coefficient ai in the linear combination maps to the delay of an exit i from its release time. The quantity qi of element i maps to the difference di-ri between the deadline and the release time of exit i. This shows that the exit-combination problem is NP-hard. Furthermore, the exit-combination problem is in NP because given an exit combination, the cost can be computed in polynomial time using Equation 2.2. It follows that the exit combination problem is NP-complete. Note that the reduction in the above proof is based on a symmetrical mapping that can also be used to reduce the exit combination problem to the Generalized Subset-Sum problem. According to this mapping, there is an instance of the Generalized Subset-Sum problem for each possible cost of a superblock. Using a common denominator of 10, the exit combination problem in the previous example is mapped to a three-element set {1,2,7} with quantities {2,1,5}. Finding exit combinations with zero cost corresponds to a Generalized Subset-Sum problem with K=0. The exit combination (0,0,0) is the only solution. It corresponds to a linear combination in which all three coefficients are equal to zero. The next cost C1 = 0.1 corresponds to a Generalized SubsetSum instance with K = 1, which also has one solution (1,0,0) mapping to the linear combination 1n1 + 0n2 + 0n3 = n1, and so forth. The exit-combination problem is NP-complete and can be solved efficiently using dynamic programming [14]. However, full exploration of the solution space in optimal superblock scheduling requires an exit-combination solver that not only decides whether a given cost is possible but also finds all the exit combinations that produce each possible cost. For any given cost, the number of possible exit combinations could be, in the worst case, as large as the size of the power set, which is exponential in the number of exits. In practice, however, a feasible
103
schedule is found within a small number of exit combinations due to the relatively small number of exits and the tightness of their scheduling ranges (see experimental results). An exit combination solver that finds all solutions has been implemented and integrated with the enumeration framework to form an optimal superblock scheduler as described below.
6.3.2 Dynamic Programming Solution This subsection describes the dynamic programming algorithm for solving the exitcombination problem. A dynamic programming table is constructed with each exit represented by a row and each potential cost represented by a column. Weights are passed to the exitcombination solver as integers relative to an appropriate common denominator, and costs are computed as integers relative to the same denominator. Note that columns need to be created only for costs that are multiples of the greatest common divisor of exit weights, and the first non-zero column has a cost equal to the minimum weight. A table entry is denoted by T(e, c). T(e, c) is equal to the number of exit combinations of cost c in which only exits 1 through e may be scheduled off their lower bounds and all other exits are scheduled at their lower bounds. The table is grown column by column. The solutions in each column are the exit combinations that yield the column’s cost. The first column in the table corresponds to the zero-cost exit combination (0, 0, …,0) in which all exits are scheduled at their lower bounds: T(e, 0) = 1 for all e. Using this base case, other table entries are computed recursively by noting that a table entry T(e,c) has a solution in one of two cases: Case 1: T(e-1, c) > 0 In this case, the previous entry in the same column has at least one solution. Every solution at T(e-1, c) is a valid solution at T(e, c) if exit e is kept in the same cycle. Case 2: T(e-1, c-nwe) > 1, 0 ≤ n ≤ ge
104
Where ge is the span of exit e’s scheduling range. If de and re are the deadline and release time of exit e, ge = de-re. In Case 2, there is at least one solution of cost c-nwe for some n. Every solution of cost c-nwe can be used to construct a solution of cost c by delaying exit e n cycles relative to the solution at T(e-1,c-nwe). The number of solutions at entry T(e, c) in the table is equal to the sum of case-1 solutions and case2-solutions. Since solutions at a given table entry are defined in terms of solutions at previous table entries, the solutions at each entry can be represented by a tree rooted at the entry with the leaves being the base entry T(1,0).
(a) Dynamic Programming Table Cost 0 Exit 1 Base
2
3
(b) Exit Combinations
4
5
1*
0
0
0
2
1
1
1*
0
1*
3
1
1
1
0
1*
Exit weights and range spans 1: weight = 2/10, rang span = 1 2: weight = 3/10, range span = 4 3: weight = 5/10, range span = 3
Cost = 0: (0, 0, 0) Cost = 2: (1, 0, 0) Cost = 3: (0, 1, 0) Cost = 4: NONE Cost = 5: (1, 1, 0) (0, 0, 1)
Figure 6.3: Dynamic programming table for solving the exit-combination problem
Note that since exit weights are given as integers relative to a constant denominator, the dynamic programming solution described above would run in polynomial time if the goal were only deciding whether a given cost is possible. However, to find exit combinations in increasing cost order, the solver needs to efficiently construct all possible solutions in each column in the table. The number of these solutions is in the worst case an exponential function of the number of exits. Designing an algorithm that traverses the solution trees involves a space-time tradeoff. If all
105
solutions at each table entry are stored at the entry, the search time is minimized but space usage is prohibitive in larger tables. The algorithm used in this work stores at each table entry links to the previous entries on which solutions at the current entry are based. Solutions are constructed and stored only at the current entry. Table entries are examined in column-major order. When a table entry is reached, the algorithm checks if that entry has any new solutions, that is, Case-2 solutions. If new solutions exit, the solution tree for that entry is constructed and stored at the entry. Subsequent invocations of the solver will simply return the next solution stored at the current entry. When all the solutions at the current entry have been enumerated, the solver releases the space used by the current entry and moves to the next table entry and so on. An example dynamic programming table is shown in Figure 6.3. In this example there are three exits with weights 0.2, 0.3 and 0.5 and range spans of 1, 4 and 3 respectively. Only the first five columns are shown in the figure. Weights and costs are expressed as integers relative to a common denominator of 10. New solutions based on Case 2 are marked with asterisks. The exit combinations for costs 0 through 5 are shown in Figure 6.3.b. Note that because the range span of the first exit is equal to 1, the exit cannot be delayed by more than one cycle. Hence, no solutions of cost 4 exist.
6.3.3 Enumeration with Fixed Exits The algorithm of this chapter is based on fixing the exits and using enumeration to search for a feasible schedule in which non-exit instructions are scheduled in the remaining issue slots. Exit fixing is performed in a preprocessing step before enumeration. For each exit combination, the release time and deadline of each exit are both set to the exit’s fixed issue cycle. Since this may tighten the exit’s release time and/or deadline, the fixed release times and deadlines are propagated downward and upward to tighten the release times and deadlines of the exit’s successors and predecessors. Range tightening and propagation in this phase often detects infeasibility of the current exit combination even before enumeration starts.
106
6.3.4 Search Orders There are two possible orders for enumerating exit combinations. The first order is strict cost order, where exit combinations are explored in cost order regardless of the total schedule length. The second order is total schedule length order, in which all valid costs are explored within one total schedule length before the next total schedule length is explored. The first order is easier to comprehend and implement. The second order is a bit less intuitive and trickier to implement but offers some advantages over the first order as explained below. 6.3.4.1 Cost-By-Cost Enumeration In this search scheme, strict cost order is followed even if the total schedule length is switched back and forth multiple times during the search. The algorithm is listed as Algorithm 6.1 and is explained below. OptimalScheduleSuperblock(DDG) 1 ComputeLowerBounds() 2 bestCost costUB HeuristicSchedule(DDG) 3 targetCost 0 4 while (targetCost < costUB) 5 (exitComb, targetCost) GetNextExitComb() 6 targetLength finalExitRT + finalExitDelay FixSideExits(exitComb) 7 feasible 8 if(feasible = TRUE) 9 found Fnumerate(DDG, targetLength) 10 if(found = TRUE) targetCost 11 bestCost ←
←
←
←
←
←
←
←
12 break Algorithm 6.1: Optimal superblock scheduling using cost-by-cost enumeration
The first step on Lines 1 and 2 is finding a heuristic schedule and computing its cost based on static lower bounds. The cost of the heuristic schedule is the cost upper bound costUB. The loop in the algorithm (starting on Line 4) explores all exit combinations with costs between zero and the costUB. The GetNextExitComb procedure on Line 5 is an interface to the subset-sum solver that computes possible costs in increasing order. Each invocation of this procedure returns one exit
107
combination exitComb along with the corresponding cost targetCost. On Line 6, the final exit’s delay in the returned exit combination is added to the final exit’s static release time to compute the target length passed to the enumerator. On Line 7 the exits are fixed according to the exit combination and instruction ranges are tightened accordingly. If range tightening does not detect the infeasibility of the exit combination, the enumerator is invoked on Line 9 to search for a feasible schedule that satisfies the exit fixing constraints. Since exploration is done in strict cost order, the first feasible schedule found by the enumerator is necessarily an optimal schedule and the algorithm terminates. If no feasible schedule is found with cost less that the heuristic cost, the heuristic schedule is proved optimal and the algorithm terminates. 6.3.4.2 Length-By-Length Enumeration An alternate order for exploring exit combinations is to fix the total schedule length by fixing the final exit and explore all side exit combinations at that total schedule length before moving to the next total schedule length. The advantage of this search order is that fixing the total schedule length tightens side exit scheduling ranges, which may reduce that number of exit combinations to be examined. For example, consider a superblock with two exits. The side-exit weight is 0.2 and the final exit weight is 0.8. Assume that the side exit has a FLB of 4 and a RLB of 6 and the final exit has a FLB of 10. If the total-length upper bound is 14, the scheduling range for the side exit will be [5, 14-6] = [5, 8]. If exit combinations are explored in cost order, combinations (1, 0), …, (4,0) will be examined. However, exit combinations (2,0), …, (4,0) are not feasible because when the final exit is scheduled at its release time of 11, the side exit has to be scheduled by a deadline of 11-6 = 5 cycles. Infeasibility of these combinations will not be detected until the range tightening phase that precedes the enumeration of each exit combination. If, on the other hand, length-by-length enumeration was used, schedules of total length 11 cycles are first examined. The final exit is first fixed in cycle 11 and the range of the side exit is
108
tightened to [5, 5]. With this scheduling range the only exit combination examined at total length 11 is (0, 0). Then the total length is incremented to 12, the range of the side exit is loosened to [5,6] and exit combinations (0,1) and (1,1) are examined and so on. Clearly, length-by-length enumeration helps avoid examining a number of infeasible exit combinations by tightening scheduling ranges once per total length instead of waiting until the tightening phase of each exit combination. In length-by-length enumeration, the cost is incremented within each total length by varying the issue cycles of side exits only. Therefore, the final exit is not included in the set of exits passed to the subset-sum solver. The algorithm is listed as Algorithm 6.2 and is explained next.
OptimalScheduleSuperblock(DDG) 1 ComputeLowerBounds() HeuristicSchedule(DDG) 2 bestCost 3 schedUB ComputeSchedUpperBound(bestCost) 4 For each targetLength, schedLB ≤ trgtLngth < schedUB 5 lengthDone FALSE 6 while ( ! lengthDone) GetNextExitComb() 7 (exitComb, targetCost) 8 if (targetCost >= bestCost) break 9 feasible FixSideExits(exitComb) 10 if(feasible = TRUE) 11 found Enumerate(DDG, targetLength) 12 if(found = TRUE) 13 lengthDone TRUE 14 bestCost targetCost 15 schedUB ComputeSchedUpperBound(bestCost) ←
←
←
←
←
←
←
←
←
Algorithm 6.2: Optimal superblock scheduling using length-by-length enumeration
The first two lines compute the heuristic schedule cost as it was the case in cost-by-cost enumeration. On Line 3, the total-length upper bound schedUB is computed based on the best cost bestCost using Equation 5.4, which is repeated here for convenience:
US =
UC + LS wm
109
(6.1)
where Us is the total-length upper bound, Uc is the best cost, which is the cost upper bound, wm is the main-path weight, which is the final-exit weight for a superblock and Ls is the total-length lower bound. The main loop (starting on Line 4) examines total schedule lengths between schedLB and schedUB. For each total length, the inner loop (starting on Line 6) explores side exit combinations at that length. The GetNextExitComb procedure is the same procedure used in cost-by-cost enumeration, but in this case only side exits are included in each combination. The side-exit issue cycles are fixed (Line 9) based on the exit combination returned by this procedure. If after tightening the scheduling ranges, the solution space is still not empty, the enumerator is invoked (Line 11) to search for a feasible schedule at the current total length that also satisfies the exit fixing. The search at the current total length ends when a feasible schedule is found (Line 12) or when the target cost reaches the best cost (Line 8), whichever occurs first. If a feasible schedule is found, the best cost is updated (Line 14) and the new best cost is substituted into Equation 6.1 to compute a tighter total-length upper bound schedUB (Line 15). When the search at the current target length is complete, the latest schedUB value is checked (Line 4) to determine whether the next total length needs to be examined or not. If the next total length is greater than or equal to schedUB, the algorithm terminates and the current best schedule is the optimal schedule.
6.4 Complete Example The length-by-length enumeration algorithm is applied to the example of Figures 6.1 on a single-issue processor. The Critical-Path heuristic is used to find an initial feasible schedule. As shown in Figure 6.2.a, this heuristic delays each side exit by one cycle from its lower bound. Using Equation 2.5, the cost of the initial schedule is: UC = Cost(SCP) = 1*0.3 + 1*0.2 = 0.5 .
110
As shown in Figure 6.1, the total-length lower bound LS is 9 cycles. Substituting these two values into Equation (5.4) gives the total-length upper bound: US = 9+ 0.5/0.5 = 10. Thus a schedule with a total length of 10 will at best have a cost equal to that of the known feasible schedule, which implies that searching at a target length of 10 is not necessary. The search is therefore limited to a target length of 9 (the outer loop in Algorithm 6.2 will be repeated only once). In the first iteration of the inner loop, shown in Figure 6.4, the zero-cost exit combination (0,0) is explored. Fixing the two side exits at their lower bounds and propagating the release times and deadlines yields the tightened scheduling ranges shown next to the instructions in Figure 6.4.a. For instance, by fixing instruction C in cycle 3, its range is tightened from its static value of [3,4] to [3,3]. This, in turn, tightens the scheduling range of instruction B to [2,2] (if instruction C is scheduled in cycle 3, the 1-cycle latency implies that instruction B must be scheduled by a deadline of 2). A similar argument applies to instruction F and its predecessors D and E. When the DDG with these tightened ranges is passed to the enumerator, it searches for a schedule that satisfies these scheduling ranges.
(a) DDG A
1
(b) Enumeration Tree
[1,1] 1
[2,2] B
G
[2,5]
0
1
1
Relaxed schedule
[3,3] C
H
[3,6]
1:A
0.3 [4,4] D
E
3 F
0.2
2:B
1
1
3:C
[4,6] 3
4:D 5:G
1 [7,7] 1
E
6:H X
I
0.5
?
[9,9]
Figure 6.4: Superblock enumeration. First iteration: target length=9, target cost =0.
111
The first enumeration step, shown in Figure 6.4.b, temporarily schedules instruction A in cycle 1 and examines feasibility by trying to construct a relaxed schedule that satisfies the tightened ranges. As shown in the figure, no feasible relaxed schedule is found because after filling the first five cycles, both instructions E and H must be scheduled in cycle 6 to meet their deadlines, which is impossible on a single-issue processor. Because there is no other alternative (ready instruction) at the root node, this concludes iteration 1. In this case, exploring only one tree node was sufficient to prove that there is no feasible schedule with all exits scheduled at their lower bounds. In the second iteration shown in Figure 6.5, the subset-sum solver returns the exit combination (0,1) with instruction C scheduled at its lower bound and instruction F delayed by one cycle from its lower bound. The resulting ranges (which are looser than those of the first iteration) are shown on the DDG in Figure 6.5.a. The enumerator generates the tree of Figure 6.5.b. As shown in the figure, this tree successfully grows into a complete feasible schedule of length 9 and cost 0.2.
(a) DDG A
1
[1,1] 1
[2,2] B
A G
B
[2,5] C
1
1
G
[3,3] C
H
E
3 F
3: C
E
6: H
F
7: E
I
8: F 9: I
I
0.5
2: B 4: G 5: D
[4,7] 3
1 [8,8] 1
1: A
H
1
[4,5] D
0.2
D
[3,6]
0.3 1
(c) Optimal Schedule Cost = 0.2
(b) Enumeration Tree
[9,9]
Figure 6.5: Superblock enumeration. Second iteration: target length=9, target cost =0.2.
This terminates the search at target length 9, and because the above calculations have shown that a target length of 10 does not need to be considered, the schedule of Figure 6.5.c is a provably optimal schedule.
112
6.5 Experimental Results The optimal superblock scheduling algorithm described above was implemented and then applied to a set of superblocks generated by the Gnu Compiler Collection (GCC). The SPEC CPU fp2000 and int2000 benchmarks were compiled by GCC version 3.4 with static superblock formation [27] enabled. The DDGs generated by GCC were then scheduled using the optimal technique of this chapter. Scheduling was performed for the same four machine models used in the previous chapters: •
Single issue with a unified pipeline
•
Three issue, with two integer and one floating point (FP) pipeline (branch and memory operations execute on the integer pipeline)
•
Four issue, with one integer, one memory, one FP and one branch pipeline
•
Six issue, with two integer, two memory, one FP and one branch pipeline Instruction latencies are 2 cycles for FP adds, 3 cycles for loads and FP multiplies, 9 cycles for
FP divides and 1 cycle for all other instructions. The scheduling experiments were performed on a 3-GHz Pentium 4 processor with 2 GB of main memory.
6.5.1 Superblock Distribution Table 6.1 shows statistics about the superblocks used in the experiments. There are a total of 7961 superblock DDGs from the fp2000 suite and 33431 DDGs from the int2000 suite. The set includes large superblocks with up to 1236 instructions and 42 branches. Rows 3 and 4 show the final-exit and side-exit weight distributions. Note that exit weights are represented as fractions of a hundred. As expected, the final exit is the highest weight exit with an average weight of about 2/3. The int2000 benchmarks are characterized by smaller superblocks, more branches and consequently lower per-exit weights compared to the fp2000 benchmarks.
113
Table 6.1: Superblock distribution in the fp2000 and int2000 benchmarks
Instructions per superblock Exit count Final-exit weight (%) Side-exit weight (%)
FP2000 Max Avg. 1236 24 31 2.8 99 68 48 17
INT2000 Max Avg. 454 17 42 3.3 99 66 49 14
6.5.2 Heuristics To choose the best heuristic for producing an initial feasible schedule, the following fast heuristics were evaluated: Critical Path (CP), Successive Retirement (SR) and “Dependence Height and Speculative Yield” (DHASY). When SR is used, a tie breaking scheme is needed when there are multiple ready instructions within the same basic block. In these experiments the tie breaker was DHASY.
Table 6.2: Percentage of zero-cost schedules for 3 different heuristics (a) Int2000 benchmarks DHASY 74 88 94 98
SR 92 91 95 98
(b) Fp2000 benchmarks CP DHASY 1-Issue 50 64 3-Issue 73 78 4-Issue 81 85 6-issue 92 94
SR 88 85 91 96
1-Issue 3-Issue 4-Issue 6-issue
CP 61 84 90 98
Each heuristic was applied to the superblocks in both benchmark suites. The Langevin-Cerny lower bounds were then computed and the schedule costs were evaluated. A heuristic-based schedule is optimal if its cost is zero; otherwise it may be sub-optimal. Table 6.2 shows the percentage of zero-cost schedules for each heuristic. These results indicate that, among the three
114
fast heuristics, SR has the best performance on this data set for the machine models used in these experiments. Accordingly, SR was used to generate the initial feasible schedule for the optimal scheduling experiments.
6.5.3 Enumeration According to the algorithm of this chapter, when the heuristic-based schedule has a non-zero cost, the superblock is passed to the enumerator to search for an optimal schedule. Superblock problems that are passed to the enumerator are considered hard problems. Optimal scheduling results for the hard problems in both benchmark suites for the machine models under study are summarized in Tables 6.3. The first row shows the number of hard superblocks in each case. Length-by-length enumeration was used in these experiments. Cost-by-cost enumeration is evaluated in Subsection 6.5.5. As mentioned in the previous subsection, the SR heuristic was used to generate the initial feasible schedule. The enumeration results are analyzed next in terms of scheduling time and schedule improvement. Scheduling Time: The time limit was set to one second per problem. The number and percentage of the problems that were not solved within this limit are shown in Row 2. On average, 99% of the int2000 superblocks and 97% of the fp2000 superblocks were scheduled optimally within one second. Timeouts are in the order of tens of problems for each machine model, which is comparable to the numbers of timeouts obtained for basic blocks in the fp2000 benchmarks. This result suggests that the superblock scheduling problem is not much harder than the basic block scheduling problem for the floating-point benchmarks. The average run time per problem for the problems that did not timeout is shown in Row 7. The numbers in this row show that the vast majority of the problems were solved within a few milliseconds on most machine models and in less than 20 milliseconds on the harder machine models, which are 4-issue and 6issue in the fp2000 benchmarks.
115
Table 6.3: Superblock enumeration of the hard problems (a) Int2000 benchmarks 1-ISSUE
3-ISSUE
4-ISSUE
6-ISSUE
AVG
1
Hard Superblocks
2553
3158
1703
576
1998
2
Superblocks scheduled optimally
2518 (99%)
3140 (99%)
1686 (99%)
571 (99%)
(99%)
3
Superblocks improved and optimal
2173 (85%)
2623 (83%)
1399 (82%)
465 (81%)
(83%)
4
Superblocks improved and non-optimal
12
2
1
2
4
5
Superblocks optimal with zero cost
476 (19%)
551 (17%)
758 (45%)
303 (53%)
(34%)
6
Schedule length improvement (weighted cycles)
1633 (2.9%)
1672 (3.4%)
1276 (3.5%)
413 (4.1%)
(3.5%)
7
Avg. solution time (ms)
5
9
7
6
7
1-ISSUE
3-ISSUE
4-ISSUE
6-ISSUE
AVG
953
1204
707
331
799
(b) Fp2000 benchmarks
1
Hard Superblocks
2
Superblocks scheduled optimally
944 (99%)
1175 (98%)
676 (96%)
315 (95%)
(97%)
3
Superblocks improved and optimal
844 (89%)
1048 (87%)
524 (74%)
249 (75%)
(81%)
4
Superblocks improved and non-optimal
0
0
3
0
1
5
Superblocks optimal with zero cost
293 (31%)
353 (29%)
388 (55%)
174 (53%)
(42%)
6
Schedule length improvement (weighted cycles)
545 (1.8%)
832 (3.5%)
531 (2.2%)
217 (2.2%)
(2.4%)
7
Avg. solution time (ms)
4
10
20
16
13
Performance Improvement: Row 3 shows the number and percentage of superblocks whose optimal schedules were better than their heuristic schedules. The average percentages of 83% in the int2000 benchmarks and 81% in the fp2000 benchmarks indicate that most hard problems were improved by optimal scheduling. Row 4 shows the number of superblocks that were improved but timed out before optimal scheduling was completed. This occurs in length-bylength enumeration when the optimal scheduler finds an improved feasible schedule with a
116
certain total length but times out before exploring all interesting total schedule lengths. As suggested by the numbers in Row 4, this is a rare case. Row 5 shows the number and percentage of hard superblocks for which the enumerator was able to find a zero-cost optimal schedule. Zerocost schedules are particularly interesting because they do not compromise any path in the superblock and their optimality is independent of exit weights. On average, the enumerator was able to find such weight-independent schedules for 34% of the hard int2000 problems and 42% of the hard fp2000 problems. Finally, Row 6 gives the improvement in weighted schedule length of optimal schedules relative to heuristic schedules. On average, the optimal weighted schedule length for the hard superblocks was 3.5% shorter than the heuristic weighted length in the int2000 benchmarks. In the fp2000 benchmarks, the percentage improvement was 2.4%.
6.5.4 Sensitivity to the Heuristic Enumeration results in the previous section were generated using the SR heuristic to produce an initial feasible schedule. To study the sensitivity of the enumerator’s performance to the initial heuristic, the same experiments were repeated using the other two heuristics. Table 6.4 shows the number of timeouts obtained with different heuristics when the hard int2000 superblocks were enumerated with a time limit of one second. Table 6.4: Number of superblocks timing out with different heuristics 1-ISSUE
3-ISSUE
4-ISSUE
6-ISSUE
CP
36
18
17
5
DHSY
36
18
17
5
SR
35
18
17
5
The results of this table show that the number of timeouts is essentially independent of the heuristic. This has been verified by comparing the problems that time out and it was found that the same problems time out regardless of the initial heuristic. The only exception is one problem
117
on the single-issue processor that solves in 940 ms when the heuristic is SR but times out when any of the other two heuristics is used. These results indicate that the hard problems that timeout are not solved by any of the heuristics. They also show that if a problem is solved optimally by one heuristic, the enumerator will most likely find an optimal solution rather quickly if the initial feasible solution was produced by a different heuristic.
6.5.5 Search Order As explained in subsection 6.3.4, two possible search orders are studied for superblock enumeration: length-by-length and cost-by-cost. In this subsection, the relative performance of these two search orders is evaluated experimentally. First, enumeration of the hard int2000 superblocks was repeated using cost-by-cost enumeration. The number of timeouts in each case is shown in Table 6.5 along with the corresponding number obtained using length-by-length numeration. The numbers suggest that the two search orders yield comparable results. However, length-by-length enumeration results in fewer timeouts on the 3-issue machine model.
Table 6.5: Number of timeouts for length-by-length and cost-by-cost enumeration 1-ISSUE
3-ISSUE
4-ISSUE
6-ISSUE
Length-by-Length timeouts
35
18
17
5
Cost-by-Cost timeouts
35
25
17
5
To look more closely into enumeration performance for this machine model, the two search orders were applied to a set of int2000 superblocks that are solved by both search orders. This was done by applying cost-by-cost enumeration to the set of 3140 superblocks that are scheduled optimally within one second using length-by-length enumeration. Cost-by-cost enumeration solved all 3140 problems within 1.6 seconds per problem.
118
Table 6.6 shows the detailed measurements for each search order. Row 2 shows the number of exit combinations examined in each case, while Row 3 shows the number of enumeration trees generated. Recall that before an enumeration tree is generated for a given exit combination, a preenumeration range tightening and checking phase is applied. This phase may detect infeasibility of the exit combination before the generation of an enumeration tree. As expected, cost-by-cost order examines more exit combinations due to the wider scheduling ranges, but most of these combinations are found infeasible during the pre-enumeration tightening and checking phase. This results in the generation of fewer enumeration trees in the case of cost-by-cost enumeration relative to length-by-length enumeration. Overall enumeration time in the last row shows that length-by-length enumeration is on average 12% faster than cost-by-cost enumeration for this machine model. This indicates that the additional time spent in examining more exit combinations in the cost-by-cost case overweighed the modest savings in enumeration tree nodes.
Table 6.6: Performance comparison between length-by-length and cost-by-cost enumeration Number of probs. Avg. exit combinations per prob. Avg. enumeration trees per prob. Avg. tree nodes per prob. Avg. soln. time per prob. (ms)
LENGTH-BY-LENGTH 3140 168 168 545 9.3
COST-BY-COST 3140 4441 152 537 10.6
A general observation about these results is that the average number of exit combinations examined is a few thousand combinations in the cost-by-cost case and less than two hundred in the length-by-length case. This indicates that although the number of exit combinations is in the worst case an exponential function of the number of exists, a limited number of exit combinations are actually examined on average.
119
6.5.6 Time Limit The rate of decrease in timeouts as the time limit is increased was studied experimentally for the superblock algorithm of this chapter. The 3-issue model and the CP heuristic were used in the experiment. The 7460 hard problems in both benchmark suites were scheduled using time limits between 10 ms and 10000 seconds. The results are shown in Table 6.7 and plotted in Figure 6.6.
Table 6.7: Unsolved problems for different time limits TIME LIMIT (S) UNSOLVED PROBLEMS 0.01 0.1 1 10 100 1000 10000
276 128 48 21 13 6 3
The log-log graph in this case is not fundamentally different from the corresponding graphs for basic block and traces. The log-log graph is essentially linear but with a slightly irregular behavior. The irregularity is likely to be due to the relatively small number of unsolved problems. The overall behavior, however, exhibits the same slow rate of decay seen in previous chapters.
Unsolved Problems
1000
100
10
1 0.01
0.1
1
10
100
1000
10000
Time Limit (second)
Figure 6.6: Unsolved problems as a function of time limit (logarithmic scale)
120
6.5.7 Comparison with the Trace Scheduling Algorithm Since the superblock is a trace with a single entrance, the trace scheduling algorithm of the previous chapter can be used to schedule a superblock optimally. To evaluate the performance of the general trace scheduling algorithm against the superblock specific algorithm, enumeration of the hard int2000 superblocks for the 3-issue processor was repeated using the general trace scheduling algorithm. In that experiment 62 problems timeout out, compared to 18 timeouts using the superblock-specific algorithm (see Table 6.3.a). This indicates that the superblock-specific algorithm is significantly faster. For a more detailed comparison, the two algorithms were applied to the set of superblock problems that solve optimally in one second using both algorithms.
Table 6.8: Trace algorithm vs superblock algorithm for superblock scheduling Number of probs Avg soln. time per prob (ms) Avg nodes per prob
TRACE ALGORITHM 1020 28 2564
SUPERBLOCK ALGORITHM 1020 8 239
Two metrics are used to compare the performance of the two schedulers: average solution time per problem and average number of enumeration tree nodes per problem. Both metrics indicate that the superblock specific scheduler is significantly faster than the general trace scheduler. The cost of a superblock schedule is uniquely determined by the issue cycles of the exits, which are definite instructions. The superblock specific algorithm takes advantage of this unique property of a superblock to explore the solution space in strictly increasing cost order. The cost of a trace, on the other hand, is not a function of the issue cycles of definite instructions. That makes it harder for the trace scheduler to explore the space in increasing cost order.
121
CHAPTER SEVEN Conclusion
In this chapter the findings of the work are first summarized in Section 7.1. Section 7.2 describes the potential applications of the proposed optimal algorithms. Section 7.3 outlines interesting extensions of this work.
7.1 Summary This dissertation describes the first algorithms for optimally solving two global instruction scheduling problems: trace scheduling and superblock scheduling. The algorithms were implemented and applied to traces generated by the GCC compiler using the SPEC CPU2000 benchmarks. In the int2000 benchmarks, about 93% of the hard traces and 99% of the hard superblocks were scheduled optimally within one second per problem. The performance of the optimal scheduler was studied relative to typical heuristics and was shown to improve the weighted schedule length by 2.7% for the hard int2000 traces and 3.5% for the hard int2000 superblocks. These results indicate that optimal superblock scheduling is significantly easier than optimal trace scheduling, which confirms that the superblock structure serves the purpose for which it was invented. The superblock was originally introduced to simplify the schedule construction phase by paying a code-duplication cost in the region formation phase [30]. On the other hand, traces offer more flexibility in scheduling instructions and limit code duplication by generating compensation code only when needed. The overall static instruction count for the superblocks used in this work was about twice the corresponding count for traces.
122
7.2 Applications The optimal algorithms and enumeration framework described in this dissertation can be used in the following areas: 1. Compiler Optimization: With the appropriate setting of the time limit, the optimal algorithms of this dissertation can be used at advanced levels of optimization to optimally schedule performance-critical regions of a program. Additionally, the optimal algorithms can be used by compiler engineers to evaluate and fine tune the performance of heuristic schedulers. 2. Architecture: Optimal instruction scheduling can be used by computer architects to study the limits of instruction-level parallelism. An optimal instruction scheduler measures the maximum amount of ILP that a compiler can exploit within the scope of a given scheduling region. 3. Algorithms: Instruction scheduling is a fundamentally important problem in theoretical computer science due to its NP-completeness. Hard instances of this problem are too large to analyze manually. The efficient enumeration framework developed in this work provides an experimental tool for studying the complexity of these hard problems. Specifically, by designing the right experiments, it may be possible to characterize the set of problems that time out and identify how they differ from the majority of the problems that were solved within fractions of a second. That study can help algorithm analysts gain insight into the complexity of an NPcomplete problem.
7.3 Future Work There are several interesting extensions of this work, including: 1. Generalizing the machine model to support more complex and irregular architectures. 2. Extending the enumerative algorithm of this work to optimally schedule non-linear scheduling regions, such as those used by Bernstein et al. [6] and Bharadwaj et al. [8]. 3. Studying the interaction between instruction scheduling and register allocation. 4. Experimentally characterizing the set of hard instances that timeout.
123
These extensions are briefly discussed below in view of the lessons learned in this research.
7.3.1 More General Machine Models The machine models used in this work are relatively simple and uniform. Extending the techniques to work on more complex and irregular machine models is interesting from both a theoretical and practical point of view. From a theoretical point of view, it will be interesting to explain the experimental observation made during this work that the difficulty of some instances of the scheduling problem is sensitive to even minimal changes in the machine model. From a practical point of view, most real world processors have irregular machine models that are dictated by limited hardware resources such as execution units, buffers and registers. Typical resource constraints that are not addressed in this dissertation are non-pipelined functional units, instructions that may execute on multiple execution units, instructions that cannot be in the pipeline at the same time due to conflicts on certain hardware resources … etc. Optimal instruction scheduling for more resource constrained processors is not necessarily a harder combinatorial optimization problem. There are factors that tend to make it a harder problem and factors that tend to make it an easier problem. The two main factors that make it a harder problem are: 1. It will be harder to develop tight lower bounds for an irregular machine model. Recall that the lower bounds used in this dissertation are based on analyzing each issue type separately, and this was producing looser lower bounds for machine models with more issue types. Developing tight enough lower bounds for more strongly typed and constrained processors will be a challenging problem. Tight lower bounds are critical for the success of the optimal approach used in this work. Lower bounds are used in both filtering the easier problems before enumeration and in the pruning techniques during enumeration.
124
2. It will be harder to develop relative pruning techniques, such as history-based domination and instruction superiority for an irregular machine model. Recall that one of the conditions for history-based domination is that the remaining sub-problem below the history node is not more resource constrained than the sub-problem below the current node. For the uniform machine models of this dissertation, this checking can be done easily by counting the issue slots of each type. For irregular architectures, the comparison should take into account all hardware restrictions. The factor that makes optimal scheduling for irregular architectures an easier combinatorial problem is that the solution space is smaller when the problem is more resource constrained.
7.3.2 Scheduling of Non-Linear Regions Generalizing the optimal algorithms of this work to non-linear regions faces many challenges. One main challenge is the number of paths. The number of paths within a non-linear region is in the worst case an exponential function of the number of basic blocks. It is unlikely that an optimal scheduling algorithm of a non-linear region will be successful without setting a limit on the number of paths. From a practical point of view, scheduling a non-linear region with a limited number of paths is still an interesting problem. For example, such a limit was imposed in a heuristic scheduler used in a production compiler [8].
7.3.3 Interaction between Scheduling and Register Allocation The interaction between instruction scheduling and register allocation has been studied in previous work [7, 33]. Instruction scheduling and register allocation often have conflicting requirements. A scheduler tends to insert as many instructions as possible between the definition and use of a variable. This results in increasing the register pressure [44], which is the number of symbolic variables that are live simultaneously and thus need to be stored in different physical registers. A simple optimal formulation of this problem that appears promising is incorporating
125
register pressure into the cost function or adding it as a secondary objective to the primary objective of optimizing the weighted schedule length. When multiple optimal schedules exist, selecting the schedule with minimum register pressure results in improved overall performance. Extending the objective function to account for register pressure is conceptually similar to extending the scheduling objective function from the total schedule length to a weighted schedule length. This dissertation shows that scheduling for a weighted schedule length makes it possible to find schedules that minimize the total schedule length without degrading side paths. In a similar manner, the objective function may be further augmented to include register pressure, thus making it possible to find a schedule that minimizes the weighted schedule length without increasing register pressure. Recall that the experimental results in this dissertation show that many feasible schedules often exist at a target schedule length.
7.3.4 Characterizing the Hard Problems The enumeration framework presented in this dissertation is an experimental tool that can be potentially used to characterize the hard scheduling problems that were not solved within reasonable time. It is very hard to analyze these problems manually due to their large sizes (at least tens of instructions). However, by conducting the right experiments that measure certain properties of a problem, it may be possible to understand why the pruning techniques of this dissertation work on most problems but do not work on the problems that timeout. This can be insightful in understanding the complexity of the NP-complete problem.
126
REFERENCES 1. A. Aiken and A. Nicolau, “Optimal Loop Parallelization”. ACM SIGPLAN Notices 23, No. 7, 308-317, July 1988. 2. S. Arya. “An Optimal Instruction Scheduling Model for a Class of Vector Processors”. IEEE Transactions on Computers, vol. C-34, No. 11, pp 981-995, November 1985. 3. I. Baev, W. Meleis, S. Abraham. “Backtracking-based Instruction Scheduling to Fill Branch Delay Slots”. International Journal on Parallel Programming, Vol. 30, pp. 397-418, December 2002. 4. I. Baev, W. Meleis , A. Eichenberger. “Lower Bounds on Precedence Constrained Scheduling for Parallel Processors”. Information Processing Letters, v.83 n.1, p.27-32, 16 July 2002. 5. V. Bala and N. Rubin, “Efficient Instruction Scheduling Using Finite State Automata”. International Journal of Parallel Programming, 25(2), pp. 53-82, April 1997. 6. D. Bernstein and M. Rodeh, “Global Scheduling for Super-scalar Machines”. In Proceedings of Programming Language Design and Implementation, June 1991, pp 241-255. 7. D. Berson, R. Gupta and M. Soffa. “Integrated Instruction Scheduling and Register Allocation Techniques”. In proceedings of the 11th International Workshop on Languages and Compilers for Parallel Computing, Chapel Hill, NC, August 1998. 8.
J. Bharadwaj, C. McKinsey, "Wavefront Scheduling: Path Based Data Representation and Scheduling of Subgraphs". Journal of Instruction-Level Parallelism, v.1 n. 6, pp. 1-6, 2000.
9. R. Blainey, “Instruction Scheduling in the TOBEY Compiler”, IBM Journal of Research and Development, 38(5), pp. 577-593, September 1994. 10. CM. Chang, CM. Chen and CT. King. “Using Integer Linear Programming for Instruction Scheduling and Register Allocation in Multi-Issue Processors”. Computers and Mathematics with Applications, vol. 34, No 99, pp 1-14, 1997.
127
11. P. Chang, N. Warter, S. Mahlke, W. Chen, and W. Hwu. “Three Superblock Scheduling Models for Superscalar and Superpipelined Processors”. Technical Report CRHC-91-29, Center for Reliable and High-Performance Computing, University of Illinois, Urbana, IL, Dec. 1991. 12. C. Chekuri , R. Johnson , R. Motwani , B. Natarajan , B. Rau and M. Schlansker. "ProfileDriven Instruction Level Parallel Scheduling with Applications to Superblocks”.
In
Proceedings of the 29th International Symposium on Microarchitecture, pp. 58-67, Dec. 1996. 13. H. Chou, C. Chung. "An Optimal Instruction Scheduler for Superscalar Processor”. IEEE Transactions on Parallel and Distributed Systems, v.6 n.3, pp. 303-313, Mar. 1995. 14. T. Cormen, C. Leiserson and R. Rivest. 1990. Introduction to Algorithms. MIT Press. 15. B. Deitrich and W. Hwu. “Speculative Hedge: Regulating Compile-Time Speculation Against Profile Variations”.
In
Proceedings of the 29th International Symposium on
Microarchitecture, pp. 70 -79, Dec. 1996 16. K. Ebcioglu, R. Groves, K. Kim, G. Silberman and I. Ziv, “VLIW Compilation Techniques in a Super-Scalar Environment”, ACM SIGPLAN Notices, 29(6), pp. 36-48, June 1994. 17. A. Eichenberger and W. Meleis, “Balance Scheduling: Weighting Branch Tradeoffs in Superblocks”. In Proceedings of the 32nd International Symposium on Microarchitecture, pp. 272-283, Nov. 1999. 18. A. Eichenberger and E. Davidson, "A Reduced Multi-pipeline Machine Description that Preserves Scheduling Constraints". In the Proceeding of the ACM SIGPLAN Conference on Programming Language Design and Implementation (PLDI), Philadelphia, PA, 12-22, May 1996. 19. P. Faraboschi, J. Fisher and C. Young. “Instruction Scheduling for Instruction Level Parallel Processors”. Proceedings of the IEEE, v. 89 n. 11, pp. 1638-1659, Nov. 2001.
128
20. J. Ferrante, K. Ottenstein, and J. Warren. “The Program Dependence Graph and its uses in Optimization”. ACM Transactions on Programming Languages and Systems, 9(3):319--349, July 1987. 21. J. Fisher. “Trace Scheduling: A Technique for Global Micro-Code Compaction”. IEEE Transactions on Computers, v. 30 n.7, pp. 478-490, Jul. 1981. 22. G. Frederickson. “Scheduling Unit-Time Tasks with Integer Release Times and Deadlines”. Information Processing Letters, v 16, pp. 171-173, 1983. 23. S. Freudenberger, T. Gross, P. Lowney, “Avoidance and Suppression of Compensation Code in a Trace Scheduling Compiler”. ACM Transactions on Programming Languages and Systems, vol. 16, No 4, pp 1156-1214, 1994. 24. M. Garey, D. Johnson, B. Simons and R. Tarjan. “Scheduling Unit-Time Tasks with Arbitrary Release Times and Deadlines”. SIAM Journal of Computing, 10, 2, pp 256-269, May 1981. 25. M. Golumbic and V. Rainish, “Instruction Scheduling Beyond Basic Blocks”. IBM Journal of Research and Development, 34(1), pp. 93-97, January 1990. 26. R. Gupta, “A Code Motion Framework for Global Instruction Scheduling”. In Proceedings of the International Conference on Compiler Construction, Lisbon, Portugal, pp. 219-233, March 1998. 27. R. Hank, S. Mahlke, R. Bringmann, J. Gyllenhaal and W. Hwu. “Superblock Formation Using Static Program Analysis”. In Proceedings 26th International Symposium on Microarchitecture, pp. 247-255, Dec. 1993. 28. W. Havanki, S. Banerjia, and T. Conte. "Treegion Scheduling for Wide-issue Processors." In proceedings of the 4th International Symposium on High-Performance Computer Architecture (HPCA-4), February 1998. 29. J. Hennessy, T. Gross. “Postpass Code Optimization of Pipeline Constraints”. ACM Transactions on Programming Languages and Systems, v. 5, pp. 422-448, 1983.
129
30. W. Hwu, S. Mahlke, W. Chen, P. Chang, N. Warter, R. Bringmann, R. Ouellette, R. Hank, T. Kiyohara, G. Haab, J. Holm and D. Lavery, "The Superblock: An Effective Technique for VLIW and Superscalar Compilation". Journal of Supercomputing, v. 7 n. 1/2, pp. 229-248, 1993. 31. J. Jackson. “Scheduling a Production Line to Minimize Maximum Tardiness”. Research report 43, Management Science Research Project, UCLA, 1955. 32. D. Jacobs, J. Prins, P. Siegel and K. Wilson. “Monte Carlo Techniques in Code Optimization”. In Proceedings of the 15th Annual Workshop on Microprogramming, pp 143148, Oct 1982. 33. C. Kessler. “Scheduling Expression DAGs for Minimal Register Need”. Computer Languages 24, pp 33-53, 1998. 34. U. Kremer. “Optimal and Near Optimal Solutions for Hard Compilation Problems”. Parallel Processing Letters, 7(2), pp 371-378, 1997. 35. D. Kstner and S. Winkel. “ILP-based Instruction Scheduling for IA-64”. In proceedings of the ACM SIGPLAN Workshop on Languages, Compilers and Tools for Embedded Systems, June 2001. 36. J. Lah, D. Atkin. “Tree Compaction of Micro-Programs”. In proceedings of the 16th Annual Workshop on Micro-Programming, pp 23-33, Oct 1983. 37. M. Lam. “Software Pipelining: an Effective Scheduling Technique for VLIW Machines”. ACM SIGPLAN Notices 23, No. 7, 318-328, June 1988. 38. M. Langevin, E. Cerny. “A Recursive Technique for Computing Lower-Bound Performance of Schedules”. ACM Transactions on Design Automation of Electronic Systems, v. 1 n. 4, pp. 443-456, Oct. 1996. 39. J. Linn. “SRDAG Compaction – A Generalization of Trace Scheduling to Increase the Use of Global Context Information”. In proceedings of the 16th Annual Workshop on MicroProgramming, pp 11-22, Oct 1983.
130
40. P. Lowney, S. Freudenberger, T. Karzes, W. Lichtenstein, R. Nix, J. O’Donnell and J. Ruttenberg, “The Multiflow Trace Scheduling Compiler”. The Journal of Supercomputing, vol. 7 pp. 51-142, March 1993. 41. S. Mahlke, D. Lin, W. Chen, R. Hank and R. Bringmann, "Effective Compiler Support for Predicated Execution Using the Hyperblock". In proceedings of the 25th Annual International Symposium on Microarchitecture, Portland, Oregon, pp. 45-54, December 1992. 42. W. Meleis, A. Eichenberger and I. Baev. “Scheduling Superblocks with Bound-Based Branch Trade-offs”. IEEE Transactions on Computers, v. 50 n. 8, pp. 784-797, August 2001. 43. S. Moon and K. Ebcioglu. “An Efficient Resource Constrained Global Scheduling Technique for Super-Scalar and VLIW processors”. In proceedings of the 25th International Symposium on Microarchitecture (MICRO-25), pages 55--71, 1992. 44. S. Muchnick. “Advanced Compiler Design and Implementation”. Morgan Kaufmann, 1997. 45. T. Muller. “Employing Finite Automata for Resource Scheduling”. In Proceedings of the 26th International Symposium on Microarchitecture, pages 12-20, 1993. 46. M. Narasimhan, J. Ramanujam. “A Fast Approach to Computing Exact Solutions to the Resource-Constrained Scheduling Problem”. ACM Transactions on Design Automation of Electronic Systems, v.6 n.4, pp 490-500, Oct. 2001. 47. C. Norris, L. Pollock. “An Experimental Study of Several Cooperative Register Allocation and Instruction Scheduling Strategies”. In Proceedings of the 28th International Symposium on Microarchitecture, pp 169-179, 1998. 48. D. Patterson and J. Hennessey, “Computer Architecture: A Quantitative Approach”, Morgan Kaufmann Publishers Inc, San Francisco, California (1996). 49. T. Proebsting and C. Fraser, “Detecting Pipeline Structural Hazards Quickly”. In proceedings of the Symposium on Principles of Programming Languages, ACM Press, 1994.
131
50. V. Ramanan and R. Govindarajan. “Resource Usage Models for Instruction Scheduling: Two New Models and a Classification”. In proc. of the International Conference on Supercomputing, Rhodes, Greece, 1999. 51. M. Rim, R. Jain. “Lower-Bound Performance Estimation for the High-Level Synthesis Scheduling Problem”. IEEE Trans. on Computer-Aided Design of Integrated Circuits and Systems, v.13 n. 4 , pp. 451 – 458, Apr. 1994. 52. E. M. Riseman and C. Foster. “The Inhibition of Potential Parallelism by Conditional Jumps”. IEEE Transactions on Computers, vol. C-21, pp 1405-1411, Dec 1972. 53. M. Smith, M. Horowitz, M. Lam. “Efficient Superscalar Performance through Boosting”. In proc. 5th Int. Conf. on Architectural Support for Programming Languages and Operating Systems, pp 248-259, 1992. 54. B. Su, S. Ding, L. Jin. “An Improvement of Trace Scheduling for Global Microcode Compaction”. In proceedings of the 17th Annual Workshop on Microprogramming, 1984. 55. M. Tokoro, E. Tamura and TTakizuba, “Optimization of Micro-Programs”. IEEE Transactions on Computers, vol. C-30, pp 491-504, July 1981. 56. P. Van Beek and K. Wilken. “Fast Optimal Instruction Scheduling for Single-Issue Processors with Arbitrary Latencies”. In Proceedings of the 7th International Conference on Principles and Practice of Constraint Programming, Paphos, Cyprus, pp 625-639, November 2001. 57. M. Weiss. “Data Structures and Algorithm Analysis in C++”. Addison-Wesley, second edition, Feb 1999. 58. K. Wilken, J. Liu, and M. Heffernan. “Optimal instruction scheduling using integer programming”. In Proceedings of the ACM SIGPLAN 2000 Conf. on Programming Language Design and Implementation, pp 121-133, Vancouver, 2000
132
59. S. Winkel. “Exploring the Performance Potential of Itanium Processors with ILP-Based Scheduling”. In proceedings of the International Symposium on Code Generation and Optimization (CGO2), 2004. 60. L. Wolsey. “Integer Programming”. John Wiley and Sons, 1998. 61. C. Young and M. Smith. “Better Global Scheduling using Path Profiles”. In Proceedings of the 31st International Symposium on Microarchitecture (MICRO-98), pages 115-126, Los Alamitos, November 30--December 2 1998.
133