ABSTRACT: As one of the most important parts of flying insects and flapping-wing micro air vehicles (FW-. MAVs), the wings are responsible for the generation of ...
Optimal pitching axis of flapping-wings for hovering flight Q. Wang & J.F.L. Goosen & F. van Keulen Department of Precision and Microsystems Engineering Delft University of Technology, Delft, The Netherlands
ABSTRACT: As one of the most important parts of flying insects and flapping-wing micro air vehicles (FWMAVs), the wings are responsible for the generation of aerodynamic forces and moments through the interaction between wings and surrounding air. This way, insects and FWMAVs are able to achieve hover, forward flight, maneuvers, etc. The lift and thrust produced by the flapping of the wings are mainly determined by the flapping motion and wing shapes. Flapping motion with passive pitching has been observed in insect flight and proven feasible for FWMAVs, and is the preferred design as it simplifies the driving mechanism. The passive pitching motion is achieved with the help of the wing inertia, aerodynamic loads and the rotational stiffness of the torsional spring that connects the rigid planar wing with the driving mechanism. Although the flapping kinematics, wing shape and rotational stiffness have been investigated, the influence of the location of the wing pitching axis was not considered before. Given the wing area distribution along the wing span, the sweeping and heaving motions, the hinge flexibility and the position of pitching axis are determining factors for the force generation and power consumption. Consequently, they are selected as design variables in the present study. The optimization is conducted by searching for the most energy-efficient combination of the hinge stiffness and pitching axis position for the hovering flight with sufficient lift. For this non-convex problem, a hybrid optimization method is adopted by applying a global optimization method for the rough solution and a gradient-based method for the precise optimum. Based on basic morphological and kinematic parameters of the Hawk moth, the results show an increased normalized distance between the leading edge and the pitching axis from wing root to tip, which is similar to that of the Hawk Moth wing. Optimizing the pitching axis can reduce power by 35 percent or more compared to the optimized wing with the pitching axis located at the leading edge, as is widely used by FWMAVs at present.
1
INTRODUCTION
The increasing interest in flapping-wing micro air vehicles (FWMAVs) boosts the study of insect flights, which consist of hovering flight, forward flight, quick manoeuvring, etc. Insects and FWMAVs exhibit a variety of forward flights that have different forward speeds, flight trajectories and objectives (e.g., for maximum flying time or distance). However, their hovering flight has more characteristics in common. For instance, they reciprocate their wings with fast reversals between two adjacent half-strokes. Unsteady aerodynamics makes a dominant contribution to the lift generation for almost all hovering flights (Dickinson, Lehmann, & Sane 1999). Hovering flight is a requisite capability for most insects and FWMAVs, which also requires more energy than the forward flight with intermediate speed (Willmott & Ellington 1997b), implying the significance of paying attention to the hovering flight. Consequently, this paper concentrates on the hovering flight of the Hawk moth and
its implication for FWMAV wing design. The Hawk moth (Manduca sexta) is a typical insect species that has a relatively large size and has been studied intensively by biologists from the perspective of wing morphology, flapping kinematics and flight power consumption (Willmott & Ellington 1997a, Willmott & Ellington 1997b). As one of the most important parts of insects and FWMAVs, their wings are responsible for the generation of aerodynamic forces and moments through interaction between the wings and surrounding air. The lift and thrust produced by the flapping of the wings are mainly determined by flapping kinematics and wing shapes. Flapping kinematics with passive pitching has been observed and proven feasible in insect flights, and is a preferred concept for FWMAVs as it simplifies the driving mechanism. For insect flight, the passive pitching is achieved with the help of wing inertia, aerodynamic loads and distributed wing flexibility. In this paper, the sweeping motion (yaw) and heaving motion (roll) are prescribed referring to kine-
FLAPPING-WING DESCRIPTION
zc
yc
yi
x i
LE
TE
xc
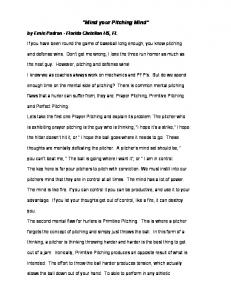
Figure 1: Illustration of Euler angles for flapping kinematics. xi yi zi and xc yc zc represent the inertial CS (in green) and corotating CS (in red) , respectively. Gray circles denote the wing tip trajectory. Sweeping motion
Heaving motion
100
10 5
50
θ(t) [Deg]
2
zi
φ(t) [Deg]
matics data of the Hawk moth F2 studied by Willmott & Ellington (1997a), while the passive pitching motion is modeled by representing the distributed wing flexibility with a combination of a rigid wing model and a torsional spring at its root. It is clear that longer span length and wing area tend to increase lift production. However, the knowledge on the influence of the wing shape on force generation and power consumption is limited. Especially, the pitching axis that is defined as the longitudinal axis connecting the wing root and tip is significant for the amplitude of the passive pitching (Whitney & Wood 2010) and, thus, for the lift generation and power consumption. Consequently, based on the same span and aspect ratio as the Hawk moth F2, we optimize the position of the pitching axis by searching for a hovering flight with the minimal power consumption. Afterward, the optimal pitching axis position and corresponding passive pitching motion will be compared with the data of the real moth wing.
0
0 −5 −10
Insect wings are thin cuticular structures that consist of membranous regions supported by veins, which serve to increase the spanwise stiffness and to maintain the wing shape to facilitate the aerodynamic force generation (Dudley 2002). The spatial movement of the insect wings is generally defined with three Euler angles, i.e., the sweeping angle φ, the heaving angle θ and the pitching angle η, as illustrated in Figure 1. For insects, the wing sweeping motion is driven by muscles inside the insect thorax in a direct or an indirect way. The heaving motion, which represents the motion out of the stroke plane, is generally accompanied with the sweeping motion. The wing pitching results from the wing deformation which includes the wing chordwise bending and spanwise torsion. This deformation is generally considered to be passive as a result of the wing inertia and the aerodynamic forces. Both the wing inertia and the aerodynamic force generation are related to the wing shape, especially the position of the pitching axis. 2.1 Flapping kinematics The sweeping and heaving motion is prescribed by fitting the kinematic data of the Hawk moth F2, whose average flapping frequency is about 25.4 [Hz], as shown in Figure 2. A ”banana” shape of wing tip trajectory is thus defined (see Figure 7 in Willmott & Ellington (1997a)). Two coordinate systems (CSs) are of interest for the study of insect flights, i.e., the inertial CS xi yi zi and the co-rotating CS xc yc zc which is fixed to the wing. Aerodynamic forces are analyzed and calculated in the co-rotating CS and then transformed into the inertial CS to evaluate whether or not the wing design
−50 0
0.5 t/T
1
−15 0
0.5 t/T
1
Figure 2: Prescribed sweeping and heaving motions
is able to produce sufficient lift and thrust. The velocity and acceleration of the wing expressed in the co-rotating CS is necessary during the aerodynamic analysis, which can be calculated by, vc = ωc × P c,
(1)
ac = ω˙ c × P c + ω c × (ωc × P c ) ,
(2)
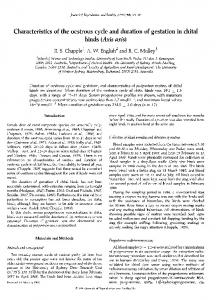
where ω c is the wing angular velocity in the corotating CS, which can be obtained by, ˙ T + RT RT [0, θ, ˙ 0]T + [η, ω c = RTη RTθ RTφ [0, 0, φ] ˙ 0, 0]T , η θ (3) where Rη , Rθ and Rφ are the coordinate transformation matrices. 2.2 Wing shape To characterize an insect wing shape as shown in Figure 3, full information of the wing span R, the aspect ratio AR defined as R divided by average chord length c¯, and the wing area distribution both in the chordwise and spanwise directions is necessary. For the moth wing, R is 52.1[mm], AR is 2.76, and the spanwise wing area distribution is characterized with parameter rˆ1 , which represents the span-normalized distance from the centroid to the wing root. The value
of rˆ1 for the moth F2 is set to 0.45, a value measured for a similar size of Hawk moth by Ellington (1984). The chordwise wing area distribution is described with the help of the pitching axis. The wing area above and below this axis can be determined by ˆ from the the chord-length-normalized distance d(r) pitching axis to the leading edge (LE), which might be different along the span. A hypotheses of linear change of dˆ is made to limit the number of variables, as in,
(Whitney & Wood 2010). Since it is not clear how much torque the insect can add around the pitching axis, the pitching motion is assumed to be fully passive. Thus, the external torque exerted on the pitching axis is equal to the summation of the aerodynamic torque and the torque exerted by the torsional spring. According to Euler’s second law of motion for rigid bodies, the external torque around the axis xc is equal to the time derivative of angular momentum in the same direction,
ˆ = 1 (dˆtip − dˆroot )r + dˆroot , d(r) R
τxaero + τxhinge = c c
(4)
where dˆtip and dˆroot are two shape parameters that will be studied in the optimization.
R
zc
Lea
r
k
gE
dg
e
Pitching axis
Centroid
rˆ1 R alin Tre
gE
dg
e
c Figure 3: Illustration of the rigid wing model with detailed shape parameters.
The mass distribution which is related to the wing shape is also significant for the flapping flight, since the moment of inertia I is directly determined by the mass distribution and plays an important role in the passive pitching motion. For insect wings, the wing mass distribution is heterogeneous due to the nonuniform venation distribution. However, we still lack knowledge on the distribution of the wing mass for an arbitrary wing shape. Therefore, a uniformly distributed wing mass is assumed. The corresponding moment of inertia matrix in the co-rotating CS is assembled as " # Ixc xc 0 Ixc zc 0 Ixc xc + Izc zc 0 , I= (5) Ixc zc 0 Izc zc R where Ixc zc is the cross-term, given by − M xc zc dm. If the wing rotates around its symmetric axis, Ixc zc will be zero. 3
PASSIVE PITCHING MOTION
It is widely accepted that insects can control the wing rotation by exerting rotational moments given the fact that they have powerful musculature for flight control (Dudley 2002). Nevertheless, aerodynamic analysis has shown the possibility and capability to achieve the passive pitching motion with combined contributions of the aerodynamic loads and the wing inertia
(6)
where Lxc is the xc component of the angular momentum L of the wing expressed in the co-rotating CS. L can be obtained by, L = I · ωc.
din
dˆ c
xc
dLxc , dt
(7)
Substituting Eqs. 3, 5 and 7 into Eq. 6, the ordinary differential equation for passive pitching can be derived as, � + Ixc xc 12 cos2 θφ˙ 2 sin(2η) Ixc xc η¨ = − kη η + τxaero c � − 12 θ˙2 sin(2η) + 2 cos(θ)φθ˙ cos2 η + sin θφ¨ � + Ixc zc θ¨ sin η + 12 sin(2θ)φ˙ 2 sin η � − cos θφ¨ cos η + 2 sin θφ˙ θ˙ cos η ,
(8)
where kη denotes the rotational stiffness of the torsional spring as shown in Figure 3. The resultant aerodynamic torque τxaero is determined with a quasic steady aerodynamic model which has been widely used to estimate the aerodynamic forces. The loads generated by the flapping motion are decomposed into components resulting from four different sources: wing translation, wing rotation, coupling between the wing translation and rotation as well as the acceleration of the wing which leads to the added mass effect, as shown in Figure 4. Previous quasi-steady models (Sane and Dickinson 2002, Andersen et al. 2005) estimated the wing translational forces with empirical data from experimental measurements on specific insect-wing-like mechanical wings, which restricts its application on wing shape optimization. In this paper, we use the analytical model proposed by (Taha, Hajj, & Beran 2014) to calculate the wing translational effect, by which the force generated by wings with different wing shape can be calculated. Besides, the effect of the coupling between the wing translation and rotation on τxaero is included. This gives a better prec diction of passive pitching motion compared to the model without this coupling term Whitney & Wood (2010). Due to the variation in the velocity and acceleration along the wing span, the blade-element method
pitching axis
x
center of pressure
x
(angular) acceleration
vzc
x
v
c
(angular) velocity c
a
v
a
x
x
c
c
Wing flapping
c
Translation
Rotation
Coupling
Added mass effect
Figure 4: Decomposition of flapping motion. Resultant aerodynamic loads are the summation of loads resulting from these four components
4
OPTIMIZATION AND ANALYSIS
leled to the boundary of the feasible domain, which leads to fairly small gradients in the area close to the global optimum. The numerical noise and small gradient make the searching for the global solution of this optimization problem very hard purely with a gradient-based optimization algorithm. Consequently, a global optimization method is used first to search for a rough global solution, and then a gradient-based optimization method is used to obtain the precise optimum.
4.1 Optimization model
Lift [N]
It can be seen from Eq.8 that the position of the wing pitching axis influences the passive pitching motion via terms of the inertial torque and aerodynamic torque. This implies that there is an internal relationship for the wing shape and the power consumption of the hovering flight with passive pitching. Therefore, the optimal pitching axis corresponding to the least power consumption could partly explain why the Hawk moth wing looks the way it does. For this optimization problem, most quantities are prescribed except for dˆroot , dˆtip and kη . They are set as design variables. The objective is to minimize the power consumption, which is classified into two cases according to the capability of energy storage. The wing kinetic energy accumulated in the accelerating phase can be used to compensate the energy required for overcoming the drag in the decelerating phase. If the kinetic energy is more than the energy consumed by the drag, the extra energy might be either recycled into the insect thorax or dissipated. Since the energy recycling efficiency of insects is not clear, two extreme cases Pmin and Pmax are considered, which corresponds to the extra kinetic energy being fully recycled and completely dissipated, respectively. The objective function value is related to the passive pitching motion that is simulated by solving the ODE in Eq. 8. The numerical noise resulting from the ODE solving process, as shown in Figure 5, is hard to eliminate due to the high flapping frequency, which leads to the existence of either truncation error or round-off error. A response surface analysis is carried out by fixing one of the three design variables, as shown in Figure 6. Results show that the contour line corresponding to the minimal power is nearly paral-
−3
11
x 10
60
10
55
9
50
8
45
7
4.5
5
5.5
6 6.5 kη [Nm/Rad]
7
Pmax [Nm/Rad]
(Osborne 1951), which discretizes the wing into infinitesimal chord-wise strips, is used together with the quasi-steady model. The aerodynamic forces and moments in the co-rotating CS can be calculated by integrating the loads on each of the strips over the entire wing. The average loads and power can be obtained by averaging the transient forces over a stroke cycle.
40 8
7.5
−5
x 10
Figure 5: Numerical noise from solving the pitching motion
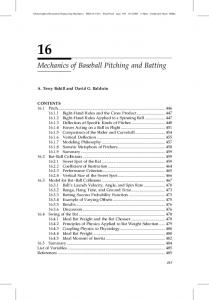
4.2 Results and analysis Optimization results for both the power consumption patterns Pmin and Pmax are listed in Table 4.2. It can be found that different optimal pitching axis positions are obtained for the two patterns. Compared to case Pmin , more wing area is put in front of the pitching axis for case Pmax , which tends to decrease the moment of inertia terms Ixc xc and Ixc zc and, thus, decrease the extra kinetic energy dissipated. If the extra kinetic energy of wings can be recycled, nearly 10% energy can be saved. The wing with a straight LE as the pitching axis is also listed for comparison to the optimal curved LE wing design. A wing with a straight leading edge as its pitching axis requires a stiffer torsional spring to reach the optimal flapping motion and has a 35% higher energy requirement for both cases. Figure 7 compares the optimal wing shapes with the real Hawk moth wing from the paper of Ellington
7
8
9
60
−3
100
−3
x 10
x 10
Pmax [W/Kg]
10 Lift [N]
80
(b)
8 6 0.5 0.4 dˆtip
4
200 100 0 0.5
0.4
6
0.4 dˆtip
0.3 dˆroot
0.3 0.2
8
10
50
(c)
0.4 0.3 0.2
0.3 dˆroot
100 150 200 250
(d) −3
x 10
Pmax [W/Kg]
Lift [N]
0.02 0.01 0 0 0.2 dˆroot0.4
1
kη
2
3 −4 x 10
400 200 0 0 0.2 dˆroot0.4
1
kη
2
3 −4 x 10
Figure 6: Response surface analysis on lift generation and power consumption. The gray plane represents the minimal lift requirement. The black dots denote the optima. Table 1: Optimization results. Design parameters Patterns kη [Nm/Rad] dˆroot Pmax 6.00e−5 0.30 Pmax 2.65e−4 0 Pmin 8.60e−5 0.33 Pmin 2.65e−4 0
Minimum dˆtip 0.46 0 0.31 0
power 46.35 63.44 41.16 58.72
(1984). Our optimization model succeeds to predict the overall chordwise wing area distribution, which implies the passive pitching motion in hovering flight does have a great influence on the wing shape evolution. Admittedly, the real Hawk moth wing shows a ˆ smaller value of dˆroot and a nonlinear change of d(r) from the wing root to tip. If we compare the passive pitching motion of the optimal design with the measured pitching motion from Willmott & Ellington (1997a), the pitching amplitudes both for the case Pmin and Pmax are higher than measured values of both the fore wing and hind wing, as shown in Figure 8. The discrepancy of the wing shape and the pitching amplitude between the optimization results and measured values can be partly explained by the response surface analysis as shown in Figure 6. In Figure 6 (a) and (b), kη is fixed at the optimal torsional stiffness for the case Pmax , and the response surfaces of the lift generation and the power consumption with respect to the position of the pitching axis are plotted. All the points above the gray plane represent feasible designs which generate sufficient lift force for hovering. Those points distributed in the diagonal areas circled by ellipses correspond to different wing pitching axis but with quite similar performance with regard
Rotational axis Optimal wing for Pmin Optimal wing for Pmax Real Hawk moth wing
Figure 7: Comparison between optimal wing shapes with real Hawk moth wing shape
Passive pitching motion 100
50 η(t) [Deg]
6 (a)
to energy-efficiency. The same conclusion can be obtained from Figure 6 (c) and (d), which fix the dˆtip as 0.4. A variety of combinations of dˆroot and kη show similar power consumption. Therefore, if we set the value of dˆtip as 0.4 and move the values of dˆroot and kη along the boundary of the feasible domain shown in Figure 6 (c), a smaller pitching amplitude and value of dˆroot can be achieved with no more than 10 percent extra power. This gives a wing more similar to the real Hawk moth wing. Furthermore, the hovering flight is accompanied with fluctuation of lift requirement and different kinds of manoeuvers, which might require higher lift generation than the body weight. For this case, an even smaller pitching amplitude for the wing design is required, which is corresponding to an even stiffer torsional spring. This idea probably leads to a much more similar design relative to the real moth wing. It is apparent that the wing morphology and kinematics of the Hawk moth is determined by multiple factors, for instance, diverse flight patterns, the physical characteristics of the flapping mechanisms and the living circumstance. Besides, simplifications in the aerodynamics modeling and wing morphological description limit a one-to-one comparison. Consequently, we did not intend to give a perfect explanation to the Hawk moth wing shape, but to help to gradually understand the insect flight and to guide the wing design for FWMAVs.
0
η−Pmin η−Pmax
−50
ηouter−Meas. ηinner−Meas.
−100 1
1.2
1.4
1.6
1.8
2
t/T
Figure 8: Comparison between measured pitching angles and optimization results
5
CONCLUSIONS
Little work has been done to answer questions on why insect wings look the way they do and how to select
a specific wing shape for a FWMAV. To fill this gap, we chose the Hawk moth wing as an objective and attempted to partly explain the position of its pitching axis by optimizing this axis to achieve the most energy-efficient hovering flight. Results from a hybrid optimization method show a similar pitching axis as the real moth wing, which implies that hovering flight with least power consumption does have an influence on the wing shape evolution of the Hawk moth. This analysis indicates the importance of the pitching axis position in the wing design of FWMAVs. The comparison between optimal designs with the optimal pitching axis and with a straight leading edge as its pitching axis shows great difference on the energy efficiency. The former one could save more than 35% percent or more energy. Response surface analysis shows that the contour line with minimal objective value is nearly parallel with the feasible domain boundary where the optimum is located. On the one hand, this characteristics make it tough to achieve the global optimum in combination with the numerical noise. On the other hand, it shows the possibility of achieving similar performances of power consumption by wings with different kinds of pitching axes. In future, the effect of forward flights on wing shape will be studied, and a flexible wing model, which could better represent the real wing deformation, will be used instead of the rigid wing model. ACKNOWLEDGEMENTS We would like to thank the China Scholarship Council for their financial support. REFERENCES Andersen, A., U. Pesavento, & Z. J. Wang (2005, October). Unsteady aerodynamics of fluttering and tumbling plates. Journal of Fluid Mechanics 541, 65–90. Dickinson, M., F. Lehmann, & S. Sane (1999, June). Wing rotation and the aerodynamic basis of insect flight. Science 284(5422), 1954–1960. Dudley, R. (2002). The biomechanics of insect flight: form, function, evolution. Princeton University Press. Ellington, C. P. (1984, February). The Aerodynamics of Hovering Insect Flight. II. Morphological Parameters. Philosophical Transactions of the Royal Society B: Biological Sciences 305(1122), 17–40. Osborne, M. (1951). Aerodynamics of flapping flight with application to insects. Journal of Experimental Biology 28, 221– 245. Sane, S. P. & M. H. Dickinson (2002, April). The aerodynamic effects of wing rotation and a revised quasi-steady model of flapping flight. J. Exp. Biol. 205(8), 1087–1096. Taha, H. E., M. R. Hajj, & P. S. Beran (2014, April). Statespace representation of the unsteady aerodynamics of flapping flight. Aerospace Science and Technology 34, 1–11. Whitney, J. P. & R. J. Wood (2010, July). Aeromechanics of passive rotation in flapping flight. Journal of Fluid Mechanics 660, 197–220. Willmott, A. & C. Ellington (1997a, November). The mechanics of flight in the hawkmoth Manduca sexta. I. Kinematics
of hovering and forward flight. J. Exp. Biol. 200(21), 2705– 2722. Willmott, A. & C. Ellington (1997b, November). The mechanics of flight in the hawkmoth Manduca sexta. II. Aerodynamic consequences of kinematic and morphological variation. Journal of Experimental Biology 200(21), 2723–2745.