Optimal Pricing Policies of Web-Enabled Application Services
Hsing Kenneth Cheng∗ and Gary J. Koehler Decision and Information Sciences Warrington College of Business Administration University of Florida PO Box 117169, Stuzin 351 Gainesville, FL 32611
First Revision: January 8, 2001 Second Revision: August 22, 2001 This Version: January 31, 2002
∗
Corresponding author. Phone: (352)392-7068; Fax: (352)392-5438; e-mail:
[email protected] Authors are in alphabetical order.
Optimal Pricing Policies of Web-Enabled Application Services
ABSTRACT Ubiquitous and inexpensive access over the World Wide Web has fueled the growth of Application Service Providers (ASPs). ASPs are “service firms that provide a contractual service offering to deploy, host, manage, and lease what is typically packaged application software from a centrally managed facility.” The application software products offered by ASPs range from standard productivity tools to expensive applications such as Enterprise Resource Planning systems like SAP or PeopleSoft. In this paper, we model the economic dynamics between the ASP and its potential customers. Under a realistic economies-of-scale assumption, we show that there exists a unique rational expectation equilibrium. Optimal pricing policies for the ASP are derived analytically and insights are demonstrated through numerical explorations. Keywords: Application Service Providers (ASPs), Web Hosting, Pricing Policy, Economics of Electronic Commerce
Optimal Pricing Policies of Web-Enabled Application Services 1. Introduction Several coalescing forces have once again made an old software pricing model attractive [5]. In the 1960’s and 1970’s, small to medium-sized companies gained access to expensive computing resources and software through time-share services and service bureaus.
Today, similar dynamics are driving companies to similar services for
expensive applications such as Enterprise Resource Planning systems like SAP or PeopleSoft. These new service providers charge on a pay-per-use basis, a flat- fee basis, or some mixture thereof. It is estimated that application outsourcing will be a $21 billion industry by 2,001 [14] and a euro 1.8 billion industry by 2,003 [21]. Ubiquitous and inexpensive access over the World Wide Web has fueled the growth of software rental on either a pay-per-use basis or a subscription basis. This strategy is reinforced by the emergence of thin-client computers. Thin-client computers, in the form of network computers, Web TV’s or the like, are designed with minimal resources, and operate by downloading applications on an as- needed basis. These applications usually run on the service provider’s system with a front-end running on the thin client machine. Figure 1 shows the Application Service Provider (ASP 1 ) architecture presented on TRB Solution’s web pages. Today, such service providers are advertised under titles such as “Computer Utility Companies” or “Application Service Providers (ASPs).”
International Data
Corporation defines an ASP as “service firms that provide a contractual service offering to deploy, host, manage, and lease what is typically packaged application software from a
1
centrally managed facility” [21]. A good source for current developments can be found at http://www.aspnews.com/.
Figure 1: ASP Architecture given by TRB Solutions (http://trbsolutions.com/) 2
Some ASPs offer industry-specific software on a pay-as-you-go basis (such as Utiligent’s offering to the utilities industry [10]).
One provider offers a one-stop
shopping alternative for a variety of software products [14], even inviting software 1
This should not be confused with the acronym for Active Server Pages.
2
Permission granted by TRB Solutions, Inc., Teaneck, NJ 07666
2
providers
to
partner
with
them
(see
Interliant
AppsOnline
at
http://www.appsonline.com/index.html). Mainline software companies, such as Lotus Development, are actively exploring software rental options for their products [11]. And, as in the early days of time sharing, even expensive software is being offered; EDS’s Systemshouse (http://www.shl.com/) offers ERP software. Early in 1999, Electronic Data Systems announced it would provide SAP’s R/3 to small and midsized companies over networks with a service called Keysource. They plan on charging from $425 to $660 on a per-user, per-month basis. Other high-end ASPs include Usinternetworking, IBM Global Services. USWeb, Oracle Online, Corio, ServiceNet and World Technology Service [21]. The advantages of this business model stem from several sources. First, small to medium-sized companies can gain access to systems not otherwise available. Second, companies can avoid high initial capital expenditures on expensive thick-client hardware, on software licenses and on installation costs. IDC estimates a 10-50% savings here [10]. Normal maintenance is easier since up grades can be automated. Another advantage, which is found in all types of outsourcing, is that management can focus on missioncritical concerns and not be distracted with IT infrastructure problems. ASPs use a variety of charging algorithms for their services. Some charge a yearly fee for each workstation. Others charge a per-user, per- month fee. Both of these schemes are tantamount to a fixed fee. Some ASPs see an ebb and flow of software needs and charge a subscription fee covering a time period plus a pay-as-you- go fee (charged on a use basis or a time- metered basis). It is this latter case that we study in this paper. In economics, such pricing schemes are known as uniform two-part tariffs (see Oi
3
[19]). We start our analyses with two-part tariff since it is a more general pricing scheme including fixed price and metered charge as its special cases. ASPs face a more complex environment than that typically found in two-part tariff studies because of congestion created by processing its customers’ computing needs.
For example, Oi [19] took as his prototypical setting an amusement park
(Disneyland in particular) that charges an entrance fee (the fixed costs) and a per-ride fee (Disney no longer uses a two-part tariff). Anyone who has visited one of Disney’s theme parks knows that long lines precede the more popular rides. Oi [19] did not consider such congestion and possible non-service. ASPs, however, must provide sufficient resources to assure a minimal level of service. The effect of price on the management and control of congestible resources has been an active research area. Naor [18] studied how to regulate queue sizes by levying tolls on M/M/1 queues with balking (arriving customers need not join the queue). Edelson and Hildebrand [3] ext ended this model to include a two-part tariff. Dolan [1] was among the first to embed queueing models in a microeconomic framework to study the role of congestion cost. However, it was Mendelson [15]’s presentation and analysis of similar problems in continuous time that became most widely recognized. Mendelson [15] found that the net value maximizing price equals the expected delay cost inflicted on the rest of the system not perceived by the generating user, a cost termed the “externality” cost. Mendelson and Whang [16] extended Mendelson [15]’s work to consider M/M/1 queueing system with multiple user classes. Mendelson and Whang [16] derived a decentralized pricing mechanism that is optimal and incentive compatible. This means
4
that each user makes an individual decision on whether to join the system at what priority level that will maximize the objective of the system as a whole. Recently, similar methodology is applied to research problems related to the Internet. For example, Mackie-Mason and Varian [13] studied the effect of congestion pricing on the efficient usage of Internet services. Delay is defined as total use divided by capacity.
Congestion pricing “internalizes” the externality resulting from the
incremental usage of a shared resource degrading the quality to all. They found that competitive pricing will maximize net social benefits. Gupta, Stahl, and Whinston [7, 8] studied many pricing issues for Internet services invloving the quality of service (QoS) dimension.
In particular, the y study dynamic pricing models based on levels of
congestion and contrast their results with fixed charge and time-based pricing mechanisms. They also note that these congestion externalities can be priced by a twopart tariff where the fixed charge meets goals of cost recovery and the congestion charges handle resource allocation. Congestion is handled based on changing prices as perceived or predicted demand varies in different QoS classes. All the aforementioned models in the literature, with the exception of Gupta, Stahl, and Whinston [7, 8], invariably deal with the setting of a single server, which renders them inadequate in analyzing the problem facing an ASP. The ASP is required by its customers to provide complete protection of various system resources. To meet this requirement, the ASP either partitions the mainframe server into several “virtual machines” (see Silberschatz, et. al [20]) or uses several different servers. Each virtual machine is completely isolated from all other virtual machines with no direct sharing of system resources. Alternatively, the ASP can acquire several UNIX servers, each of
5
which is dedicated to an individual customer.
Unlike the congestion created by
competing for the same single server studied in prior literature, the customers signed up for ASP services compete for the access to a virtual machine (or server) from a pool of virtual machines (or servers).
The objective of our research is to examine the
interrelationship between price and queueing delay in this dis tinct setting involving multiple servers with finite calling population. We consider a two-part pricing scheme to model the ASP problem, but depart from the models discussed above as follows. First, unlike Naor, we do not consider balking. Instead, the ASP reimburses customers for time spent waiting for services. We also require a minimal average performance guarantee. We look at the ASP problem from several perspectives. We define the Short-Run Problem as the period during which the ASP cannot alter the service guarantee or the capacity. Over longer periods, the ASP can increase server capacity and then provide better service and performance guarantees. We call this problem the Service Provider’s Problem (SPP). The most important finding of our research is that the ASP has wide latitude in setting the optimal pricing policy. Specifically, the optimal pricing policy need not be in the form of a fixed fee, metered price, two-part tariff, or two-part tariff plus reimbursement.
Any family of pricing
schemes is optimal as long as the pricing policy satisfies a relationship we identify in Section 3. In Section 2 we present the Service Provider’s Problem (SPP). The problem is studied in Section 3 through a sequence of models, starting with the Short-Run Problem. We determine a family of optimal pricing policies depending on the type of pricing structure desired by the ASP. These range from pure policies having only fixed or
6
variable costs, to policies having fixed, variable and reimbursement cost compone nts. In Section 3 we show that the short-run problem has a unique solution when the probability distribution of customers’ reservation prices satisfies a broad condition. In Section 4 we perform numerical explorations to gain insights into the properties of optimal SPP solutions. We conclude with a discussion in Section 5.
2. Model Assume N potential customers need to run a software product during a specified time period T, set at one year in this paper (notation is summarized in Table 1). This requirement can be met in either one of two ways. In the first, a user may implement the product at an annualized “ownership” cost of OC (which includes software costs, maintenance costs, operating costs, costs of possibly upgrading to bigger computers, etc.) and run it on their own computer. In the second way, a user may subscribe to an ASP service with an annual fixed fee of F and pay p per unit of time usage. We assume that the service provider will offer a reimbursement to customers using its service, y, for time spent waiting for access to a server. The ASP option may allow the user to have a less expensive computer and to incur lower operating and support costs.
On average, a
minimal number of required usages of d ( ≥ 0) will be needed during this time period and, thus, a service provider must offer this performance guarantee.
>
We assume that the need to use the software can be modeled as an exponential distribution with between- usage rate, λ , and that the required usage time can be modeled 7
as an exponential distribution with rate µ . Then
(λ
T −1
+µ
−1
)
is the expected number of
times each individual customer uses the software in time T. We require
(λ
T −1
+µ
−1
)
≥d
to assure that customers achieve a minimal average usage. The application service provider must decide on the price structure of the service (F, p, and y) and on the number of servers, s, it will provide (we require λ < s µ ). The cost of the servers (plus a version of the software product that will run in this configuration) is c ( s ) . We assume customers have a per time-unit reservation price, R, which is the valuation they place on using the software. This price is modeled as a random variable with continuous probability density function f (r ) > 0 and ℜ(r ) its distribution. Depending on the price structure, implied waiting times, and customer reservation price of the service, customers must choose between subscribing to the ASP service or purchasing and using the software directly.
Let M ( ≤ N) be the actual number of
customers choosing to use the ASP service. From basic queueing theory (see Section 2.7 of Gross and Harris [6] for example) we have the following. The ASP service system with M paying customers and s servers is an M/M/s queue with a finite calling population of size M. The arrival and service rates for such a system are n µ for0 ≤ n ≤ s λn = ( M − n) λ for0 ≤ n ≤ M , and µ n = , s µ for n ≥ s where n denotes the number of customers in the system (both in service and in the queue). 8
The expected queue length of customers waiting for service is M
Lq = ∑ ( n − s ) Pn n= s
and the expected number of customers waiting or being serviced is M
L = ∑ nPn n= 0
where P0 =
1 n
n
M M λ λ M! ∑ n µ + ∑ M − n ! s ! s n− s µ ) n =0 n= s ( s −1
and n M λ n µ Pn = P0 n λ M! ( M − n ) ! s ! s n− s µ
0≤ n≤ s
s≤n≤M
Knowing these values, Little’s formulas [12] give us the expected waiting time in the queue excluding the service time Wq =
Lq
λ ( M − L)
and with the service time
W=
L . λ ( M − L)
9
2.1 The Customer Problem The undiscounted expected net value to a customer over time period T who buys the software and has reservation price R is
(λ
Τ −1
+µ
−1
)
R − OC . µ
The first term gives the expected number of usages over time period T and, the second term, the expected value per usage of the software. From this the software’s ownership cost is subtracted. Alternatively, a customer using the ASP service has an expected total value of T R−p + yWq − F . ( λ +W ) µ −1
The first term is the expected number of software usages which takes into account the expected waiting times until a server becomes free. The second term gives the value of using the software, net of the metered costs of use and any waiting time reimbursement allowances. The last term, F, is the fixed fee of subscribing to the service. The expected number of customers who will choose the service is then T R− p Τ R M = N ⋅ Prob −1 + yW − F ≥ − OC q −1 −1 ( λ + W ) µ µ λ + µ ( )
where x is the largest integer less than or equal to x. The above equation means that the number of actual subscribers equals the proportion of potential customers who find the net value of using the ASP service greater than the net value of implementing the software by themselves.
10
2.2 The Service Provider’s Problem The service provider must determine the price structure (F, p, and y) and the number of servers. The provider’s revenue is given by
T p ω ( F , p , y | s ) = M ⋅ F + − 1 − yW µ q λ + W ( ) since M subscribers pay the fixed subscription fee, F, plus their net payment for all of their uses. Assumption 1. (Economies-of-Scale Assumption) We assume that economies of scale will produce a nominal cost for service (the fixed fee plus a total expected usage cost) being less than the annualized software ownership cost facing a potential subscriber. That is, F+
T p < OC . −1 λ +µ µ −1
This assumption is supported in the trade press. For example, it is observed that “ASPs share cost among many customers, allowing for a much lower cost structure than traditional solutions” [2]. Savings are estimated at 30% to 70% by FutureLink (at www.futurelink.com). A profit- maximizing service provider will solve the Service Provider Problem (SPP) as follows: (SPP) maxmax ω ( F , p , y | s ) − c ( s ) s
(1)
F ,p ,y
s.t. T R− p Τ R (2) M = N ⋅ Prob −1 + yW − F ≥ − OC q −1 −1 ( λ + W ) µ µ λ + µ ( ) 11
(λ
T −1
+W)
≥d
(3)
F , p, y ≥ 0
s, M ∈ Z + λ s≥ µ
(4)
where Z+ is the set of non-negative integers and x is the smallest integer greater than or equal to x. Equation (1) gives the net profit equal to the revenue less the cost of providing s servers. Equation (2) reflects the solution to the customer problem. Equation (3), the performance guarantee, assures that the ASP provides a minimal level of service. When inequalities (3) and (4) imply a negative profit solution, the service provider will choose not to offer the service.
3. Analysis Our first insight is that Equation (2) can be simplified.
Lemma 1: At an optimal solution
T R− p Τ R . M = N ⋅ Prob −1 + yW − F ≥ − OC q −1 −1 ( λ + W ) µ µ λ + µ ( ) Proof: Please see the Appendix. The next result tightens the problem statement.
12
Lemma 2: A non-trivial optimal solution to SPP (i.e. N ≥ s > 0 ) satisfies M ≥ s . Proof: Please see the Appendix. Because of Lemma 2, we restric t M ≥ s in all formulations. We now examine the Service Provider’s problem in a three-step process – each successively more involved. In the first case we relax the performance guarantee and fix the number of servers. We call this the short-run problem since server capacity is fixed over short periods of time. The performance guarantee is introduced in the second step. Finally, using the first two steps, we examine the entire Service Provider problem SPP.
3.1 Short-Run Problem (No Performance Guarantee) With the number of servers fixed and the performance guarantee relaxed, SPP reduces to
T p (Short-Run SPP) max ω ( F , p , y | s ) = M ⋅ F + −1 − yWq (5) F , p ,y (λ + W ) µ s.t.
T R− p Τ R M = N ⋅ Pr ob −1 + yW − F ≥ − OC q −1 −1 ( λ + W ) µ µ λ + µ ( )
(6)
F , p, y ≥ 0
M ∈Z+, M ≥ s
(7)
After algebraic manipulation, (6) can be rewritten as
13
T p OC − F − −1 − yWq λ +W µ , M = N ⋅ Prob R ≤ T T − −1 −1 −1 (λ + µ ) µ (λ + W ) µ
(8)
where R is the random variable describing potential customers’ valuation (reservation price) of using the software. Equation (8) implies that no one will subscribe to the ASP service if the expected savings of annualized software cost (the first term in the numerator) is less than the expected cost of subscribing to the ASP service (the remaining terms in the numerator). M appears on both sides of Equation (8) – explicitly on the left and implicitly (in W and Wq ) on the right. We follow the mechanism described in Katz and Shapiro [9] where a dynamic market process yields equilibrium via rational expectations as potential customers form priors on M.
This equilibrium is uniquely determined under the
economies-of-scale assumption as shown below.
Theorem 1: (Unique Rational Expectation Equilibrium) Under the economies-of-scale assumption, there exists a unique rational expectation equilibrium in Equation (8) for any distribution function ℜ
b g on
[ 0, ∞ ) . Proof: Please see the Appendix
To find the optimal solution to the Short-Run SPP, we define a ( F , p , y , M ) and
b ( M ) as follows:
14
a ( F , p , y , M ) = OC − F −
T p − yWq , λ +W µ −1
and b(M ) =
(λ
T −1
+µ
−1
−
) µ (λ
T
−1
+W ) µ
.
Under Theorem 1, Equation (8) can be rewritten as a ( F, p, y , M ) M = Nℜ , b (M )
b g is the distribution function of random variable R as defined earlier. Under our assumptions on ℜb g , its inverse is well defined and where ℜ
−1 M a ( F , p , y , M ) = b( M )ℜ N
.
Thus, the Short-Run SPP can be converted to a unconstrained optimization problem as follows:
max V ( M )
(9)
s≤ M ≤ N
where M V ( M ) ≡ M ⋅ OC −b( M ) ℜ−1 . N
(10)
The optimal Short-Run ASP profit is found by evaluating V(M) for all possible M’s ranging from s to N. Suppose M * solves (9) and that V * ( M * ) is the maximal short-run ASP profit. Then * V*(M*) p T * * −1 M OC − F − −1 − yWq = b ( M ) ℜ = OC − λ +W * µ M* N
15
so F+
V * ( M *) T p * − yW = q λ −1 + W * µ M*
(11)
with F , p , y ≥ 0 . This equation gives a family of pricing schemes that are enumerated in Table 2.
>
Equations (9) to (11) provide several useful managerial insights for the ASP. To find an optimal pricing policy, the ASP first calculates V(M) according to Equations (9) and (10) by varying M (from s to N). After V * ( M * ) is found, the values of Wq* and W * become known. Then, the ASP has wide latitude of setting optimal pricing policies by applying Equation (11). Specifically, the optimal pricing policy need not be in the form of a fixed fee, metered price, two-part tariff, or two-part tariff plus reimbursement. Any family of pricing schemes is optimal as long as the pricing policy ( F , p, y) satisfies Equation (11), see Table 2. When a pricing policy satisfying Equation (11) is instituted by the ASP, it will in turn induce an optimal number ( M * ) of customers to subscribe to the ASP service because of Equation (8).
3.2 Short-Run Problem (With Performance Guarantee) When the performance guarantee
(λ
T −1
+W)
≥d
16
is non-binding, the model is the same as the Short-Run SPP model. If, however, it is binding, it follows that T − d (λ −1 + µ −1 ) Wq ( M ) ≤ , d which in turn implies that M is bounded. Let M be the smaller of this bound and N. Hence, the short-run problem with a performance guarantee is transformed into:
max V ( M )
s≤ M ≤ M
The solution procedure described in the previous section and optimal policies in Table 2 still apply.
3.3 Long-Run Problem Using the above results, the long-run problem, problem SPP, can now be restated as an enumerative problem (SPP)
max V * ( s ) − c( s)
λ µ ≤s ≤ N
where c ( s ) is the cost of the s servers and
V * ( s) = max V (M ) . s ≤M ≤M
Finding the optimal solution to the long-run problem involves a straightforward enumeration on the number of server s from λ to N. For each s, the corresponding µ V * (s ) is found by using the procedure described in Section 3.1. The ASP will choose the capacity
s* that achieves the maximized V * (s ) .
17
Once
s* (and hence, M * ) is
determined, Table 2 can be used to set prices. In the next section we examine some issues which simplify the solution of SPP.
3.4 Properties of SPP Some distributions simplify the computational processes further. For example, the following result shows that the objective function in Short-Run SPP is unimodal.
Theorem 2: (Unimodal Objective Function for General Distributions of Reservation Price) For any general distributions of customers’ reservation price R with the property
f (r ) > 0 , the objective function of Short-Run SPP is unimodal. Proof: Please see Appendix. In the next section, uniform distributions are used for the numerical explorations of SPP and to illustrate the properties of Theorem 2. It is noted, however, Theorem 2 applies to all general distributions of reservation price.
4. Numerical Explorations of SPP We conducted several numerical experiments to gain further insight into the Service Provider Problem (SPP). We first examine the short-run SPP where the service provider’s capacity is fixed, then turn our attention to cases where the capacity is allowed to change. In both the short-run and long-run problems, we study the effect of number of subscribers on an application service provider’s (ASP’s) profit, and the effect of market potential on an ASP’s optimal profit and the optimal number of subscribers. 18
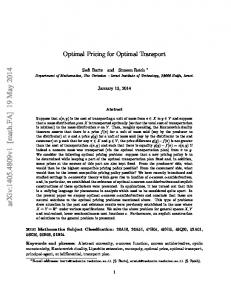
In these numerical experiments, we set the contract period T at 365 days (one year). We arbitrarily picked a Fortune 1000 company with $1.8 billion revenue with a 3.55% contribution margin due to information technology. This translates to a value of $175,000 per day attributable to computing. Hence, we assume that the random variable R denoting the customer’s reservation price of computing has a uniform distribution over [$150,000,$200,000] per day where the mean is $175,000/day. We use $11,000 per day for the annualized software ownership cost, OC, based on typical trade press statistics of $20 million to implement an ERP system over a five-year period. We use a linear function for the server cost, c ( s ) = c ⋅ s , where c is $5,000 per day to reflect the annual mainframe cost ranging from 1.25 to 3 million reported in [4]. The average interarrival time of invidual customer’s requests for ASP services equals 2 hours (λ = 12 /day), while each request requires on average 0.5 hours processing time (µ = 48/day). The arrival rate λ of each customer’s requests for services is subsequently increased sixteen- fold to explore the impact of heavy traffic. Figures 1 through 5 analyze various scenarios of the short-run problem where the number of servers is fixed at 10. The unit of profit in all figures is in $1,000 per contract period. Figure 1 shows the effect of number of subscribers on the ASP profit in the short run where there are 500 potential customers. As predicted in Theorem 2, the ASP profit function is unimodal. The maximum profit is achieved when there are 47 subscribers, giving M* = 47 in Equation (9) of Section 3.1. This M* is in turn plugged into Equation (11) to prescribe a family of optimal pricing policies. The ASP has a wide range of optimal pricing policies as long as (F* , p* , y* ) satisfies the relationship described by Equation (11).
19
ASP Profit
160000.00 140000.00 120000.00 100000.00 80000.00 60000.00 40000.00 20000.00 0.00 10 15 20 25 30 35 40 45 50 55 60 65 70 Number of Subscribers
Figure 1. The effect of number of subscribers on ASP profit (Short -Run, N = 500)
Optimal ASP Profit
143000 142000 141000 140000 139000 138000 137000 136000 135000 134000 133000 50
100
150
200
250
300
350
400
450
500
Market Potential
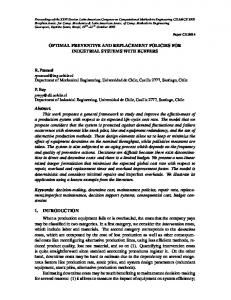
Figure 2. Optimal ASP profit as a function of market potential
For the same set of parameters, the effect of market potential on the short-run optimal profit is shown in Figure 2. Figure 3 plots the optimal number of subscribers as a functio n of market potential. Two observations from Figures 2 and 3 are noteworthy.
20
Optimal Number of Subscribers
48
47
46
45
44 50
100
150
200
250
300
350
400
450
500
Market Potential
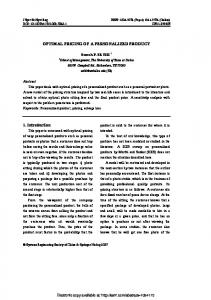
Figure 3. Optimal number of subscribers as a function of market potential
Firstly, Figure 2 shows a “diminishing” increase of optimal ASP profit as the market potential increases. All things equal, this shows that bigger markets are better. However, the cost of growing market awareness, not considered in our model, suggests that when the server capacity is fixed, it might be better for an ASP’s to focus on a small set of potential customers with high valuation of its services than to cover the whole market. Secondly, Figure 3 further suggests that the optimal number of subscribers remains the same when market potential exceeds 150. The optimal ASP profit, however, will be different for different market potentials although the optimal number of subscribers remains the same above 150. For the same number of service subscribers M, different profits will be realized for different market potentials, N.
This becomes evident in
Equation (10) as the profit function V(M) will change with N through the ℜ−1 ( M / N ) term.
21
Optimal ASP Profit
20000.00 18000.00 16000.00 14000.00 12000.00 10000.00 8000.00 6000.00 4000.00 2000.00 0.00 50
100
150
200
250
300
350
400
450
500
Market Potential
Optimal Number of Subscribers
Figure 4. Optimal ASP profit as a function of market potential (Heavy Traffic) 12 10 8 6 4 2 0 50
100
150
200
250
300
350
400
450
500
Market Potential
Figure 5. Optimal number of subscribers as a function of market potential (Heavy Traffic)
Figures 4 and 5 plot the optimal short-run ASP profit and optimal number of subscribers as a function of the market potential, when the arrival rate of individual customer’s requests is increased sixteen- fold from 12/day to 192/day. (The inter-arrival time is shortened from 2 hours to 7.5 minutes.) In the case of heavy arrival of customers’ requests, both the optimal short-run ASP profit and optimal number of subscribers are reduced significantly compared with the light-traffic case reported in Figures 2 and 3.
22
Facing increased requests arrivals, the ASP will be able to serve fewer customers in the short run as its capacity is fixed. The next set of numerical experiments examines the ASP’s long-run problem where the service capacity has to be jointly determined with its pricing policy to maximize the profit. In Figures 6 through 9, we plot the optimal ASP profit and optimal number of subscribers as a function of the ASP’s capacity. The same parameters used in Figures 1 through 3 are used in Figures 6 through 9, except by varying the ASP capacity and market potential. In Figures 6 and 7, we look at results for a small market with 50 potential customers. Results for a large market with 500 potential customers follow in Figures 8 and 9. Heavy traffic cases in the long-run problem are not reported as they exhibit similar patterns to those in the large- market case in Figures 8 and 9. 180000
Optimal ASP Profit
160000 140000 120000 100000 80000 60000 40000 20000 0 5
6
7
8
9 10 11 12 13 14 15 16 17 18 19 20 No. of Servers
Figure 6. Optimal ASP profit versus capacity (small market)
23
Optimal Number of Subscribers
60 50 40 30 20 10 0 5
6
7
8
9
10 11 12 13 14 15 16 17 18 19 20 No. of Servers
Figure 7. Optimal number of subscribers versus capacity (small market) Figure 6 is derived by evaluating the optimal ASP profit for the varying capacities. From Figure 6, the ASP realizes the optimal long-run profit when the number of servers equals 14. The optimal profit starts declining after the capacity exceeds 14, since the increase in revenues cannot compensate for the increase in capacity cost. This observation is corroborated by Figure 7, as the optimal number of subscribers remains the same after the capacity exceeds 11. For a large market with 500 potential customers, both the optimal ASP profit and optimal number of subscribers increase with the increasing capacity in a fashion similar to linear, as shown in Figures 8 and 9.
Optimal ASP Profits
350000 300000 250000 200000 150000 100000 50000 0 5
6
7
8
9 10 11 12 13 14 15 16 17 18 19 20 No. of Servers
Figure 8. Optimal ASP profit versus capacity (large market)
24
Optimal Number of Subscribers
120 100 80 60 40 20 0 5
6
7
8
9
10 11 12 13 14 15 16 17 18 19 20 No. of Servers
Figure 9. Optimal number of subscribers versus capacity (large market)
5. Conclusions In this paper, we modeled the economic dynamics between a monopolistic ASP and its potential customers. Under a realistic economies of scale assumption, we showed that there exists a unique rational expectation equilibrium. Optimal pricing policies for the ASP were derived and insights were garnered from numerical explorations. In particular, we modeled the ASP’s service provider problem (SPP) and the solved it by examining a sequence of progressively more complete problems starting with the short-run SPP problem where service capacity and guaranteed minimal performance is unchangeable and ignored. From this, we determine a family of optimal policies, the form of which depends on the type of charging structure the ASP chooses. These ranges from pure policies incorporating only a fixed or variable cost component to policies employing fixed, variable and reimbursement price components. Table 2 summarizes these policies.
25
We conducted a number of numerical studies to gain insights into properties of optimal SPP solutions. If these generalize, we have the following properties. It appears that with a linear cost function and uniform reservation price distribution the optimal ASP profit is increasing at a diminishing rate.
The optimal number of subscribers
reaches a limit as market potential increases, probably due to the performance guarantee. As expected, as the frequency of usage increases, the number of customers that can be handled decreases and, thus, the ASP profit. Studies performed on the full ASP problem suggests there is an optimal server capacity where profits start to decline as the increased revenues fail to cover increased server costs. The optimal number of subscribers reaches a peak (before the optimal capacity).
ASP profit and optimal subscriber level increase as the market potential
increases. Future research could proceed in a number of directions. One could try to generalize the empirical properties observed in Section 4. Special conditions on the pdf of customers’ valuation of using the ASP service f ( r ) or the cost function of ASP’s servers c ( s ) may be required to achieve these goals. Another avenue of research might make the market potential, N, a function of advertising and include customers’ waiting time for service in their valuation of computing. Finally, it is of interest extending this paper’s setting to study the price and capacity competition between multiple ASPs.
26
Acknowledgment: The authors gratefully acknowledge comments and suggestions of Professor Ira Horowitz, seminar participants of the1999 Indiana University/University of Florida Joint Workshop on e-Business, the 1999 Workshop on Information Systems and Economics (WISE), The Institute of Economics of Academia Sinica (Taiwan), National Sun Yat-Sen University (Taiwan), University of South Florida, and IBM’s T. J. Watson Research Center.
Bibliography [1] R. J. Dolan, Incentive Mechanisms for Priority Queueing Problems, Bell Journal of Economics 9, No. 2 (1978) 421-436. [2] M. F. Eastley, Ground Rules for Selecting an Application Service Provider, CMPnet (March 24, 1999). [3] N. M. Edelson and D. K. Hildebrand, Congestion Tolls for Poisson Queuing Processes, Econometrica 43, No. 1 (1975) 81-92. [4] E. Freeman, Mainframes in the 21st Century, Datamation (Jan. 1999). [5] J. Gantz, A Brand New Practice Called … Time-sharing?, Computerworld (July 20, 1998) 27. [6] D. Gross and C. M. Harris, Queueing Theory (John Wiley & Sons, New York, 1998). [7] A. Gupta, D. O. Stahl, and A. B. Whinston, An Economic Approach to Network Computing with Priority Classes, Journal of Organizational Computing and Electronic Commerce 6, No. 1 (1996) 71-95. [8] A. Gupta, D. O. Stahl, and A. B. Whinston, The Economics of Network Management, Communications of the ACM 42, No. 9 (1999) 57-63. [9] M. L. Katz and C. Shapiro, Technology Adoption in the Presence of Network Externalities, Journal of Political Economy 94, No. 4 (1986) 822-841. [10] J. King, Pay-as-you- go Apps on Tap, Computerworld 30, No. 31 (July 29, 1996).
27
[11] S. Leibs, Software for Rent – Internet Providers Hope Renting Apps Will Bring Them Closer to Customers, CMPnet (May 25, 1998). [12] J. D. C. Little, A Proof for the Queueing Formula L = λ W, Operations Research 9, (1961) 383-387. [13] J. K. MacKie-Mason and H. R. Varian, Pricing Congestible Resources, IEEE Journal of Selected Areas in Communications 13, No. 7 (1995) 1141-9. [14] M. Maclachian, Interliant Offers Web-Based App Rentals, CMPnet (September 21, 1998). [15] Mendelson, Pricing Computer Services: Queueing Effects, Communications of the ACM 28, No. 3 (1985) 312-321. [16] H. Mendelson and S. Whang, Optimal Incentive-Compatible Priority Pricing for the M/M/1 Queue, Operations Research 38, No. 5 (1990) 870-883. [17] S. Nash, S., Apps for Rent, PC Magazine Online (March 23, 1999). [18] P. Naor, The Regulation of Queue Sizes by Levying Tolls, Econometrica 37 (1969) 15-24. [19] W. Y. Oi, A Disneyland Dilemma: Two-Part Tariffs for a Mickey Mouse Monopoly, The Quarterly Journal of Economics 85, No. 1 (1971) 77-96. [20] A. Silberschatz, J. L. Peterson, and P. B. Galvin, Operating System Concepts, third edition (Addison-Wesley Publishing, 1991). [21] S. Wermer, IDC: Spending in High-end Application Service Provider Market will be Euro 1.8 Billion by 2003, Primeur Weekly (May 24, 1999) http://www.hoise.com/primeur/99/articles/monthly/SW-PR-05-99-24.html.
28
Dr. Hsing Kenneth Cheng is the American Economic Institutions Associate Professor at the Department of Decision and Information Sciences of the University of Florida. Prior to joining UF, he served on the faculty at The College of William and Mary from 1992 to 1998. He received his Ph.D. from William E. Simon Graduate School of Business Administration, University of Rochester in 1992. Professor Cheng teaches information technology strategy, electronic commerce, and supply chain management. His research interests involve electronic commerce, economics of information systems, and supply chain management. His work has appeared in Computers and Operations Research, Decision Support Systems, European Journal of Operational Research, IEICE Transactions, Journal of Business Ethics, Journal of Management Information Systems, and Socio-Economic Planning Sciences. He also contributed book chapters on “Hacking, Computer Viruses, and Software Piracy: The Implications of Modern Computer Fraud for Corporations” and “The Critical Role of Information Technology for Employee Success in the Coming Decade.”
Professor Koehler is the John B. Higdon Eminent Scholar of Decision and Information Sciences at the Department of Decision and Information Sciences of the University of Florida. He has been at the university for several years and served as Chair of the department for the period 1990 - 94. His recent teaching has been in business objects and e-commerce for the graduate programs. Professor Koehler was a faculty member at Purdue University, has worked as a consultant for a number of firms, and was the cofounder of Micro Data Base Systems, Inc., a firm in which he served as CEO for the period 1981 - 87. He has more than 50 papers published in leading academic journals and he currently serves on the editorial boards of Decision Support Systems; Decision Sciences; International Journal of Business; Journal of Information Technology and Management, INFORMs On-line
29
Customers: number of potential customers. number of actual customers. Service parameters: s number of servers available. µ exponential service rate for each servers. λ exponential inter-arrival rate for each customer. Require λ < s µ . T the ASP service contract period. d minimum number of accesses required over time T, the performance guarantee. Revenue and costs: OC annualized software ownership costs, including software cost, maintenance costs, operating costs, and costs of possibly upgrading to bigger computers, etc. F fixed fee for service. p metered price of service. y reimbursement to customers for waiting to access service. R customer reservation price, a random variable with pdf f (r ) > 0 . ℜ distribution function for R. ω(F, p, y | s ) revenue with pricing policy (F,p,y) given s servers. c(s ) cost for supplying s servers. Queue statistics: Lq expected queue length. L expected number of customers in the queue. Wq expected waiting time in queue (excludes service time). W expected waiting time in queue (includes service time). Other: x the largest integer less than or equal to x. the smallest integer greater than or equal to x. x N M
Z+
non-negative integers. Table 1: Summary of Notation
30
Policy Fixed Price
p*
y*
F*
0
0
V * M*
c h
M*
Fixed Price with waiting-time allowance
0
F−
c h cλ TM
µV * M *
Metered Usage
−1
*
Metered Usage with waiting-time allowance
c h cλ TM
µV M *
*
Two-part pricing Two-part pricing with waiting-time allowance
+ W*
*
−1
F V cM h − F I λ µG H TM TJK c
+ W*
*
−1
*
0
h
*
*
h
+ W* + µyWq*
F V cM h − F I λ GH TM TJKc *
µ
V* (M * ) ≤ F0.
Also, since b(M) is increasing in M, we have
b ( M ) = β b ( M + 1)
β M βℜ−1 N N is negative. Hence, V ( M ) is unimodal.
33
.
2 , ∆V is strictly decreasing in M and ∆ V