A SIP: Optimal Product Selection from Feature Models using Many-Objective Evolutionary Optimisation Robert M. Hierons, Brunel University London, UK Miqing Li, Brunel University London, UK XiaoHui Liu, Brunel University London, UK Sergio Segura, University of Seville, Spain Wei Zheng, Northwestern Polytechnical University, China
A feature model specifies the sets of features that define valid products in a software product line. Recent work has considered the problem of choosing optimal products from a feature model based on a set of user preferences, with this being represented as a many-objective optimisation problem. This problem has been found to be difficult for a purely search-based approach, leading to classical many-objective optimisation algorithms being enhanced by either adding in a valid product as a seed or by introducing additional mutation and replacement operators that use a SAT solver. In this paper we instead enhance the search in two ways: by providing a novel representation and also by optimising first on the number of constraints that hold and only then on the other objectives. In the evaluation we also used feature models with realistic attributes, in contrast to previous work that used randomly generated attribute values. The results of experiments were promising, with the proposed (SIP) method returning valid products with six published feature models and a randomly generated feature model with 10,000 features. For the model with 10,000 features the search took only a few minutes. CCS Concepts: rSoftware and its engineering → Software product lines; rMathematics of computing → Optimization with randomized search heuristics; Additional Key Words and Phrases: Product Selection ACM Reference Format: Robert M. Hierons, Miqing Li, XiaoHui Liu, Sergio Segura, and Wei Zheng, 2015. SIP: Optimal Product Selection from Feature Models using Many-Objective Evolutionary Optimisation ACM Trans. Softw. Eng. Methodol. V, N, Article A (January YYYY), 34 pages. DOI: http://dx.doi.org/10.1145/0000000.0000000
1. INTRODUCTION
In recent years there has been significant interest in software product lines (SPLs) in which families of products are systematically developed using a set of reusable assets. The set of products within an SPL is typically described by a feature model, with a feature being some aspect of system functionality [Clements and Northrop 2001]. A product is seen as being a set of features and the feature model defines the constraints between features and so specifies which combinations of features define valid products. There is evidence of feature models being used by companies such as Boeing [Sharp 1998], Siemens [Hofman et al. 2012], and Toshiba [Matsumoto 2007]. Author addresses: R. M. Hierons, Department of Computer Science, Brunel University London, UK and Miqing Li, Department of Computer Science, Brunel University London, UK and XiaoHui Liu, Department of Computer Science, Brunel University London, UK and Sergio Segura, University of Seville, Spain and Zheng Wei, Northwestern Polytechnical University, China Permission to make digital or hard copies of all or part of this work for personal or classroom use is granted without fee provided that copies are not made or distributed for profit or commercial advantage and that copies bear this notice and the full citation on the first page. Copyrights for components of this work owned by others than ACM must be honored. Abstracting with credit is permitted. To copy otherwise, or republish, to post on servers or to redistribute to lists, requires prior specific permission and/or a fee. Request permissions from
[email protected]. c YYYY ACM. 1049-331X/YYYY/01-ARTA $15.00
DOI: http://dx.doi.org/10.1145/0000000.0000000 ACM Transactions on Software Engineering and Methodology, Vol. V, No. N, Article A, Pub. date: January YYYY.
A:2
R. M. Hierons et al.
Much of the focus of research regarding feature models has been on automated techniques that analyse a feature model [Benavides et al. 2010]. This has led to a range of techniques that will, for example, determine whether a feature model is valid (defines one or more products) or whether there are features that appear in no valid products. There are tools such as FaMa [Benavides et al. 2007], SPLAR [Mendonca et al. 2009] ¨ et al. 2014] that implement many analysis techniques. and FeatureIDE [Thum Another line of work has considered the problem of automatically determining ‘optimal’ products based on a feature model and information regarding user preferences. The result of a search might be used, for example, to determine which products to release first or which to test. Naturally, there are several aspects that can be used to determine whether a product is ‘optimal’ and these relate to the values of attributes of the features1 . For example, one might prefer products that contain many features since these will satisfy the demands of more customers. One might also favour products that have a low associated cost. Recently Sayyad et al. [Sayyad et al. 2013d] noted that this leads to a many-objective optimisation problem2 and they explored the use of several many-objective optimisation algorithms. Since a product must satisfy all of the constraints in the feature model, one objective was the number of constraints that fail. In this initial piece of work they used six evolutionary many-objective optimisation (EMO) algorithms, including NSGA-II [Deb et al. 2002], SPEA2 [Zitzler et al. 2002], ¨ and IBEA [Zitzler and Kunzli 2004], finding that IBEA outperformed the other techniques. This work was developed further in a second paper by Sayyad et al. [Sayyad et al. 2013c]. The authors used larger examples in their evaluation and found that their original approach tended not to find valid products3 . This led to two developments. The first was to remove core features (features that appear in all valid products) from the representation used in the search; these features are added to any product returned by the search. The second enhancement was to seed the search with a valid product. While the search for a seed introduced an initial overhead, it significantly improved the performance of both NSGA-II and IBEA. An alternative, introduced by Henard et al. [Henard et al. 2015], is to use a SAT solver to implement new mutation and replacement operators used in an EMO algorithm. Although Sayyad et al. [Sayyad et al. 2013c] and Henard et al. [Henard et al. 2015] devised enhancements that led to EMO algorithms returning valid products, these enhancements have some disadvantages. (1) The search for an initial seed takes time. Sayyad et al. [Sayyad et al. 2013c] used one large feature model in their evaluation (the Linux kernel with 6,888 features) and for this feature model the initial search for a seed took approximately three hours. (2) The new replacement and mutation operators, which use SAT solvers, complicate the overall search process, requiring additional parameters to be set (to specify how often these new operators are to be applied). The smart mutation operator determines which features are not involved in the violation of constraints, fixes the values of these features, and then asks a SAT solver to look for a set values for the other features that defines a valid product. The smart replacement operator ran1 Similar
to other authors, we assume that attribute values are fixed. use the term many-objective since in the evolutionary computation community, “multi-objective” means 2 or 3 objectives, while “many-objective” means 4 or more objectives. It is widely accepted that manyobjective optimisation problems are much harder to solve than 2/3 objective ones. 3 A product is valid if all of the constraints in the feature model hold. Typically, the software engineer is only interested in valid products. 2 We
ACM Transactions on Software Engineering and Methodology, Vol. V, No. N, Article A, Pub. date: January YYYY.
SIP: Optimal Product Selection from Feature Models using Many-Objective Evolutionary OptimisationA:3
domly replaces a configuration with a new valid configuration. The new operators take longer to apply than classical operators. This paper addresses two factors that we believe make this problem, of finding ‘good’ valid products, difficult: there are many constraints (all must be satisfied); and as the number of objectives increases there is less evolutionary pressure on the number of constraints that fail (this is just one of several objectives). This paper describes a method that avoids the need for a SAT solver or an initial search for a seed and introduces two developments that directly address these points. The first of these is a novel automatically derived representation that aims to reduce the scope for returning invalid products. Essentially, this representation hard-codes two types of constraints and so ensures that all solutions returned satisfy these constraints. The first type of constraint relates to core features, which are features that are in all products: such features can be removed from the representation and added back into any products returned. This enhancement to the representation, in which core features are removed, has already been used by Sayyad et al. [Sayyad et al. 2013c] and Henard et al. [Henard et al. 2015]. The second type of constraint is that sometimes we have that a feature F is included in a product if and only if one or more of its children is in the product. In such situations, there is no need to include F in the representation: if a solution returned by the search contains one or more children of F then F is added back into the product. The second development is to compare candidate solutions on the basis of the number of constraints that do not hold and then, if they are equal on this, the remaining n objectives. We call this the 1+n approach and use the name (n+1) for the traditional approach in which all n+1 objectives are treated as being equal. For the (n+1) approach we use brackets around ‘n+1’ to emphasise the fact that the n+1 objectives are all considered together, in contrast to the 1+n approach in which one objective is considered first. We use the name SIP (ShrInk Prioritise) to denote the combination of the novel encoding (that shrinks the representation), the 1+n approach (that prioritises the number of constraints that fail), and an EMO algorithm. The aim of both developments was to produce a search that returns more valid products, providing the software engineer with a wider range of products from which to choose. We evaluated the proposed SIP method on the two case studies used in the initial work of Sayyad et al. [Sayyad et al. 2013d] (WebPortal and E-Shop) and four additional published case studies: BerkeleyDB; Amazon; Drupal; and ERS4 . Previous work suggests that methods based on Pareto dominance are less effective than those that are not and so we implemented one algorithm that is based on Pareto dominance (NSGAII) and five that are not (IBEA, SPEA2+SDE [Li et al. 2014a], and three versions of MOEA/D [Zhang and Li 2007]). These non-Pareto EMO algorithms are state of the art in the EMO field and have been demonstrated to be very effective in many-objective optimisation [Wagner et al. 2007; Hadka and Reed 2012; Li et al. 2013; Li et al. 2014]. Experimental studies in this area have used synthetic values for the attributes of a feature model and this introduces a threat to validity: it is possible that the performance of search will be very different in practice. In order to explore this issue we had experiments in which we used realistic values for the attributes of the Amazon and Drupal feature models. For the Drupal model we had real attributes and values ob´ tained using repository mining [Sanchez et al. 2015]. While we did not have such real values for the Amazon feature model, we did have real attribute names and constraints on the values; we randomly generated realistic values from within the corresponding 4 The
SIP code can be found at https://dx.doi.org/10.17633/rd.brunel.2115802 and the experimental data at https://dx.doi.org/10.17633/rd.brunel.2115490.v1
ACM Transactions on Software Engineering and Methodology, Vol. V, No. N, Article A, Pub. date: January YYYY.
A:4
R. M. Hierons et al.
ranges. These attributes are not those previously considered in this area and so we had a different set of (eight) objectives. A final experiment used a larger randomly generated feature model with 10,000 features. This is larger than the largest feature model previously considered, which had 6,888 features. The following are the main contributions of this paper. (1) A novel representation that forces a number of constraints to hold. (2) A new approach that considers one objective (number of constraints that fail) as being more important than the others (the 1+n approach). (3) Experimental evaluation on six published feature models, including two not previously considered (Amazon and Drupal). (4) The first work to use feature models with realistic attribute values (Amazon and Drupal). (5) Experimental evaluation on the largest feature model used in this area: a randomly generated feature model with 10,000 features. (6) The use of six EMO algorithms, four of which (SPEA2+SDE and three variants of MOEA/D) have not previously been applied to the product selection problem. The product selection problem differs from many other multi-objective problems in two main ways: there can be many objectives (in our experiments, up to 8); and a product returned is only of value if one particular objective (number of constraints that fail) reaches its optimal value. The results were promising, with the SIP method proving to be effective. In most cases the SIP method returned a population containing only valid products in all runs. The two exceptions were the Amazon model with realistic attributes and the larger randomly generated model. However, valid products were returned even for these feature models. We recorded the time taken by the search for the larger model with 10,000 features and found that for all EMO algorithms the mean time (over 30 executions) was under four minutes for the SIP method. Note that Sayyad et al. and Henard et al. allowed their approaches to search for 30 minutes and Sayyad et al. had an additional three hour search for a seed. Interestingly, with the SIP method we found that no search algorithm had consistently superior performance. In contrast, in previous work the performance varied significantly between different EMO algorithms. The results suggest that the SIP method is capable of transforming the search problem into one that is much easier to solve. We believe that the results can contribute to the development of robust techniques for searching for optimal products. Importantly, it should be straightforward to use the SIP method with other EMO algorithms. Observe also that our enhancements are tangential to those of Sayyad et al. and Henard et al. and it should be possible to combine them. This paper is structured as follows. In Section 2 we start by briefly describing feature models and approaches to many-objective optimisation. Section 3 describes the SIP method and Section 4 outlines the experimental design. Section 5 gives the results of the experiments and Section 6 discusses these and what they tell us about the research questions. Section 7 outlines threats to validity and Section 8 describes earlier work on product selection. Finally, Section 9 draws conclusions and discusses possible lines of future work. 2. BACKGROUND
In this section we provide background material regarding feature models (Section 2.1) and evolutionary many-objective optimisation algorithms (Section 2.2). ACM Transactions on Software Engineering and Methodology, Vol. V, No. N, Article A, Pub. date: January YYYY.
SIP: Optimal Product Selection from Feature Models using Many-Objective Evolutionary OptimisationA:5 2.1. Feature Models
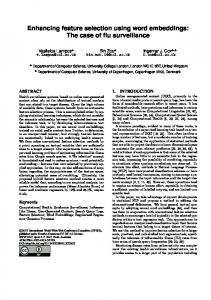
Software Product Line (SPL) engineering is a systematic approach to develop families of software products [Clements and Northrop 2001]. Products in SPLs are defined in terms of features, a feature being an increment in product functionality [Batory et al. 2006]. Feature models are commonly used as a compact representation of all the products in an SPL [Kang et al. 1990]. A feature model is visually represented as a tree-like structure in which nodes represent features, and connections illustrate the relationships between them. These relationships constrain the way in which features can be combined to form valid configurations (products). For example, the feature model in Fig. 1 illustrates how features are used to specify and build software for Global Position System (GPS) devices. The software loaded into the GPS device is determined by the features that it supports. The root feature (‘GPS’) identifies the SPL. The following types of relationships constrain how features can be combined in a product. — Mandatory. If a feature has a mandatory relationship with its parent feature, it must be included in all the products in which its parent feature appears. In Fig. 1, all GPS products must provide support for Routing. — Optional. If a feature has an optional relationship with its parent feature, it can be optionally included in products that include its parent feature. For instance, Keyboard is defined as an optional feature of the user Interface of GPS products. — Alternative. A set of child features are defined as alternative if exactly one feature should be selected when its parent feature is part of the product. In the example, GPS products must provide support for either a Touch screen or an LCD screen but not both in the same product. — Or-Relation. Child features are said to have an or-relation with their parent when one or more of them can be included in the products in which its parent feature appears. In Fig. 1, software for GPS devices can provide support for 3D map viewing, Auto-rerouting or both of them in the same product. In addition to the parental relationships between features, a feature model can also contain cross-tree constraints between features. These are typically of the form: — Requires. If a feature A requires a feature B, the inclusion of A in a product implies the inclusion of B in this product. For example, GPS devices with Traffic avoiding require the Auto-rerouting feature. — Excludes. If a feature A excludes a feature B, both features cannot be part of the same product. In Fig. 1, GPS devices with Touch screen exclude the support for a Keyboard. Feature models can be extended with extra-functional information by means of feature attributes. An attribute usually consists of a name, a domain and a value. Fig. 1 depicts several feature attributes using the notation proposed by Benavides et al. [Benavides et al. 2005]. As illustrated, attributes can be used to specify extra-functional information such as cost or RAM memory required to support the feature. Similar to other authors, in this paper we assume that the attribute values are fixed. The automated analysis of feature models deals with the computer-aided extraction of information from feature models. Catalogues with up to 30 analysis operations on feature models have been published [Benavides et al. 2010]. Typical analysis operations allow us to know whether a feature model is consistent (it represents at least one product), the number of products represented by a feature model, or whether a feature model contains any errors. In this paper, we address the so called optimisation analysis operation [Benavides et al. 2010]. This operation takes an attributed feature model and a set of objective functions as inputs and returns one or more products fulfilling ACM Transactions on Software Engineering and Methodology, Vol. V, No. N, Article A, Pub. date: January YYYY.
A:6
R. M. Hierons et al. Name: Cost Domain: Real Value: 36.5 Name: Memory Domain: Integer Value: 740
Name: Cost Domain: Real Value: 21.5
GPS
Routing
3D map
Traffic avoiding
Auto-rerouting
AM
FM
Name: Memory Domain: Integer Value: 240
Interface
Radio
Digital
Keyboard
Screen
Touch
LCD
Mandatory
Alternative
Requires
Optional
Or
Excludes
Fig. 1. A sample feature model
the criteria established by the functions. For instances, we might search for a GPS program minimising cost and memory consumption. The analysis of a feature model is supported by a number of tools including the FaMa framework [Trinidad et al. 2008], ¨ et al. 2014] and SPLAR [Mendonca et al. 2009]. FeatureIDE [Thum 2.2. Evolutionary many-objective optimisation algorithms
Evolutionary algorithms (EAs) are a class of population-based metaheuristic optimisation algorithms that simulate the process of natural evolution. EAs are often well suited to many-objective problems (MOPs) because 1) they ideally do not make any assumption about the underlying fitness landscape and the considered objectives can be easily added, removed, or modified; 2) their population-based search can achieve an approximation of an MOP’s Pareto front5 , with each individual representing a trade-off amongst the objectives. Despite being the most popular selection criterion in the EMO area, Pareto dominance encounters difficulties in its scalability to optimisation problems with more than three objectives (many-objective optimisation problems) [Wagner et al. 2007; Ishibuchi et al. 2008; Li et al. 2014b]. Due to the exponential decrease of the portion of the space that one point dominates, Pareto dominance is less able to differentiate points in the space. Recently, non-Pareto algorithms (algorithms that do not use Pareto dominance as the main selection criterion) have been shown to be promising in dealing with manyobjective optimisation problems [Deb and Jain 2014; Bader and Zitzler 2011; Yang et al. 2013; Ishibuchi et al. 2015]. They typically provide higher selection pressure searching towards the Pareto front than Pareto-based algorithms. In this paper, we consider six EMO algorithms. One is a classic Pareto-based algorithm, NSGA-II [Deb et al. 2002], and the rest are five non-Pareto-based algorithms, ¨ Indicator-Based Evolutionary Algorithm (IBEA) [Zitzler and Kunzli 2004], three versions of the decomposition-based algorithm MOEA/D (MOEA/D-WS [Zhang and Li 2007], MOEA/D-TCH [Zhang and Li 2007], and MOEA/D-PBI [Zhang and Li 2007]) and SPEA2+SDE [Li et al. 2014a]. Of these, only NSGE-II and IBEA have previously been applied to the problem of product selection. IBEA is an indicator-based algorithm that uses a given performance indicator to guide the search. MOEA/D-WS, 5 An individual x is said to Pareto dominate an individual y if x is as good as y in all objectives and better in at least one objective. The Pareto front is the set of elements of the objective space that are not Pareto dominated by any other elements of the objective space.
ACM Transactions on Software Engineering and Methodology, Vol. V, No. N, Article A, Pub. date: January YYYY.
SIP: Optimal Product Selection from Feature Models using Many-Objective Evolutionary OptimisationA:7
MOEA/D-TCH, and MOEA/D-PBI are three versions of the decomposition-based algorithm MOEA/D, which uses three decomposition functions, weight sum, Tchebycheff, and penalty-based boundary intersection, respectively. SPEA2+SDE modifies the original SPEA2 by a shift-based density estimation, in order to enable the algorithm to be suitable for many-objective problems. These EMO algorithms are representative in the EMO area and, apart from NSGA-II, all have been found to be effective in dealing with many-objective optimisation problems with certain characteristics [Wagner et al. 2007; Hadka and Reed 2012; Li et al. 2013; Li et al. 2014]. 3. THE PROPOSED SIP METHOD
In this section we describe the components of the SIP method. We start by describing two approaches to optimisation that can be used with any EMO algorithm: one considering all objectives to be equal (the (n+1) approach used in previous work) and the new approach that considers the number of constraints violated and then the other objectives (the 1+n approach). We then describe the novel representation. 3.1. Optimisation approach used
Before applying an EMO algorithm to optimise the objectives in SPL product selection, an important issue is how to ‘view’ these objectives. A feature model contains a number of constraints that define the valid products. For example, in Figure 1 there is the constraint that a product cannot have both a Keyboard and a Touch screen interface. In order to direct the search towards valid products, one objective is the number of constraints violated (we wish to minimise this). One overall approach to optimisation is to treat all objectives equally, as done in most previous work6 . A PPROACH 1. The (n+1) approach: all the objectives are viewed equally in the optimisation process of EMO algorithms. This deals with all the objectives simultaneously and attempts to obtain a set of good trade-offs among them. However, as previously observed [Henard et al. 2015], a software engineer will typically only be interested in products that satisfy all of the constraints. In such situations, the above (n+1) approach may not be suitable since it does not reflect the interest in valid products. This suggests that there is one main objective (whether the product is valid) and the others are less important. We therefore also implemented a new approach to optimisation in which the first objective (number of constraint violations) is viewed as being the main objective and then the remaining objectives as equal secondary objectives to be optimised. A PPROACH 2. The first objective (number of constraint violations) is viewed as the main objective to be considered first and then the remaining objectives as secondary objectives to be optimised equally. We call this the 1+n approach. Specifically, we used two simple rules to compare individuals in EMO algorithms: 1) prefer the individual with fewer constraint violations and 2) prefer the individual with better fitness (determined by the remaining objectives) when the number of violated constraints is equal. In EMO algorithms, there are two operations in which individuals are compared, mating selection and environmental selection. Mating selection, which provides promising individuals for variation, is implemented by choosing the best individual 6 An
exception is the PULL method of Sayyad, in which the number of constraints that fail is given a higher weighting. This is discussed in further detail in Section 8.
ACM Transactions on Software Engineering and Methodology, Vol. V, No. N, Article A, Pub. date: January YYYY.
A:8
R. M. Hierons et al.
from the mating pool (a set of candidate individuals). The proposed rules can be directly applied to this selection process: the individual having the fewest constraint violations is chosen, and if there exist several such individuals then the one with the best fitness is chosen (in the usual way). Environmental selection, which determines the survival of individuals in the population, is implemented in different ways in EMO algorithms. If the population evolves in a steady-status way [Durillo et al. 2009] in an algorithm, environmental selection is implemented when only one new individual is produced. In this situation, the proposed rules can also be directly applied to the comparison between the new individual and some (or all) old ones in the population, as done in mating selection. On the other hand, if the population evolves in a generational way in an EMO algorithm, environmental selection is implemented when a set of new individuals is produced, where the size of the set is typically equal to the population size N . In this situation, N individuals will be chosen (to construct the next population) from a mixed set of the last population and the newly produced individuals on the basis of the proposed rules. Here, we group individuals of the mixed set into the next population according to their constraint violations, i.e., individuals with the fewest constraint violations being chosen first, individuals with second fewest constraint violations second, and so on. This procedure is continued until the population is full, or not full but cannot accommodate the next group of individuals with a particular value for the number of constraint violations. The second case happens quite often since there could be many individuals with the same number of constraint violations. In this case, the selection strategy of the considered EMO algorithm is used to choose some of the individuals from the next group to fill the remaining slots of the population. This property, of having one main goal, is not one normally found in many-objective optimisation. Typically, for a many-objective optimisation problem there is no hierarchy among objectives and different decision makers may have different preferences for the objectives. Consequently, EMO algorithms typically search for a set of solutions representing the whole Pareto optimal front (i.e., a set of representative trade-offs among objectives), so that the decision maker can select one from these solutions according to his/her preference. The constraint-handling method described above is similar to Deb et al.’s in NSGAII [Deb et al. 2002], but with the following differences. NSGA-II integrates constraint handling into the Pareto dominance relation and only considers the comparison between two individuals; in contrast, the 1+n method is more general since it is designed to compare and select any number of individuals, thus being suitable for any EMO algorithm. In addition, in NSGA-II the fitness comparison is activated only when both individuals are valid (i.e., no constraint violations), while in the 1+n method the fitness comparison is made when the considered individuals have the same number of violated constraints. This is more suitable for the considered problem, since most individuals in the search process are invalid, with many having the same number of constraint violations. 3.2. A novel representation
The natural representation, which was used previously [Sayyad et al. 2013d], is to represent a product as a binary string where for a feature Fi there is a corresponding gene, with value 1 if the product contains Fi and otherwise 0. This is a direct representation of the set of features in a product. In initial experiments with the E-shop and WebPortal case studies7 (Section 5) we found that many of the products returned 7 We
used experiments with these two case studies to explore the nature of the problem. Once we settled on a range of approaches we used additional case studies in the final evaluation.
ACM Transactions on Software Engineering and Methodology, Vol. V, No. N, Article A, Pub. date: January YYYY.
SIP: Optimal Product Selection from Feature Models using Many-Objective Evolutionary OptimisationA:9
were invalid and this is consistent with the observations of Sayyad et al. [Sayyad et al. 2013d]. We conjectured that performance was adversely affected by the following patterns. (1) The failure to include core features (features that are contained in all valid products). The initial work by Sayyad et al. [Sayyad et al. 2013d] did not take these into account but their enhanced version did [Sayyad et al. 2013c] as did Henard et al. [Henard et al. 2015]. (2) The inclusion of one or more children of a feature F even though F is not in the product. In the first case the problem is that any set of features that fails to contain a core feature F must be invalid. To tackle this issue we simply removed all core features from the representation; such features would be added back into the candidate solutions at the end of the search. Core features were found using the SPLAR tool [Mendonca et al. 2009]. This change to the representation immediately avoids the inclusion of some invalid products and was used by Sayyad et al. in their second paper on this topic [Sayyad et al. 2013c] and later by Henard et al. [Henard et al. 2015]. It would also have been possible to remove any dead features that were present (features that appear in no valid products). However, sensible feature models do not contain dead features and tools such as FaMa [Benavides et al. 2007] and SPLAR [Mendonca et al. 2009] can be used to detect dead features. For the second case, the problem is that if a feature F 0 is in a product and F 0 has parent F that is not in the product then the product cannot be valid. This pattern is entirely syntactic and it is straightforward to identify cases where it occurs. Further, in such a case the inclusion of F 0 implies the inclusion of F . This might suggest that we only need include leaf features in our representation. However, this is not quite right since it excludes the case where a feature F is in a product but none of its children are in the product (they are optional); such a representation could therefore exclude some valid products. We therefore excluded a feature F if the following property holds: F has one or more children and is involved in a relationship that is either a Mandatory, Alternative, or Or relationship (Optional relationships have no effect). If this property holds then F is included in a valid product if and only if one or more of its children are in the product. Thus, there is no need to include F in the representation and we add F to a set of features returned by the search if and only if one or more of its children are in the set. A parent feature F added using this step may, itself, be a child of a feature that is not in the set and so this second rule is applied repeatedly until no more features can be added. The number of iterations of this process is at most the depth of the tree representing the feature model and this process takes time that is linear in the size of the feature model. A feature F is kept if there is an Optional relationship with all of its children since it is possible for a valid product to include F but no children of F . This is one way in which invalid products can result: we might have a product that does not include F but does include one or more of its children. Invalid products can also result from cross-tree constraints. Consider, for example, the feature model for GPS devices given in Figure 1. The initial representation would include a bit for each feature and so would contain one bit for each of the features (GPS, Routing, 3D map, Auto-rerouting, Traffic avoiding, Interface, Keyboard, Screen, Touch, LCD, Radio, AM, FM, Digital). GPS, Routing, Interface, and Screen are core features and so would not be included under the enhanced representation of Sayyard at al. and Henard et al. Now consider Radio and its three children (FM, AM and Digital) that are in an Or relationship. Under the approach of Sayyard et al. and Henard et al. all four features would be represented by bits in the encoding. However, a valid product contains the feature Radio if and only if it contains ACM Transactions on Software Engineering and Methodology, Vol. V, No. N, Article A, Pub. date: January YYYY.
A:10
R. M. Hierons et al.
one or more of its children. As a result, our encoding would include bits for FM, AM and Digital but would not have a bit for Radio. In this example the novel encoding has two main benefits: (1) The representation is smaller, as well as the search space, as a consequence. (2) It is not possible to represent products that contain one or more of FM, AM and Digital but do not include the feature Radio. This is useful because all such products are invalid. In principle it might be possible to further adapt the representation by taking into account cross-tree constraints. We might also have adapted the representation so that only one child in an Alternative relationship could be included. We see the further development of the representation, to ensure that additional constraints must be satisfied, as a topic for future work. The overall (novel) encoding is therefore to use a binary string, where there is a value vi for feature Fi if and only if Fi is not core and also Fi does not have one or more children that are in a Mandatory, Or, or Alternative relation. If the search returns a set P 0 of features then we generate the corresponding candidate product by applying the following steps. (1) Add to P 0 all core features. (2) Add to P 0 any feature F not in P 0 such that P 0 contains one or more children of F and apply this step repeatedly until no more features can be added. In the experiments we compared the following representations. (1) That initially used by Sayyad et al. [Sayyad et al. 2013d]. We called this the direct encoding since each feature has a corresponding bit in the representation. (2) That used in the second paper of Sayyad et al. [Sayyad et al. 2013c] and also by Henard et al. [Henard et al. 2015]. We called this the core encoding since we do not represent the core features. (3) A representation in which we retain core features but do not include a feature if the following holds: the feature is included in a valid product if and only if one or more of its children are in the product. We called this the hierarchical encoding. (4) The novel representation outlined in this section, which is the combined application of (2) and (3). We called this the novel encoding. We included the third representation in order to be able to separately assess the two enhancements in the novel encoding. However, this representation was only used in the initial experiments: the main focus of the experiments was to compare our novel encoding with the previously proposed direct and core encodings. The representations, for the GPS example, are given in Table I. To conclude, the proposed SIP method is to use: the novel encoding; the 1+n approach; and an EMO algorithm. 4. EXPERIMENTAL DESIGN
The main aim of the experiments was to explore the relative performance of the different representations and algorithms and for this we used six published feature models and a larger randomly generated feature model. We structured the work as follows: we performed initial experiments on two of the feature models (E-shop and WebPortal) and in these initial experiments we discovered that the algorithms (when the (n+1) approach and direct encoding are used) returned relatively few valid products. This led to two enhancements: a new representation and the 1+n approach. We then carried out experiments using the six published models. This was followed by experiments with ACM Transactions on Software Engineering and Methodology, Vol. V, No. N, Article A, Pub. date: January YYYY.
SIP: Optimal Product Selection from Feature Models using Many-Objective Evolutionary OptimisationA:11 Table I. Features included in each encoding on the GPS SPL Feature GPS Routing 3D map Auto-rerouting Traffic avoiding Radio FM AM Digital Interface Keyboard Screen Touch LCD
Direct X X X X X X X X X X X X X X
Core
X X X X X X X X X X
Encoding Hierarchical X X X X X X X X X X X X X
Novel
X X X X X X X X X
two cases studies that had realistic values of attributes, rather than randomly generated attributes (as used in previous work) and then experiments with the larger randomly generated feature model. In all experiments, we used the SPLAR tool to determine which features are core [Mendonca et al. 2009]. The experiments were performed 30 times to reduce the impact of the stochastic nature of the algorithms. We now describe the research questions. First, there is the question of whether the encoding used affects the performance of the search and, within this, whether the novel encoding is more effective than the previously used direct and core encodings. R ESEARCH Q UESTION 1. How does the encoding affect the performance of the search techniques? Our additional enhancement was to consider the first objective as the main objective, with the aim being to direct search towards valid products. R ESEARCH Q UESTION 2. Does the use of the 1+n approach make it easier for the search techniques to find valid products? Previous work has found that Pareto based techniques are relatively ineffective when using the direct and core encodings and so most of the search techniques used were not based on Pareto dominance. We were interested in whether there were differences in performance between the search techniques. R ESEARCH Q UESTION 3. Are particular EMO algorithms more effective than others? Previous studies have used feature models with randomly generated attributes and this leads to a particular threat to validity, which is that these results might not transfer to feature models with realistic attributes. R ESEARCH Q UESTION 4. Does the relative performance differ when realistic attribute values are used? R ESEARCH Q UESTION 5. Is the relative performance similar when using a larger randomly generated feature model? While it is important that the search returns valid products, ideally we would like many valid products to be returned. ACM Transactions on Software Engineering and Methodology, Vol. V, No. N, Article A, Pub. date: January YYYY.
A:12
R. M. Hierons et al.
R ESEARCH Q UESTION 6. How does the number of valid products returned by search differ between approaches? Finally, we also care about execution time: if one approach is much quicker than the others then this approach can be allowed to run for more generations. R ESEARCH Q UESTION 7. How does the execution time differ between approaches? 4.1. Experimental Subjects
Table II depicts the attributed feature models used in the evaluation. For each model, the number of features, Cross-Tree Constraints (CTCs), feature attributes and products are presented. The number of attributes gives the number of attributes that each feature has and so the total number of actual values used is the product of the number of features and number of attributes. We give an upper bound on the number of products for the larger randomly generated model since it is not feasible to determine the number of products for such a large model. These models cover a range of sizes in terms of features and attributes. The models BerkeleyDB, ERS, WebPortal and EShop have been used in related works on optimal SPL product selection [Guo et al. 2014; Olaechea et al. 2014; Sayyad et al. 2013b; Sayyad et al. 2013a; Sayyad et al. 2013d]. We used Olaechea et al.’s [Olaechea et al. 2014] version of these models to obtain comparable results. The larger examples used by Sayyard et al. and Henard et al. were written in the DIMACS notation, that provides input to SAT solvers; we did not use these since our method takes as input a feature model written in the SXFM format for feature models. However, we used two recently published feature models, AmazonEC2 and Drupal, with realistic attribute values derived from mining real systems. Table II. Subject models SPL BerkeleyDB ERS WebPortal E-shop Drupal AmazonEC2 Randomly generated
#Features
#CTC
#Attributes per feature
#Products
13 36 43 290 48 79 10,000
0 0 6 21 21 0 0
4 7 4 4 22 17 4
512 6,912 2.1 · 106 5.02 · 1049 2.09 · 109 66,528 ≤ 210000 − 1
BerkeleyDB [Siegmund et al. 2012] provides a high-level representation of variability in a database and ERS [Esfahani et al. 2013] represents variability in an Emergency Response System. Web Portal [Mendonca et al. 2008] and EShop [Lau 2006] represent a product line of web portals and e-commerce applications respectively. Sayaad et al. [Sayyad et al. 2013b; Sayyad et al. 2013a; Sayyad et al. 2013d] and Olaechea et al [Guo et al. 2014; Olaechea et al. 2014] extended these models with three features attributes with randomly generated values: cost, defects and prior usage count. We followed the same approach in this work. ´ Drupal [Sanchez et al. 2015] represents the variability in the open source Web content management framework Drupal. The model is provided with values of 22 nonfunctional attributes extracted from the Drupal GIT repository and the Drupal issue tracking system including, among others, size, changes, defects, cyclomatic complexity, test cases, developers and reported installations. To the best of our knowledge, this is the largest attributed feature model with non-synthetically generated attributes used for the problem of optimal SPL product selection. ACM Transactions on Software Engineering and Methodology, Vol. V, No. N, Article A, Pub. date: January YYYY.
SIP: Optimal Product Selection from Feature Models using Many-Objective Evolutionary OptimisationA:13
´ et al. 2015] represents the configuration space of the Amazon EC2 [Garc´ıa-Galan Amazon Elastic Computing Service. The attributes are mainly related to pricing, usage and hardware constraints including cost per hour, cost per month, cores, RAM, usage and defaultStorage. Attributes in AmazonEC2 do not have a fixed value. Instead, the value of each attribute is derived from the selected features using thousands of constraints of the form “M2 xlarge IMPLIES (Instance.cores==2 AND Instance.ram==17.1)”. For each of these, we assigned a random value to each attribute within its domain. Experiments were also performed on a larger, randomly generated, feature model with 10,000 features. This was generated using the SPLAR tool [Mendonca et al. 2009] and with the following parameters: 25% mandatory features; 25% optional features; 25% alternative features; minimum branching factor of 5; maximum branching factor of 10; maximum size for feature groups of 5; and only consistent models. These values ¨ et al. 2009]. have been found to be typical values for feature models [Thum To summarise, we used four models that have previously been used so that our results can be compared with other studies. We used two additional real feature models (Drupal, Amazon) since we had access to realistic attribute values (either real values or ranges). Finally, we added a randomly generated model with 10,000 features in order to evaluate the approaches on a large model. 4.2. The optimisation problems
In the initial experiments we used the same five objectives as Sayyad et al. [Sayyad et al. 2013d] and Henard et al. [Henard et al. 2015]. (1) Correctness: the number of constraints that were not satisfied. This value should be minimised. (2) Richness of features: how many features were included. This value should be maximised, preferring products with many features. (3) Features that were used before. For each feature this is a boolean and the number for which this is true should be maximised (previously used features are less likely to be faulty and those used before are likely to be more popular). (4) Known defects: the number of known defects in features used should be minimised. There is a constraint on this value: it has to be zero if the feature was not used before. (5) Cost: the sum of the costs of the features included. This value should be minimised. We used the above objectives in order to be consistent with previous work. However, as previously discussed, we included additional experiments in which we used realistic values for attributes. Since we did not have information on all of the above attributes, we instead used eight objectives for which we had realistic values. For Drupal we used the following objectives. (1) Correctness: the number of constraints that were not satisfied. This value should be minimised. (2) Richness of features: how many features were included. This value should be maximised. (3) Number of lines of code. This should be minimised. (4) Cyclomatic complexity. This should be minimised. (5) Test Assertions. This should be maximised. (6) Number of installations that contain the feature. This should be maximised. (7) Number of developers. This should be minimised. (8) Number of changes. This should be minimised. ACM Transactions on Software Engineering and Methodology, Vol. V, No. N, Article A, Pub. date: January YYYY.
A:14
R. M. Hierons et al.
We want to minimise the last two (number of developers and number of changes) since there is evidence that these correlate with how error prone a system is [Matsumoto et al. 2010; Yoo and Harman 2012]. For Amazon we used the following. (1) Correctness: the number of constraints that were not satisfied. This value should be minimised. (2) Richness of features: how many features were included. This value should be maximised, preferring products with many features. (3) EC2.costMonth: (random value from 0 to 20000). This value should be minimised. (4) Instance.cores: (random value from 1 to 32). This value should be maximised. (5) Instance.ecu: (random value from 0 to 108). This value should be maximised. (6) Instance.ram: (random value from 0 to 250). This value should be maximised. (7) Instance.costHour: (random value from 0 to 18). This value should be minimised. (8) Instance.ssdBacked: (Boolean). This value should be maximised. Finally, we included experiments with the larger randomly generated feature model (with 10,000 features). For this we used the original five objectives, again to be consistent with earlier work. 4.3. Implementation details
All the EMO algorithms were executed 30 times for each experiment to reduce the impact of their stochastic nature. The termination criterion used in all the algorithms was a predefined number of evaluations, which was set to 50,000 unless otherwise mentioned. The size of the population for all the algorithms except MOEA/D was set to 100. The population size in MOEA/D, which is the same as the number of weight vectors, cannot be arbitrarily specified. Following the practice in [Yang et al. 2013], we used the closest integer to 100 amongst the possible values as the population size of the three MOEA/D algorithms (126 and 120 for the 5- and 8-objective problems, respectively). Some of the algorithms require several parameters to be set. As suggested in their ¨ original papers [Zhang and Li 2007; Zitzler and Kunzli 2004], the neighbourhood size was set to 10% of the population size in the three MOEA/D algorithms, the penalty parameter θ to 5 in MOEA/D-PBI, and the scaling factor κ to 0.05 in IBEA. Two widely-used crossover and mutation operators in combinatorial optimisation problems, uniform crossover and bit-flip mutation, were used. A crossover probability pc = 1.0 and a mutation probability pm = 1/n (where n denotes the number of decision variables) were set according to [Deb 2001]. As a result of using recommended values from the literature, we did not require a tuning phase. All the experiments were performed on a notebook PC with Intel(R) Core(TM)i53230M Quad
[email protected] GHz with 4GB of RAM. We obtained implementations of the EMO algorithms from standard toolkits 8 . 4.4. Performance metrics
We used three performance metrics to study the results of the experiments. Hypervolume (HV) [Zitzler and Thiele 1999] is a very popular metric in the EMO area due to its good theoretical and practical properties, such as being compliant with Pareto dominance (if one population Pareto dominates another then it has a higher HV) and not requiring the problem’s Pareto front to be known. HV calculates the volume of 8 The
code for NSGA-II was obtained from http://www.iitk.ac.in/kangal, that for IBEA was from http://www. tik.ee.ethz.ch/pisa, the code for MOEA/D was from http://dces.essex.ac.uk/staff/zhang/webofmoead.htm, and that for SPEA2+SDE was from http://www.brunel.ac.uk/∼cspgmml1/Publication.html
ACM Transactions on Software Engineering and Methodology, Vol. V, No. N, Article A, Pub. date: January YYYY.
SIP: Optimal Product Selection from Feature Models using Many-Objective Evolutionary OptimisationA:15
(a)
(b)
(c)
(d)
Fig. 2. HV result (shaded area) for four sets of solutions with respect to a bi-objective minimisation problem scenario. (a) Solution set with good convergence, extensity and uniformity. (b) Solution set with good extensity and uniformity, poor convergence. (c) Solution set with good convergence and uniformity, poor extensity. (d) Solution set with good convergence and extensity, poor uniformity.
the objective space between the obtained solution set and a reference point. A large value is preferable and reflects good performance of the solution set in terms of convergence, extensity and uniformity. Figure 2 gives an illustration of the HV metric for four solution sets with different performance. As shown, the solution set that has good convergence, extensity and uniformity (Figure 2(a)) leads to a larger shaded area (HV value) than the other three solution sets which have poor convergence, extensity or uniformity, respectively (Figure 2(b)–(d)). In the calculation of HV, two crucial issues are the scaling of the search space [Friedrich et al. 2009] and the choice of the reference point [Auger et al. 2009]. Since the objectives in the considered optimisation problems take different ranges of values, we normalised the objective value of the obtained solutions according to the problem’s range in the objective space. Also, the reference point was set to the Nadir point of the problem’s range (the point constructed with the worst value on each objective). In addition, note that the exact calculation of the HV metric is often infeasible for a solution set with seven or more objectives and so for the problems with eight objectives we estimated the HV result of a solution set by the Monte Carlo sampling method used by Bader and Zitzler [Bader and Zitzler 2011]. Here, 10,000,000 sampling points were used to ensure accuracy [Bader and Zitzler 2011]. Since the software engineer is only interested in valid products, we also introduced two metrics to evaluate the ability of each algorithm to return valid products. These metrics are: 1) the number of executions where there was at least one valid individual in the final population, denoted VN; and 2) the rate of valid individuals in the final population, denoted VR. Finally, it is necessary to mention that in computing HV, we only used the valid solutions in the population (as invalid solutions could be meaningless for the decision maker). As a result, we computed HV using only the valid individuals in the final population and so used all objectives except the first one (the number of constraints violated). In addition, the results of HV and VR given in the tables were averaged over the executions where at least one valid individual was returned. In cases where valid solutions were not produced in any of the 30 executions (V N = 0), we reported 0 for HV and VR. Since invalid products have no value, the most important metric is the value of VN. A high value for VR means that the software engineer has many valid products from which to choose and, a high value for HV means that these have good performance in terms of convergence and diversity. ACM Transactions on Software Engineering and Methodology, Vol. V, No. N, Article A, Pub. date: January YYYY.
A:16
R. M. Hierons et al. Table III. E-Shop, 50,000 evaluations, direct encoding Algorithm NSGA-II IBEA MOEA/D-WS MOEA/D-TCH MOEA/D-PBI SPEA2+SDE
(n+1) approach HV VN (/30) 0.000000 0 0.000000 0 0.016184 26 0.000000 0 0.018815 4 0.000000 0
VR 0.00% 0.0% 21.42% 0.00% 10.50% 0.00%
1+n approach HV VN (/30) 0.136545 13 0.169191 16 0.184810 5 0.199697 1 0.166157 5 0.144341 15
VR 100% 100% 100% 100% 100% 100%
5. RESULTS
In this section we start by discussing the initial results of experiments with E-shop and WebPortal; we then describe the results for the four other published systems; we then give the results of the experiments that used realistic values for attributes; and finally we describe the results for the experiments with a larger randomly generated feature model. As explained earlier, in the experiments we recorded the values of HV (Hypervolume), VN (number of executions where there was at least one valid individual in the final population) and VR (the rate of valid individuals in the population on average for the executions where there was at least one valid individual in the final population). The software engineer is only interested in valid products and so we say than an approach is effective if it often returns valid products. 5.1. The E-shop and WebPortal case studies
Initial experiments were carried out using E-shop and WebPortal and with four encodings: the direct encoding; the core encoding (where core features are removed); the hierarchical encoding (where some parents are removed); and the novel encoding. The results for E-shop, with 50,000 evaluations, can be found in Tables III-VI. First consider the (n+1) approach. This was relatively ineffective with the direct encoding, with most techniques failing to return valid products. The main exception to this is MOEA/D-WS, which returned valid products in 26 of the 30 runs. The performance with the hierarchical encoding was not much better, though interestingly NSGA-II also produced valid products on most runs. For both of these, the performance of IBEA was relatively poor. The performance with the core encoding was superior, with several of the search techniques returning valid products on most or all executions. Further improvements can be found with the novel encoding: all but one search technique returned valid products on all executions. For this case, IBEA gave the largest number of valid solutions (a VR of 84.26%) and the highest HV. The performance of the 1+n approach was particularly impressive. For both the core and novel encoding, all solutions returned were valid (a VN of 30 and VR of 100%). For both of these encodings, MOEA/D-WS and MOEA/DTCH had the highest HV values. Note that the 1+n approach always returned a VR value of 100%, even for cases where the (n+1) approach had a low VN value. One explanation is that, once the search has found a valid product it is able to find additional valid products from this (similar to the use of a seed by Sayyad et al. [Sayyad et al. 2013c]) and the search prioritises these above any invalid products. We used rigorous nonparametric statistical tests to compare the HV values returned by the algorithms when using the novel encoding and 1+n approach. We first tested the hypothesis that all EMO algorithms perform equally using the Kruskal-Wallis test, finding that the hypothesis was rejected at the 95% confidence level. Note that this was the case in all of the experiments reported in this paper and so this step is not mentioned again. We then used the post-hoc Kruskal-Wallis test (implemented in SPSS) for pairwise comparisons of the six algorithms. In all of the experiments the final p-value between two algorithms was obtained after the Bonferroni adjustment was made (this step will not be described again). We also used the Mann-Whitney U ACM Transactions on Software Engineering and Methodology, Vol. V, No. N, Article A, Pub. date: January YYYY.
SIP: Optimal Product Selection from Feature Models using Many-Objective Evolutionary OptimisationA:17 Table IV. E-Shop, 50,000 evaluations, hierarchical encoding Algorithm NSGA-II IBEA MOEA/D-WS MOEA/D-TCH MOEA/D-PBI SPEA2+SDE
(n+1) approach HV VN (/30) 0.003545 26 0.236265 7 0.021644 24 0.000000 0 0.000000 0 0.000000 0
VR 2.50% 42.20% 27.64% 0.00% 0.00% 0.00%
1+n approach HV VN (/30) 0.202163 3 0.212066 3 0.242515 2 0.230922 1 0.196956 2 0.187481 3
VR 100% 100% 100% 100% 100% 100%
Table V. E-Shop, 50,000 evaluations, core encoding Algorithm NSGA-II IBEA MOEA/D-WS MOEA/D-TCH MOEA/D-PBI SPEA2+SDE
(n+1) approach HV VN (/30) 0.003343 28 0.267410 30 0.074223 30 0.000000 0 0.070765 30 0.000000 0
VR 2.07% 33.91% 26.74% 0.00% 30.62% 0.00%
1+n approach HV VN (/30) 0.149158 30 0.175422 30 0.207303 30 0.190666 30 0.151068 30 0.152678 30
VR 100% 100% 100% 100% 100% 100%
Table VI. E-Shop, 50,000 evaluations, novel encoding Algorithm NSGA-II IBEA MOEA/D-WS MOEA/D-TCH MOEA/D-PBI SPEA2+SDE
(n+1) approach HV VN (/30) 0.003751 30 0.256768 30 0.209292 30 0.164266 25 0.212182 30 0.206785 30
VR 4.97% 84.26% 52.05% 14.16% 53.59% 15.70%
1+n approach HV VN (/30) 0.162943 30 0.190496 30 0.222875 30 0.226257 30 0.192485 30 0.159930 30
VR 100% 100% 100% 100% 100% 100%
test to calculate the effect size (ES) of pair-wise algorithms. First the standardised test statistic Z was obtained by the Mann-Whitney U test (implemented by SPSS). Then the ES was calculated using ES = √ZN where N is the total number of samples. The results for E-shop are given in Table VII, where a cell having contents x/y denotes the p-value being x and the effect size being y. The results for WebPortal (Tables VIII-XI) and 50,000 evaluations are generally better than those for E-shop. All settings led to valid products being returned on at least 7 occasions and the 1+n approach returned no invalid products. In contrast to E-shop, IBEA returned the highest HV values. Again, we used statistical tests to compare the HV values returned by the algorithms when using the novel encoding and 1+n approach. The results of the post-hoc Kruskal-Wallis test and the effect size are shown in Table XII. We also carried out experiments with E-shop and 500,000 evaluations to see whether this increase in number of evaluations affects performance. The results of these experiments can be found in the Appendix (Tables XXV-XXVIII). The patterns are similar to the results with 50,000 evaluations but it is worth noting that NSGA-II is effective with even the direct encoding. As before, only valid products were returned with the core and novel encoding with the 1+n approach and MOEA/D-WS and MOEA/D-TCH had the highest HV values for these cases. Although we see similar patterns for 50,000 and 500,000 evaluations, the results for 500,000 evaluation are superior. In particular, there was only one case where the VN score for 500,000 was inferior to the score for 50,000 (direct encoding, 1+n approach, MOEA/D-WS). In addition, in all cases with the novel encoding and 1+n approach the HV values for 500,000 were higher than the HV values for 50,000. It may well be that we would obtain even better results if the number of evaluations was increased ACM Transactions on Software Engineering and Methodology, Vol. V, No. N, Article A, Pub. date: January YYYY.
A:18
R. M. Hierons et al. Table VII. E-Shop, 50,000 evaluations, novel encoding: statistical tests
SPEA2+SDE MOEA/D-PBI MOEA/D-TCH MOEA/D-WS IBEA
NSGA-II 0.000/0.8589 0.000/0.8589 0.004/0.8589 1.000/0.2557 0.000/0.8589
IBEA 0.473/0.8284 0.000/0.8589 0.000/0.8589 0.000/0.8589
MOEA/D-WS 0.000/0.8589 0.000/0.8589 0.039/0.8589
MOEA/D-TCH 0.000/0.8589 0.391/0.8570
MOEA/D-PBI 0.346/0.8589
Table VIII. WebPortal, 50,000 evaluations, direct encoding Algorithm NSGA-II IBEA MOEA/D-WS MOEA/D-TCH MOEA/D-PBI SPEA2+SDE
(n+1) approach HV VN (/30) 0.012498 22 0.300289 30 0.089601 29 0.115301 7 0.083995 30 0.260506 30
VR 1.52% 61.64% 24.64% 2.72% 21.41% 17.80%
1+n approach HV VN (/30) 0.222625 30 0.260523 30 0.246124 30 0.270310 30 0.253738 30 0.246970 30
VR 100% 100% 100% 100% 100% 100%
Table IX. WebPortal, 50,000 evaluations, hierarchical encoding Algorithm NSGA-II IBEA MOEA/D-WS MOEA/D-TCH MOEA/D-PBI SPEA2+SDE
(n+1) approach HV VN (/30) 0.119382 30 0.314488 30 0.256401 30 0.223456 8 0.256274 30 0.291120 30
VR 2.60% 88.67% 36.93% 17.72% 39.82% 39.77%
1+n approach HV VN (/30) 0.281518 30 0.315128 30 0.281208 30 0.296501 30 0.303493 30 0.312388 30
VR 100% 100% 100% 100% 100% 100%
Table X. WebPortal, 50,000 evaluations, core encoding Algorithm NSGA-II IBEA MOEA/D-WS MOEA/D-TCH MOEA/D-PBI SPEA2+SDE
(n+1) approach HV VN (/30) 0.059950 30 0.308381 30 0.224224 30 0.134629 30 0.219215 30 0.278030 30
VR 1.70% 78.99% 34.10% 5.44% 32.30% 25.53%
1+n approach HV VN (/30) 0.275413 30 0.307052 30 0.270491 30 0.294767 30 0.291351 30 0.301224 30
VR 100% 100% 100% 100% 100% 100%
Table XI. WebPortal, 50,000 evaluations, novel encoding Algorithm NSGA-II IBEA MOEA/D-WS MOEA/D-TCH MOEA/D-PBI SPEA2+SDE
(n+1) approach HV VN (/30) 0.168637 30 0.318109 30 0.259688 30 0.253752 30 0.258445 30 0.296880 30
VR 6.02% 97.04% 45.69% 34.02% 49.15% 51.83%
1+n approach HV VN (/30) 0.284126 30 0.318734 30 0.285585 30 0.298269 30 0.306512 30 0.314618 30
VR 100% 100% 100% 100% 100% 100%
Table XII. Webportal, 50,000 evaluations, novel encoding: statistical tests SPEA2+SDE MOEA/D-PBI MOEA/D-TCH MOEA/D-WS IBEA
NSGA-II 1.000/0.1756 0.000/0.8589 0.000/0.8589 0.000/0.8589 0.001/0.8570
IBEA 0.000/0.8589 1.000/0.1680 0.000/0.8589 0.000/0.8589
MOEA/D-WS 0.000/0.8589 0.001/0.8589 1.000/0.2847
MOEA/D-TCH 0.000/0.8589 0.000/0.8589
MOEA/D-PBI 0.000/0.8589
ACM Transactions on Software Engineering and Methodology, Vol. V, No. N, Article A, Pub. date: January YYYY.
SIP: Optimal Product Selection from Feature Models using Many-Objective Evolutionary OptimisationA:19
further. We followed the same statistical procedure as before. The results of the posthoc Kruskal-Wallis test and the effect size are shown in the Appendix (Table XXIX). 5.2. The remaining case studies using published feature models
We carried out experiments with Amazon, Berkeley, Drupal, and ERS in order to check whether the results for E-Shop and WebPortal extended to other models (the results of the experiments using Amazon and Drupal with realistic attribute values are described in the next section). As before, we used the two approaches: 1+n; and (n+1). Previously, we carried out experiments with four encodings, using the hierarchical encoding to check that this was not as effective as the novel encoding (i.e. that the enhancements in the core encoding still have value when also using the hierarchical encoding). Having confirmed this, there was no need to carry out additional experiments with the hierarchical encoding. Thus, for the remaining case studies we used the two previously published encodings (direct and core) and the encoding proposed in this paper (the novel encoding). The results for the Amazon model (Appendix, Tables XXX, XXXI and XXXII) again show all algorithms returning only valid solutions when we used the novel encoding and 1+n approach. No other combination of representation and approach to optimisation achieved such strong results but it is worth noting that for the (n+1) approach we have that the novel encoding outperformed the core and direct encodings. For the direct and core encodings, the 1+n approach outperformed the (n+1) approach in terms of number of executions that returned valid solutions (with the exception of IBEA) but the pattern is much more mixed if one considers HV. Thus the 1+n approach was better at finding valid solutions but sometimes returned a less diverse population. Finally, observe that most techniques performed poorly in the experiments using the direct and core encodings and the (n+1) approach; IBEA is the exception to this since it always found at least one valid product. We followed the same statistical procedure as before. The results of the post-hoc Kruskal-Wallis test and the effect size are shown in the Appendix (Table XXXIII). Consider now the results with the Berkeley feature model (Appendix, Tables XXXIV, XXXV and XXXVI). This appears to be a simpler problem, possibly due to having a relatively small number of products and attributes, with all combinations of encoding and approach to optimisation always returned some valid products. However, only the 1+n approach (all three encodings) always returned only valid products (V R = 100%). For the 1+n approach there appears to be relatively little difference in the different encodings. In contrast, if we use the (n+1) approach then the novel encoding outperforms the core encoding and this, in turn, outperforms the direct encoding. Table XXXVII in the Appendix gives the results of the post-hoc Kruskal-Wallis test and effect size for the EMO algorithms when using the novel encoding and 1+n approach. Similar to Berkeley, the results with Drupal (Appendix, Tables XXXVIII, XXXIX and XL) suggest that this is a simpler search problem. With the 1+n approach, all combinations of encoding and algorithm always returned a population of valid solutions. For the (n+1) approach we find a more varied performance. We again found that the novel encoding outperformed the core encoding and this outperformed the direct encoding. We find that MOEA/D-TCH only returned valid solutions in one of the 30 executions. With the novel encoding and 1+n approach IBEA had the highest HV value. Table XLI in the Appendix gives the results of the post-hoc Kruskal-Wallis test and effect sizes for the EMO algorithms when using the novel encoding and 1+n approach. For ERS (Appendix, Tables XLII, XLIII and XLIV) we find that the 1+n approach always returned only valid products when using either the novel or core encoding. For all algorithms, when using the 1+n approach we find that the novel encoding produced higher HV values than the core encoding. For the novel encoding and 1+n approach we ACM Transactions on Software Engineering and Methodology, Vol. V, No. N, Article A, Pub. date: January YYYY.
A:20
R. M. Hierons et al. Table XIII. Drupal, real attributes, 50,000 evaluations, direct encoding Algorithm NSGA-II IBEA MOEA/D-WS MOEA/D-TCH MOEA/D-PBI SPEA2+SDE
(n+1) approach HV VN (/30) 0.000002 30 0.122192 30 0.081417 30 0.037675 7 0.085339 30 0.100164 30
VR 2.60% 41.13% 19.12% 1.62% 19.37% 9.57%
1+n approach HV VN (/30) 0.074917 30 0.123803 30 0.116287 30 0.117087 30 0.013610 29 0.131757 30
VR 100% 100% 100% 100% 100% 100%
Table XIV. Drupal, real attributes, 50,000 evaluations, core encoding Algorithm NSGA-II IBEA MOEA/D-WS MOEA/D-TCH MOEA/D-PBI SPEA2+SDE
(n+1) approach HV VN (/30) 0.000565 30 0.129126 30 0.100438 30 0.061993 30 0.096058 30 0.113642 30
VR 3.82% 62.47% 26.89% 17.52% 24.25% 18.27%
1+n approach HV VN (/30) 0.074595 30 0.122216 30 0.117124 30 0.113405 30 0.010170 30 0.134213 30
VR 100% 100% 100% 100% 100% 100%
Table XV. Drupal, real attributes, 50,000 evaluations, novel encoding Algorithm NSGA-II IBEA MOEA/D-WS MOEA/D-TCH MOEA/D-PBI SPEA2+SDE
(n+1) approach HV VN (/30) 0.015450 30 0.128167 30 0.103297 30 0.095600 30 0.106123 30 0.118850 30
VR 6.92% 80.13% 36.05% 23.89% 35.40% 32.73%
1+n approach HV VN (/30) 0.076093 30 0.129285 30 0.117130 30 0.119054 30 0.055917 30 0.134299 30
VR 100% 100% 100% 100% 100% 100%
find that NSGA-II had the highest HV value. This is in contrast to previous work in which NSGA-II was found to perform poorly and also with the direct encoding where we use the (n+1) approach; in this case NSGA-II also performed poorly. For the (n+1) approach, the novel encoding was most effective and the direct encoding the least effective. Table XLV in the Appendix gives the results of the post-hoc Kruskal-Wallis test and the effect sizes for the EMO algorithms when using the novel encoding and 1+n approach. 5.3. Experiments with realistic attributes
As previously explained, we performed experiments with the Amazon and Drupal case studies using eight attributes for which we either had real attribute values or we had ranges from which we could generate values. The results for Drupal can be found in Tables XIII-XV in which the 1+n approach always returned only valid products. For all three encodings, when we used the 1+n approach we found that SPEA2+SDE returned the highest HV value. As before, the novel encoding produced slightly better results than the core encoding (slightly higher HV values). Table XVI gives the results of the post-hoc Kruskal-Wallis test and the effect size values for the EMO algorithms when using the novel encoding and 1+n approach. For the Amazon model (Tables XVII-XIX) we again found that the results were good for the combination of the novel encoding and the 1+n approach. However, in this case one technique (MOEA/D-PBI) performed poorly. Previous work has showed that there are circumstances under which MOEA/D-PBI performs poorly, an example being when there is an irregular or degenerate Pareto front [Deb and Jain 2014; Li et al. 2014a]. In addition, IBEA only returned valid solutions in 17 of the 30 executions. For this combination of approach and encoding we have that SPEA2+SDE produced the highest ACM Transactions on Software Engineering and Methodology, Vol. V, No. N, Article A, Pub. date: January YYYY.
SIP: Optimal Product Selection from Feature Models using Many-Objective Evolutionary OptimisationA:21 Table XVI. Drupal, real attributes, 50,000 evaluations, novel encoding: statistical tests SPEA2+SDE MOEA/D-PBI MOEA/D-TCH MOEA/D-WS IBEA
NSGA-II 0.000/0.8589 0.491/0.8226 0.000/0.8589 0.210/0.8589 0.000/0.8589
IBEA 0.417/0.8474 0.000/0.8589 0.229/0.8589 0.000/0.8589
MOEA/D-WS 0.000/0.8589 0.000/0.8589 0.926/0.7196
MOEA/D-TCH 0.000/0.8589 0.000/0.8589
MOEA/D-PBI 0.000/0.8589
Table XVII. Amazon, realistic attributes, 50,000 evaluations, direct encoding Algorithm NSGA-II IBEA MOEA/D-WS MOEA/D-TCH MOEA/D-PBI SPEA2+SDE
(n+1) approach HV VN (/30) VR 0.000000 0 0% 0.000000 0 0% 0.000375 1 1.67% 0.000000 0 0% 0.000000 0 0% 0.000000 0 0%
1+n approach HV VN (/30) 0.001023 30 0.001328 1 0.000926 22 0.000000 0 0.000000 0 0.000935 27
VR 100% 100% 100% 0% 0% 100%
Table XVIII. Amazon, realistic attributes, 50,000 evaluations, core encoding Algorithm NSGA-II IBEA MOEA/D-WS MOEA/D-TCH MOEA/D-PBI SPEA2+SDE
(n+1) approach HV VN (/30) VR 0.000000 0 0% 0.000000 0 0% 0.000126 1 1.72% 0.000000 0 0% 0.000000 0 0% 0.000000 0 0%
1+n approach HV VN (/30) 0.000976 30 0.000000 0 0.000954 23 0.000000 0 0.000000 0 0.001125 29
VR 100% 0% 100% 0% 0% 100%
HV value. All other combinations or encoding/approach led to quite poor performance and it is particularly notable that IBEA did not produce any valid products for the (n+1) approach (irrespective of the encoding). The most likely explanation for this is that for this problem we had eight objectives, rather than five, and the Amazon model is larger than the other model (Drupal) for which we used eight objectives. Table XX gives the results of the post-hoc Kruskal-Wallis test and the effect sizes for the EMO algorithms when using the novel encoding and 1+n approach. 5.4. Experiments with a larger feature model
This subsection contains the result of the experiments performed with a larger randomly generated feature model. As previously stated, for this we used five objectives and applied three different encodings (direct, core and novel) and the two different approaches ((n+1) vs. 1+n). Interestingly, none of the experiments with the direct and core encodings returned valid products (and so we do not include tables for these experiments). The results of the experiments with the novel encoding are given in Table XXI. The results reinforce some of the previous observations but there are larger differences for this model. The key observation is that the choice of representation and approach appears to be crucial: we only obtained valid products when using the novel encoding and the 1+n approach. Amongst the techniques that return valid solutions (for the novel encoding and 1+n approach), SPEA2+SDE appears to have performed best since it returned valid products on almost all executions. However, it had a relatively low HV score suggesting that it returned less diverse populations. Both MOEA/D-PBI and MOEA/D-WS returned much higher HV values, indicating a more diverse population, but also found valid products less frequently. Table XXII gives the results of the posthoc Kruskal-Wallis test and the effect sizes for the EMO algorithms when using the novel encoding and 1+n approach. ACM Transactions on Software Engineering and Methodology, Vol. V, No. N, Article A, Pub. date: January YYYY.
A:22
R. M. Hierons et al. Table XIX. Amazon, realistic attributes, 50,000 evaluations, novel encoding Algorithm NSGA-II IBEA MOEA/D-WS MOEA/D-TCH MOEA/D-PBI SPEA2+SDE
(n+1) approach HV VN (/30) VR 0.000306 30 1.78% 0.000000 0 0% 0.001158 30 19.68% 0.000000 0 0% 0.001017 25 10.97% 0.000000 0 0%
1+n approach HV VN (/30) 0.001844 30 0.001897 17 0.001877 30 0.001688 30 0.000000 0 0.002001 30
VR 100% 100% 100% 100% 0% 100%
Table XX. Amazon, realistic attributes, 50,000 evaluations, novel encoding: statistical tests SPEA2+SDE MOEA/D-PBI MOEA/D-TCH MOEA/D-WS IBEA
NSGA-II 0.005/0.5536 0.000/0.9182 0.429/0.3235 0.000/0.5154 1.000/0.1773
IBEA 0.001/0.6718 0.000/0.8473 1.000/0.1744 0.000/0.4774
MOEA/D-WS 1.000/0.3513 0.000/0.9182 0.000/0.6060
MOEA/D-TCH 0.000/0.7693 0.000/0.9182
MOEA/D-PBI 0.000/0.9182
Table XXI. Random model, 50,000 evaluations, novel encoding Algorithm NSGA-II IBEA MOEA/D-WS MOEA/D-TCH MOEA/D-PBI SPEA2+SDE
(n+1) approach HV VN (/30) VR 0 0 0% 0 0 0% 0 0 0% 0 0 0% 0 0 0% 0 0 0%
1+n approach HV VN (/30) 0.014588 24 0.020762 25 0.042142 15 0.025037 19 0.042513 18 0.018173 28
VR 100% 100% 100% 100% 100% 100%
Finally, we considered the time taken by each method and evaluated this when using the model with 10,000 features. These values were averaged over 30 runs, with Table XXIII giving the execution time (50,000 evaluations). Interestingly, in all cases the 1+n approach took less time than the previously used approach (with the same encoding). Recall that Sayyad et al. and Henard et al. used the core encoding and the (n+1) approach. For all of the EMO algorithms, this combination (core encoding, (n+1) approach) is slower than the SIP method (novel encoding, 1+n approach). If we fix the overall combination of encoding and approach we find that in most cases SPEA2+SDE is the slowest EMO algorithm, IBEA is the second slowest, and the other four have similar performance. 6. DISCUSSION
We now explore the results and what they tell us about the research questions. 6.1. Research Question 1: The importance of the encoding
It is clear that the encoding does matter: the novel encoding consistently outperformed the direct encoding and also both the core and hierarchical encodings (where these were evaluated). This was both for the case where all objectives are considered together and the 1+n approach. Interestingly, the novel encoding significantly outperformed the core encoding in the experiments with Amazon with realistic attributes. The strongest result was with the larger randomly generated model, where the SIP method (using the novel encoding and the 1+n approach) was the only one that returned valid products. The results indicate that the encoding does affect performance, with the novel encoding proving to be most effective. ACM Transactions on Software Engineering and Methodology, Vol. V, No. N, Article A, Pub. date: January YYYY.
SIP: Optimal Product Selection from Feature Models using Many-Objective Evolutionary OptimisationA:23 Table XXII. Random model, 50,000 evaluations, novel encoding: statistical tests SPEA2+SDE MOEA/D-PBI MOEA/D-TCH MOEA/D-WS IBEA
NSGA-II 0.112/0.7962 0.000/0.7088 0.000/0.7135 0.000/0.6708 0.000/0.7746
IBEA 0.223/0.7476 0.001/0.7151 1.000/0.6500 0.003/0.6366
MOEA/D-WS 0.000/0.6908 1.000/0.0093 0.737/0.5575
MOEA/D-TCH 0.001/0.6157 0.414/0.6356
MOEA/D-PBI 0.000/0.7323
Table XXIII. Time taken in seconds, randomly generated model Encoding
Direct encoding
Core encoding
Novel encoding
EMO algorithm NSGA-II IBEA MOEA/D-WS MOEA/D-TCH MOEA/D-PBI SPEA2+SDE NSGA-II IBEA MOEA/D-WS MOEA/D-TCH MOEA/D-PBI SPEA2+SDE NSGA-II IBEA MOEA/D-WS MOEA/D-TCH MOEA/D-PBI SPEA2+SDE
(n+1) 132.326000 165.169000 148.954660 159.605793 164.638539 596.126000 105.831000 147.404000 136.588161 145.6549118 141.3576826 428.576000 101.760000 154.399000 135.978589 132.905541 131.915617 247.786000
1+n 131.444000 158.104000 142.332000 145.403000 150.022000 145.257000 103.188000 132.454000 115.169000 108.499000 112.164000 168.624000 98.758000 131.465000 104.442000 99.700000 102.999000 223.777000
6.2. Research Question 2: The value of using the 1+n approach
The results are also clear here: the 1+n approach consistently outperformed the (n+1) approach. If we consider all of the published feature models (i.e. not the randomly generated feature model) then we find that the 1+n approach with the novel encoding returned populations containing only valid products on all runs except when using Amazon with realistic attribute values. For this case (Amazon, realistic attribute values) the 1+n approach gave superior values for all of the measures (HV, VN, and VR) and returned only valid products on all executions except when using IBEA or MOEA/D-PBI. For the larger feature model, we only obtained valid products when we used the novel encoding and 1+n approach. The results suggest that the 1+n approach was more effective than the (n+1) approach. 6.3. Research Question 3: The relative performance of the EMO algorithms
An interesting initial observation is that there is no ‘clear winner’, in contrast to previous work that found IBEA to be superior to other techniques. One possible explanation for this is our use of a range of EMO algorithms that are not based on Pareto dominance. However, there is a second explanation which is that the best results were obtained with the novel encoding and the 1+n approach: this is not a representation or approach previously used. Since the novel encoding with the 1+n approach consistently gave the best performance, we focus on the most effective EMO algorithm when using this combination. Since the software engineer is only interested in valid products, we compared first on the basis of the VN score, then on VR (if two or more had the best VN), and finally on the HV values (if two or more had the best VN and VR). A high HV value is preferred, since it means that the obtained valid product set has a good combined performance of convergence and diversity. Table XXIV gives the best performing EMO algorithms ACM Transactions on Software Engineering and Methodology, Vol. V, No. N, Article A, Pub. date: January YYYY.
A:24
R. M. Hierons et al. Table XXIV. Best performing EMO algorithm, novel encoding and 1+n Subject model E-Shop 50,000 E-Shop 500,000 WebPortal Amazon Berkeley Drupal ERS Drupal, real Amazon, realistic Larger model
Best performing MOEA MOEA/D-TCH MOEA/D-WS IBEA SPEA2+SDE SPEA2+SDE IBEA NSGA-II SPEA2+SDE SPEA2+SDE SPEA2+SDE
Superior to all except MOEA/D-WS, MOEA/D-PBI MOEA/D-TCH MOEA/D-PBI NSGA-II, IBEA, MOEA/D-WS, MOEA/D-TCH IBEA MOEA/D-PBI SPEA2+SDE, MOEA/D-TCH, MOEA/D-WS IBEA MOEA/D-WS NSGA-II, IBEA
for the experiments using the novel encoding and 1+n approach. For each model, the second column gives the best performing EMO algorithm and the third column gives the other EMO algorithms where the differences in HV values were not statistically significant. It is interesting to observe that SPEA2+SDE was the most effective EMO algorithm for the three experimental subjects that proved to be most challenging for search (Drupal and Amazon with realistic attribute values and the larger randomly generated model). It is also worth noting that IBEA typically had high values for VR. This is consistent with the fact that IBEA prefers boundary solutions of the problem (i.e., the products having the optimal value of some objectives). The main point is that there is no clear ‘best’ EMO algorithm. In fact, in contrast to earlier work, there is one subject for which NSGA-II outperforms all others. While in many cases SPEA2+SDE provided the best performance, experiments found this to be the slowest technique and any differences in performance may well be negated by this factor. Note that one would expect the best performing algorithm to depend on the nature of the given product selection optimisation problem. For example, SPEA2+SDE has been found to perform well with problems in which convergence is difficult, such as those with a large number of objectives. Thus, it might be a good choice if the software engineer has a particularly large feature model or there is a large number of objectives. The three MOEA/D algorithms are suitable for problems in which it is hard to find a set of widely-distributed valid products. IBEA is a good choice for the decision maker who is more interested in the boundary solutions (i.e., the products having extreme value of one or several objectives) of the problem. 6.4. Research Question 4: The effect of using realistic attribute values
The results for this were quite similar, in that the novel encoding and the 1+n approach both led to improvements in performance. In particular, for the Drupal model, which has real attribute values, the SIP method always returned a population that contained only valid products. Interestingly, for the Amazon model we found that IBEA was ineffective when we use the (n+1) approach: it returned no valid products. The performance of IBEA was also poor with the 1+n approach: in only one run of the direct and core encodings did it return valid products, though it did return valid products in 17 out of 30 runs with the novel encoding. The overall results for the Amazon model were also much poorer with realistic attributes than with randomly generated attributes. This might indicate that the nature of ‘real’ models is a little different from randomly generated models but there is an alternative explanation, which is that the differences were caused by moving from five to eight objectives. This is consistent with previous work that has found that the time taken depends more on the number of objectives than the number of features [Olaechea et al. 2014]. Observe that for the Amazon model the results for the ‘unenhanced’ approach of Sayyad et al. and Henard ACM Transactions on Software Engineering and Methodology, Vol. V, No. N, Article A, Pub. date: January YYYY.
SIP: Optimal Product Selection from Feature Models using Many-Objective Evolutionary OptimisationA:25
et al. ((n+1) approach, core encoding, without using seeding or specialised replacement and mutation operators) were very poor: only on two runs of the EMO algorithms was a valid product returned. This is in contrast with the SIP method, where several EMO algorithms (including NSGA-II) returned valid products on all runs. Observe that we did not tune the EMO algorithms used. Tuning can significantly affect performance and so there is potential, for example, for some other methods to work with the randomly generated model if tuned. However, the lack of tuning can be seen as a strength since the SIP method was effective without tuning. 6.5. Research Question 5: The larger model
The results with the larger randomly generated model were consistent with those with other models but were much more extreme. We only obtained valid products when we used both the novel encoding and the 1+n approach but all of the EMO algorithms were effective with this combination. Interestingly, even NSGA-II was effective with this combination, returning valid products in 24 of the 30 runs. This is in contrast to the results with previous work, in which NSGA-II performs poorly. 6.6. Research Question 6: Number of valid products returned
Here we are interested in the VR values as well as the number of searches that returned at least one valid product. Again, we find that the SIP method outperforms the alternatives. It is particularly noticeable that the 1+n approach always had a value of 100% if at least one valid product was returned. However, this is not too surprising since the 1+n approach will consider a valid product to be superior to all invalid products: once a valid product has been found a search might generate variants of it and any of these that are valid are likely to be retained. Once a valid product has been found it might act a little like a seed in the approach of Sayyad et al. [Sayyad et al. 2013c] but with the additional benefit that any valid product found is prioritised over all invalid approaches. When using the (n+1) approach with a given EMO algorithm, in almost all cases the novel encoding led to a higher VR value than the core encoding and this, in turn, led to a higher VR value than the direct encoding. 6.7. Research Question 7: Time taken
If we compare algorithms (for fixed encoding and approach) we find that in most cases SPEA2+SDE is the slowest and IBEA the next slowest. When comparing NSGA-II and the variants of MOEA/D the pattern varies with the exception that NSGA-II is always fastest. However, the differences between NSGA-II and the variants of MOEA/D were relatively small when using the SIP method. Interestingly, the SIP method is always faster than the (n+1) approach with either the direct encoding or the core encoding. Recall that Sayyad et al. [Sayyad et al. 2013c]. and Henard et al. [Henard et al. 2015] used the core encoding and the (n+1) approach. In addition, the ‘enhanced’ versions previously devised, that proved to be effective, either required an additional phase to generate a seed [Sayyad et al. 2013c] or used more complicated replacement and mutation operators based on a SAT solver [Henard et al. 2015]. Note that for a feature model, the execution time of the EMO algorithms heavily depends on the number of features. For the larger feature model, the execution time of an algorithm was at least 100 seconds in most cases (as shown in XXIII). In contrast, for the other feature models, which have far fewer features, the algorithms took much less time. For example, for the E-shop model with 50,000 evaluations, the execution of NSGA-II with the SIP method required less than 2.5 seconds. ACM Transactions on Software Engineering and Methodology, Vol. V, No. N, Article A, Pub. date: January YYYY.
A:26
R. M. Hierons et al.
6.8. Summary
The results of the experiments suggest that the choice of encoding and approach have more impact on performance than the choice of EMO algorithm. This effect is particularly noticeable for the larger randomly generated model, where only with the novel encoding and 1+n approach were valid products returned; with this combination some EMO algorithms returned valid products in most searches. The results with the Amazon feature model, when using realistic attribute values, were also poorer and it is unclear whether this is a result of using realistic values for attributes or simply having more objectives. It is interesting to observe that for both of these models we have that the results using the ‘unenhanced’ approach of Sayyad et al. [Sayyad et al. 2013c] and Henard et al. [Henard et al. 2015] (core encoding, (n+1) approach) were extremely poor. Thus, the experiments have replicated the results of Sayyad et al. [Sayyad et al. 2013c] and Henard et al. [Henard et al. 2015], which show that their ‘unenhanced’ approach can perform poorly. However, we have avoided the need to introduce an additional initial search (as used by Sayyad et al. [Sayyad et al. 2013c]) or additional, more complicated, forms of replacement and mutation based on a SAT solver (as used by Henard et al. [Henard et al. 2015]) and have shown that instead we can obtain good performance by using the novel encoding and the 1+n approach. The final observation is that the running time is less for the SIP method than with the ‘unenhanced’ approach of Sayyad et al. [Sayyad et al. 2013c] and Henard et al. [Henard et al. 2015].
7. THREATS TO VALIDITY
This section briefly reviews the threats to validity in the experimental study and how these were reduced. We consider threats to internal validity, construct validity, and external validity. Threats to internal validity concern any factors that might introduce bias. One possible source of bias is the tool used to perform the experiments and so we used publicly available code developed by others and thoroughly tested this. The testing process involved testing individual components, a review being carried out by another author (who did not write the code), and by performing some initial experiments. We used the same settings as Sayyad et al. and Henard et al. for the previously used EMO algorithms and for the other algorithms we used values that have been recommended in previous studies. Since the optimisation methods used are stochastic, we also averaged results over 30 runs in order to reduce the impact of chance. In the calculation of HV, the choice of the reference point may introduce bias. Since the problem’s range is available, we set the reference point to the Nadir point of the problem’s range (the point constructed with the worst value on each objective). This is a commonly-used setting and can provide a comprehensive assessment of the solution set’s performance in terms of both convergence and diversity. In addition, when a solution set involves seven or more objectives, it is often infeasible to precisely measure its HV value. Here, we estimated the HV of such a solution set by using the Monte Carlo sampling method proposed by Bader and Zitzler, with 10,000,000 sampling points being used to ensure the accuracy of the HV results [Bader and Zitzler 2011]. Threats to construct validity reflect the possibility that the measurement process did not reflect the properties that are of interest in practice. We focussed on the generation of valid products since an invalid product should be of no value (it is a product that cannot be produced). The five objectives used in most of the experiments are those used in the previous studies of Sayyad et al. and Henard et al. It is possible that the use of a different set of objectives would lead to different results and this is something that might be studied in future work. ACM Transactions on Software Engineering and Methodology, Vol. V, No. N, Article A, Pub. date: January YYYY.
SIP: Optimal Product Selection from Feature Models using Many-Objective Evolutionary OptimisationA:27
Finally, threats to external validity relate to the degree to which we can generalise from the experiments. This is almost always a problem in Software Engineering research since the population is not known and there is no way of performing uniform sampling from this population. We reduced the effect of this by using feature models that were previously considered in the literature and adding two additional feature models. In addition, previous work has randomly generated values for the attributes: we did not have to do this for the two new feature models (we had access to either real values or ranges of values from which values could be produced). We also used a larger, randomly generated, feature model. EMO algorithms involve a number of configuration parameters, such as crossover and mutation rate, population size, and the number of evaluations (or generations). Parameter tuning is an important issue and can significantly affect the performance of search algorithms. However, tuning often takes much longer than running the algorithms [Olaechea et al. 2014]. Despite using recommended values from the literature, the considered EMO algorithms could be further improved by careful turning, especially when increasing the population size and the number of evaluations (this is already shown in the E-shop instance). The fact that the SIP method works well without tuning is promising.
8. RELATED WORK 8.1. Single-objective optimisation
Initial work in the area of product selection used single-objective optimisation and we start by describing these approaches. White et al. [White et al. 2009; White et al. 2008] proposed a polynomial time approximation algorithm, called Filtered Cartesian Flattening (FCF), for the selection of a highly optimal feature set that adheres to global resource constraints, e.g. budget. FCF transforms an optimal feature selection problem into an equivalent Multidimensional Multiple-choice Knapsack Problem (MMKP), which is then solved using an MMKP approximation algorithm. The evaluation results showed that FCF can generate approximate solutions for feature models with up to 10,000 features in seconds. More recently, Guo et al. [Guo et al. 2011] used a genetic algorithm named GAFES to tackle the same problem. As a part of their algorithm, they used a repair operator to transform invalid products into valid ones, after crossover. GAFES uses a single objective approach by aggregating various weighted objectives into a single fitness function. They reported that GAFES outperforms the FCF algorithm on synthetically generated feature models. ¨ Muller [Muller 2011] proposed a Simulated Annealing algorithm for the selection of products to be built from an SPL. The search was guided using a single objective function to maximise the profit as a fixed trade-off between generated revenue and incurred cost. Wang and Pang [Wang and Pang 2014] presented an Ant Colony Optimisation algorithm for optimal product selection in SPLs and compared it to the Filtered Cartesian Flattening algorithm of White et al. [White et al. 2009; White et al. 2008] and the GAFES genetic algorithm of Guo et al. [Guo et al. 2011]. Experiments were conducted using randomly generated feature models with up to 1,000 features. They concluded that their proposal offers a modest compromise between both approaches in terms of solution quality and performance. The disadvantage of these approaches, with respect to many-objective optimisation, is that a single-objective search either uses less information about the features or combines objectives to form one value and so imposes a weighting on the objectives. ACM Transactions on Software Engineering and Methodology, Vol. V, No. N, Article A, Pub. date: January YYYY.
A:28
R. M. Hierons et al.
8.2. Many-objective optimisation
Sayyad et al. [Sayyad et al. 2013b; Sayyad et al. 2013a; Sayyad et al. 2013d] compared seven different EMO algorithms for optimal product selection in SPLs. The experiments aimed to optimise five objectives on two feature models with up to 290 features and synthetically generated attributes. The authors concluded that the IBEA algorithm outperforms other widely used algorithms such as NSGA-II. In subsequent works [Sayyad et al. 2013c; Sayyad 2014], Sayyad et al. presented several heuristics to improve the performance of many-objective SPL optimal product selection, two of which were to remove core and dead features from the input feature model and plant a valid solution like a seed in the initial population. These heuristics were evaluated on 7 feature models with up to 6,888 features from the Linux Variability Analysis Tools (LVAT) repository9 . Our work differs from the above since we propose a purely searchbased method and avoid the need for a potentially expensive initial step that devises a seed (this took approximately three hours for the Linux Kernel feature model in Sayyad’s work). Sayyad et al. introduced two additional enhancements: the PUSH method and the PULL method [Sayyad 2014]. In the PUSH method, the mutation operator is adapted so that it cannot be applied in certain circumstances in which it would be guaranteed to lead to an invalid product (e.g. deleting a parent but not its children). The motivation for the PUSH method is similar to our motivation for the novel encoding. However, by adapting the encoding, rather than the mutation operator, we ensure that no candidate solutions fail certain constraints. In the PULL method, the number of constraint violations is given a weight of 4 (the other four objectives have a weight of 1) [Sayyad 2014]. The motivation for the PULL method is the same as our motivation for the 1+n approach: the software engineer is only interested in valid products and so the number of constraint violations is the most important objective. However, our approach is rather different: we first consider the number of constraints that fail and only after this do we consider the other objectives. As a result, we avoid the need to set a value for a weight and we also have an approach that works with a wide range of EMO algorithms including algorithms that are not based on Pareto dominance (e.g. IBEA and MOEA/D). The degree to which EMO algorithms are affected by weights varies and so the PULL technique would have to be adapted for different algorithms. Another advantage of the 1+n approach is that the computational cost is reduced. Sayyad found that the combination of the PUSH and PULL methods worked well for smaller models but performed poorly when applied to the Linux kernel model. Cruz et al. [Cruz et al. 2013] proposed using many-objective optimisation for the generation of SPL product portfolios. For the evaluation of their work, they used the NSGA-II algorithm for the selection of products minimising cost and maximising user relevance on a library management case study with 23 features and 4 attributes per feature. In contrast, this work presents a thorough comparison of enhanced EMO algorithms for optimal product selection in SPLs using a variety of feature models and multiple objectives. Some authors have addressed the problem of optimal product selection using constraint programming techniques [Benavides et al. 2005; Karatas et al. 2013; Li et al. 2012; Siegmund et al. 2012]. These methods are able to find exact solutions for small models but exhibit exponential time complexity and poor scalability. Guo et al. [Guo et al. 2014] proposed using parallel computation to find exact optimal products in SPLs more quickly. However, the results suggest that it would still take days to obtain valid solutions for a feature model with 290 features and 7 objectives. Compared to their 9 https://code.google.com/p/linux-variability-analysis-tools/
ACM Transactions on Software Engineering and Methodology, Vol. V, No. N, Article A, Pub. date: January YYYY.
SIP: Optimal Product Selection from Feature Models using Many-Objective Evolutionary OptimisationA:29
work, this paper addresses the problem of finding approximate optimal products in a reasonable time, even in large scale problems. In [Olaechea et al. 2014], the authors compared an incremental exact algorithm named GIA with an approximate approach using IBEA on 5 feature models with up to 290 features and 7 objectives. Four of these models were used in the research reported in this paper (EShop, WebPortal, ERS, and Berkeley). They concluded that GIA can produce optimal solutions in less than 2 hours for small SPLs with up to 44 features meanwhile IBEA can produce approximate solutions with an average of at least 42% accuracy in less than 20 minutes for SPLs with up to 290 features. Furthermore, the authors found that IBEA is highly sensitive to its parameter settings (such as the mutation rate, population size and evaluation number) which suggest that substantial effort may be required to find the best parameter values for acceptable approximation. This implies that it may be possible to improve the performance of the EMO algorithms considered in our study. A finely tuned parameter setting (despite the high cost) could lead to a further performance improvement of the EMO algorithms, especially with respect to the population size and the number of evaluations. Henard et al. [Henard et al. 2015] enhanced the first approach of Sayyard et al. [Sayyad et al. 2013d] by using the core encoding and also a SAT solver to implement new mutation and replacement operators used in an EMO algorithm. This removed the need to produce a seed but it did introduce more complicated mutation and replacement operators and the need to set the values of additional parameters that state how often these new operators are used. The results were promising, with valid products being returned for the examples, with up to 6,888 features, used by Sayyard et al. [Sayyad et al. 2013c]. Henard et al. thus showed that it is not necessary to seed the search. However, their method did require the use of additional parameters and there is potential for the use of these operators to slow down the search. Although the authors did not state exactly how long it took to apply their new operators, they did say that this took less than six seconds, suggesting that the use of these operators should be limited. Compared to their work, the 1+n approach does not require sophisticated, computationally more expensive, replacement and mutation operators. Note that for the model with 10,000 features, the 1+n approach was able to find valid products in a search that took, on average, less than four minutes. Henard et al. and Sayyad et al. gave their search 30 minutes. Tan et al. proposed a novel feedback-directed mechanism to improve the results of EMO algorithms for optimal product selection in SPLs [Tan et al. 2015]. In particular, the authors proposed to use the number of constraints violated during the search as feedback to guide the mutation and crossover operators. The essential idea is that it is desirable to change the parts of a chromosome that are involved in violated constraints. For example, such genes were given a higher mutation rate than those that are not involved in constraint violation. Core and dead features were also automatically removed from the model using a SAT solver. The method was integrated into four different EMO algorithms and evaluated with six feature models including the Linux kernel model (6,888 features). As in the works of Sayyad et al. and Hernan et al., searches were performed with five objectives and randomly generated attribute values. The results showed that the proposed method was effective in generating substantially more correct products than unguided EMO algorithms in less time. However, their approach was unable to generate valid products for the Linux kernel feature model. To overcome this limitation, they resorted to the seeding strategy proposed by Sayyad et al. [Sayyad et al. 2013c]. Both methods combined generated 50% of valid solutions for the Linux feature model in four seconds. The seed was generated using the IBEA algorithm and their feedback-directed method with two objectives in about 40 seconds. The approach taken has similarities to that of Henard et al., in that they focus on adapting ACM Transactions on Software Engineering and Methodology, Vol. V, No. N, Article A, Pub. date: January YYYY.
A:30
R. M. Hierons et al.
the variation operators used by the EMO algorithm (mutation and crossover). It thus differs significantly from the SIP method, where the focus is on the encoding and the 1+n approach. The focus of the enhancements is on stopping mutation and crossover from converting valid products into invalid products but valid product might still be removed by selection. In contrast, the 1+n approach ensures that valid products can only be removed by selection if all products in the population are valid. It would therefore be interesting to see whether further benefits can be obtained by combining the enhancements in Tan et al.’s method with those in the SIP method. Search-based techniques have been extensively used in other SPL development phases such as architectural design and testing. For a detailed survey on the use of search-based techniques in SPLs we redirect the reader to [Harman et al. 2014; LopezHerrejon et al. 2015]. It is interesting to note that previous approaches have focussed on three important aspects of EMO algorithms: initialisation of the population (seeding), individual encoding, and variation (crossover). The 1+n approach appears to be the first piece of work that aims to tackle the fourth important component of an EMO algorithm: selection. Finally, we may remark that this is the first work on optimal SPL product selection reporting results with realistic attributes rather than synthetically generated values, which provide more helpful insights on the effectiveness of EMO algorithms. Furthermore, note that it is straightforward to introduce the 1+n approach into an EMO algorithm and it should be possible to use it with most, if not all, EMO algorithms. It is also noteworthy that the enhancements used in our work are tangential to those introduced by previous approaches and so it should be possible to combine these enhancements with those previously devised including the feedback-directed approach of Tan et al. 9. CONCLUSIONS
A feature model describes the set of valid products in a software product line. Previous work explored the use of evolutionary many-objective optimisation (EMO) algorithms in choosing optimal products from a feature model. This work found that such methods did not scale and introduced two approaches that addressed this: Sayyad et al. [Sayyad et al. 2013d; Sayyad et al. 2013c] used an initial search to find a valid product with which to seed the search and Henard et al. [Henard et al. 2015] introduced new replacement and mutation operators based on a SAT solver. This paper took a different approach, which is to find ways of directly enhancing the search. We had two main enhancements. The first was a new representation that enforces a number of the constraints in a feature model. As a result of this encoding, all elements of the search space satisfy the enforced constraints, potentially making it easier to find valid products. The second enhancement was to introduce the 1+n approach in which EMO algorithms first optimise on the number of constraints that fail and only then on the other objectives. The motivation for the second enhancement was that invalid products are of no value to the software engineer. This led to the SIP method that used the novel encoding and the 1+n approach. We carried out experiments to evaluate several combinations: two approaches (the (n+1) approach in which all objectives are considered to be equal or using the 1+n approach); and three encodings (the direct encoding, the core encoding introduced by Sayyad et al. [Sayyad et al. 2013c] and also used by Henard et al., or the proposed novel encoding). The experimental subjects were previously used feature models, two new feature models (Amazon and Drupal), and a larger (10,000 feature) randomly generated feature model. Previous work has used randomly generated attributes but for Amazon and Drupal we had realistic attribute values. For the Drupal model the attribute values were obtained by repository mining while for the Amazon model we had ACM Transactions on Software Engineering and Methodology, Vol. V, No. N, Article A, Pub. date: January YYYY.
SIP: Optimal Product Selection from Feature Models using Many-Objective Evolutionary OptimisationA:31
real attributes and constraints on these (we randomly generated values that satisfied the constraints). The results of the experiments were promising, with the SIP method always outperforming the other combinations. In contrast to previous work, there was no clear pattern when comparing the different EMO algorithms and even the Pareto-based approach, NSGA-II, was often effective. Instead, the results suggest that the overall approach has much more impact than the choice of EMO algorithm. When using the SIP method, almost all experiments returned populations that contained only valid products. The main exception was the larger randomly generated model, where every EMO algorithm had some searches that failed to find valid products. Note, however, that several EMO algorithms returned valid products in the majority of experiments with this combination. In addition, for this larger model the only experiments that returned valid products were those that used the SIP method. Thus, these experiments provide evidence that the SIP method leads to several EMO algorithms scaling to larger feature models. There are several lines of future work. First, Henard et al. [Henard et al. 2015] and Tan et al. [Tan et al. 2015] introduced novel mutation and replacement operators that use a SAT solver; it would be interesting to see whether these would further improve the SIP method. It should also be possible to further enhance our representation so that additional constraints are enforced. The experiments fixed the number of evaluations used and it would be interesting to see whether the results change significantly if one instead fixes the time taken. However, the SIP method (novel encoding and 1+n approach) was found to be faster than the previously proposed method (core encoding and (n+1) approach) and so this would not affect the overall conclusions. The results were poorer with the models with realistic attribute values and we require additional studies to determine whether this is a result of the values used (and so randomly generated values are not representative) or the number of objectives. If the former is the case then it would be interesting to explore the characteristics of attribute values for real models. There might also be value in using multiple techniques and forming a final set of products from the resultant populations. Finally, it would be interesting to evaluate the methods on additional examples and, in particular, on other feature models. Acknowledgements
We would like to thank the referees for their many helpful suggestions. This work has been partially supported by the European Commission (FEDER) and Spanish Government under CICYT project TAPAS (TIN2012-32273) and BELI (TIN2015-70560-R), and the Andalusian Government projects THEOS (TIC-5906) and COPAS (P12-TIC1867). REFERENCES Anne Auger, Johannes Bader, Dimo Brockhoff, and Eckart Zitzler. 2009. Theory of the Hypervolume Indicator: Optimal µ-Distributions and the Choice Of The Reference Point. In Proceedings of the 10th ACM SIGEVO workshop on Foundations of Genetic Algorithms (FOGA). 87–102. Johannes Bader and Eckart Zitzler. 2011. HypE: An algorithm for fast hypervolume-based many-objective optimization. Evolutionary Computation 19, 1 (2011), 45–76. Don Batory, David Benavides, and Antonio Ruiz-Cort´es. 2006. Automated Analysis of Feature Models: Challenges Ahead. Commun. ACM December (2006), 45–47. DOI:http://dx.doi.org/10.1145/1183236.1183264 David Benavides, Sergio Segura, and Antonio Ruiz-Cort´es. 2010. Automated analysis of feature models 20 years later: A literature review. Information Systems 35, 6 (2010), 615 – 636. DOI:http://dx.doi.org/10.1016/j.is.2010.01.001
ACM Transactions on Software Engineering and Methodology, Vol. V, No. N, Article A, Pub. date: January YYYY.
A:32
R. M. Hierons et al.
David Benavides, Sergio Segura, Pablo Trinidad, and Antonio Ruiz-Cort´es. 2007. FAMA: Tooling a Framework for the Automated Analysis of Feature Models. In Proceeding of the First International Workshop on Variability Modelling of Software-intensive Systems (VAMOS). 129–134. David Benavides, Pablo Trinidad, and Antonio Ruiz-Cort´es. 2005. Automated Reasoning on Feature Models. In Advanced Information Systems Engineering. Lecture Notes in Computer Science, Vol. 3520. Springer Berlin Heidelberg, 491–503. DOI:http://dx.doi.org/10.1007/11431855 34 Paul Clements and Linda Northrop. 2001. Software Product Lines: Practices and Patterns. Addison–Wesley. Jonathas Cruz, Pedro Santos Neto, Ricardo Britto, Ricardo Rabelo, Werney Ayala, Thiago Soares, and Mauricio Mota. 2013. Toward a hybrid approach to generate Software Product Line portfolios. In Evolutionary Computation (CEC), 2013 IEEE Congress on. 2229–2236. DOI:http://dx.doi.org/10.1109/CEC.2013.6557834 Kalyanmoy Deb. 2001. Multi-Objective Optimization Using Evolutionary Algorithms. John Wiley, New York. Kalyanmoy Deb and Himanshu Jain. 2014. An Evolutionary Many-Objective Optimization Algorithm Using Reference-Point-Based Nondominated Sorting Approach, Part I: Solving Problems With Box Constraints. IEEE Transactions on Evolutionary Computation 18, 4 (2014), 577–601. Kalyanmoy Deb, Amrit Pratap, Sameer Agarwal, and T. Meyarivan. 2002. A fast and elitist multiobjective genetic algorithm: NSGA-II. IEEE Transactions on Evolutionary Computation 6, 2 (2002), 182–197. Juan J. Durillo, Antonio J. Nebro, Francisco Luna, and Enrique Alba. 2009. On the Effect of the SteadyState Selection Scheme in Multi-Objective Genetic Algorithms. In Proceedings of the Fifth International Conference on Evolutionary Multi-Criterion Optimization, (EMO 2009). Nantes, France, 183–197. Naeem Esfahani, Sam Malek, and Kaveh Razavi. 2013. GuideArch: Guiding the Exploration of Architectural Solution Space Under Uncertainty. In Proceedings of the 2013 International Conference on Software Engineering (ICSE ’13). IEEE Press, Piscataway, NJ, USA, 43–52. http://dl.acm.org/citation.cfm?id= 2486788.2486795 Tobias Friedrich, Christian Horoba, and Frank Neumann. 2009. Multiplicative Approximations and the Hypervolume Indicator. In Proceedings of the 11th Annual Conference on Genetic and Evolutionary Computation Conference (GECCO). 571–578. ´ Garc´ıa-Galan, ´ Pablo Trinidad, Omer F. Rana, and Antonio Ruiz-Cort´es. 2015. Automated configuJesus ration support for infrastructure migration to the cloud. Future Generation Computer Systems (2015). DOI:http://dx.doi.org/10.1016/j.future.2015.03.006 Jianmei Guo, Jules White, Guangxin Wang, Jian Li, and Yinglin Wang. 2011. A genetic algorithm for optimized feature selection with resource constraints in software product lines. Journal of Systems and Software 84, 12 (2011), 2208 – 2221. DOI:http://dx.doi.org/10.1016/j.jss.2011.06.026 Jianmei Guo, Edward Zulkoski, Rafael Olaechea, Derek Rayside, Krzysztof Czarnecki, Sven Apel, and Joanne M. Atlee. 2014. Scaling Exact Multi-objective Combinatorial Optimization by Parallelization. In Proceedings of the 29th ACM/IEEE International Conference on Automated Software Engineering (ASE ’14). ACM, New York, NY, USA, 409–420. DOI:http://dx.doi.org/10.1145/2642937.2642971 David Hadka and Patrick Reed. 2012. Diagnostic assessment of search controls and failure modes in manyobjective evolutionary optimization. Evolutionary Computation 20, 3 (2012), 423–452. Mark Harman, Yue Jia, Jens Krinke, Bill Langdon, Justyna Petke, and Yuanyuan Zhang. 2014. Search Based Software Engineering for Software Product Line Engineering: A Survey and Directions for Future Work. In Proceedings of the 18th International Software Product Line Conference - Volume 1 (SPLC ’14). ACM, New York, NY, USA, 5–18. DOI:http://dx.doi.org/10.1145/2648511.2648513 Christopher Henard, Mike Papdakis, Mark Harman, and Yves Le Traon. 2015. Combining Multi-Objective Search and Constraint Solving for Configuring Large Software product Lines. In Proceedings of the 2015 International Conference on Software Engineering (ICSE ’15). IEEE Press. Peter Hofman, Tobias Stenzel, Thomas Pohley, Michael Kircher, and Andreas Bermann. 2012. Domain Specific Feature Modeling for Software Product Lines. In Proceedings of the 16th International Software Product Line Conference - Volume 1 (SPLC ’12). ACM, New York, NY, USA, 229–238. DOI:http://dx.doi.org/10.1145/2362536.2362568 Hisao Ishibuchi, Naoya Akedo, and Yusuke Nojima. 2015. Behavior of Multi-Objective Evolutionary Algorithms on Many-Objective Knapsack Problems. IEEE Transactions on Evolutionary Computation 19, 2 (2015), 264–283. Hisao Ishibuchi, Noritaka Tsukamoto, and Yusuke Nojima. 2008. Evolutionary many-objective optimization: A short review. In Proceedings of the IEEE Congress on Evolutionary Computation (CEC). 2419–2426. Kyo C. Kang, Sholom Cohen, James Hess, William Novak, and Spencer Peterson. 1990. Feature–Oriented Domain Analysis (FODA) Feasibility Study. Technical Report CMU/SEI-90-TR-21. SEI. ¨ un, ¨ Ahmet Serkan Karatas, Halit Oguztuz and Ali Dogru. 2013. From extended feature models to constraint logic programming. Science of Computer Programming 78, 12 (2013), 2295 – 2312.
ACM Transactions on Software Engineering and Methodology, Vol. V, No. N, Article A, Pub. date: January YYYY.
SIP: Optimal Product Selection from Feature Models using Many-Objective Evolutionary OptimisationA:33 DOI:http://dx.doi.org/10.1016/j.scico.2012.06.004 Special Section on International Software Product Line Conference 2010 and Fundamentals of Software Engineering (selected papers of {FSEN} 2011). Sean Quan Lau. 2006. Domain Analysis of E-Commerce Systems Using Feature-Based Model Templates. Master’s thesis. University of Waterloo, Waterloo. Bingdong Li, Jinlong Li, Ke Tang, and Xin Yao. 2014. An improved Two Archive Algorithm for ManyObjective optimization. In IEEE Congress on Evolutionary Computation (CEC). IEEE, 2869–2876. Jian Li, Xijuan Liu, Yinglin Wang, and Jianmei Guo. 2012. Formalizing Feature Selection Problem in Software Product Lines Using 0-1 Programming. In Practical Applications of Intelligent Systems, Yinglin Wang and Tianrui Li (Eds.). Advances in Intelligent and Soft Computing, Vol. 124. Springer Berlin Heidelberg, 459–465. DOI:http://dx.doi.org/10.1007/978-3-642-25658-5 55 Miqing Li, Shengxiang. Yang, and Xiaohui Liu. 2014a. Shift-based density estimation for Pareto-based algorithms in many-objective optimization. IEEE Transactions on Evolutionary Computation 18, 3 (2014), 348–365. Miqing Li, Shengxiang Yang, and Xiaohui Liu. 2014b. A Test Problem for Visual Investigation of HighDimensional Multi-Objective Search. In Proceedings of the IEEE Congress on Evolutionary Computation (CEC). 2140–2147. Miqing Li, Shengxiang Yang, Xiaohui Liu, and Ruimin Shen. 2013. A Comparative Study on Evolutionary Algorithms for Many-Objective Optimization. In Proceedings of the 7th International Conference on Evolutionary Multi-Criterion Optimization (EMO). 261–275. Roberto E. Lopez-Herrejon, Lukas Linsbauer, and Alexander Egyed. 2015. A systematic mapping study of search-based software engineering for software product lines. Information and Software Technology 61, 0 (2015), 33 – 51. DOI:http://dx.doi.org/10.1016/j.infsof.2015.01.008 Shinsuke Matsumoto, Yasutaka Kamei, Akito Monden, Ken-ichi Matsumoto, and Masahide Nakamura. 2010. An analysis of developer metrics for fault prediction. In Proceedings of the 6th International Conference on Predictive Models in Software Engineering, PROMISE 2010. ACM, 18. Yoshihiro Matsumoto. 2007. A Guide for Management and Financial Controls of Product Lines. In 11th International Software Product Line Conference. 162–170. Marcilio Mendonca, Thiago Tonelli Bartolomei, and Donald Cowan. 2008. Decision-making Coordination in Collaborative Product Configuration. In Proceedings of the 2008 ACM Symposium on Applied Computing (SAC ’08). ACM, New York, NY, USA, 108–113. DOI:http://dx.doi.org/10.1145/1363686.1363715 Marcilio Mendonca, Moises Branco, and Donald Cowan. 2009. S.P.L.O.T.: Software Product Lines Online Tools. In Companion to the 24th ACM SIGPLAN International Conference on Object-Oriented Programming, Systems, Languages, and Applications (OOPSLA). ACM, Orlando, Florida, USA, 761–762. DOI:http://dx.doi.org/10.1145/1639950.1640002 Johannes Muller. 2011. Value-Based Portfolio Optimization for Software Product Lines. In Software Product Line Conference (SPLC), 2011 15th International. 15–24. DOI:http://dx.doi.org/10.1109/SPLC.2011.18 Rafael Olaechea, Derek Rayside, Jianmei Guo, and Krzysztof Czarnecki. 2014. Comparison of Exact and Approximate Multi-objective Optimization for Software Product Lines. In Proceedings of the 18th International Software Product Line Conference - Volume 1 (SPLC ’14). ACM, New York, NY, USA, 92–101. DOI:http://dx.doi.org/10.1145/2648511.2648521 Abdel Salam Sayyad. 2014. Evolutionary Search Techniques with Strong Heuristics for Multi-Objective Feature Selection in Software Product Lines. Ph.D. Dissertation. West Virginia University. Abdel Salam Sayyad, Katerina Goseva-Popstojanova, Tim Menzies, and Hany Ammar. 2013a. On Parameter Tuning in Search Based Software Engineering: A Replicated Empirical Study. In Proceedings of the 2013 3rd International Workshop on Replication in Empirical Software Engineering Research (RESER ’13). IEEE Computer Society, Washington, DC, USA, 84–90. DOI:http://dx.doi.org/10.1109/RESER.2013.6 Abdel Salam Sayyad, Joseph Ingram, Tim Menzies, and Hany Ammar. 2013b. Optimum feature selection in software product lines: Let your model and values guide your search. In Combining Modelling and Search-Based Software Engineering (CMSBSE), 2013 1st International Workshop on. 22–27. DOI:http://dx.doi.org/10.1109/CMSBSE.2013.6604432 Abdel Salam Sayyad, Joseph Ingram, Tim Menzies, and Hany Ammar. 2013c. Scalable product line configuration: A straw to break the camel’s back. In Automated Software Engineering (ASE), 2013 IEEE/ACM 28th International Conference on. 465–474. DOI:http://dx.doi.org/10.1109/ASE.2013.6693104 Abdel Salam Sayyad, Tim Menzies, and Hany Ammar. 2013d. On the Value of User Preferences in Searchbased Software Engineering: A Case Study in Software Product Lines. In Proceedings of the 2013 International Conference on Software Engineering (ICSE ’13). IEEE Press, Piscataway, NJ, USA, 492–501. http://dl.acm.org/citation.cfm?id=2486788.2486853 David C. Sharp. 1998. Reducing avionics software cost through component based product line development. In 17th Digital Avionics Systems Conference. IEEE.
ACM Transactions on Software Engineering and Methodology, Vol. V, No. N, Article A, Pub. date: January YYYY.
A:34
R. M. Hierons et al.
¨ ¨ Norbert Siegmund, Marko Rosenmuller, Martin Kuhlemann, Christian Kastner, Sven Apel, and Gunter Saake. 2012. SPL Conqueror: Toward optimization of non-functional properties in software product lines. Software Quality Journal 20, 3-4 (2012), 487–517. DOI:http://dx.doi.org/10.1007/s11219-011-9152-9 ´ Ana B. Sanchez, Sergio Segura, Jos´e A. Parejo, and Antonio Ruiz-Cort´es. 2015. Variability testing in the wild: the Drupal case study. Software & Systems Modeling (2015), 1–22. DOI:http://dx.doi.org/10.1007/s10270-015-0459-z Tian Huat Tan, Yinxing Xue, Manman Chen, Jun Sun, Yang Liu, and Jin Song Dong. 2015. Optimizing Selection of Competing Features via Feedback-directed Evolutionary Algorithms. In Proceedings of the 2015 International Symposium on Software Testing and Analysis (ISSTA 2015). ACM, New York, NY, USA, 246–256. DOI:http://dx.doi.org/10.1145/2771783.2771808 ¨ Thomas Thum, Don Batory, and Christian Kastner. 2009. Reasoning About Edits to Feature Models. In Proceedings of the 31st International Conference on Software Engineering (ICSE ’09). IEEE Computer Society, Washington, DC, USA, 254–264. DOI:http://dx.doi.org/10.1109/ICSE.2009.5070526 ¨ ¨ Thomas Thum, Christian Kastner, Fabian Benduhn, Jens Meinicke, Gunter Saake, and Thomas Leich. 2014. FeatureIDE: An extensible framework for feature-oriented software development. Science of Computer Programming 79, 0 (2014), 70 – 85. DOI:http://dx.doi.org/10.1016/j.scico.2012.06.002 Experimental Software and Toolkits (EST 4): A special issue of the Workshop on Academic Software Development Tools and Techniques (WASDeTT-3 2010). Pablo Trinidad, David Benavides, Antonio Ruiz-Cort´es, Sergio Segura, and Alberto Jimenez. 2008. FAMA Framework. In 12th Software Product Lines Conference (SPLC). 359. DOI:http://dx.doi.org/10.1109/SPLC.2008.50 Tobias Wagner, Nicola Beume, and Boris Naujoks. 2007. Pareto-, Aggregation-, and Indicator-Based Methods in Many-Objective Optimization. In Proceedings of the 4th International Conference on Evolutionary Multi-Criterion Optimization (EMO). 742–756. Ying-lin Wang and Jin-wei Pang. 2014. Ant colony optimization for feature selection in software product lines. Journal of Shanghai Jiaotong University (Science) 19, 1 (2014), 50–58. DOI:http://dx.doi.org/10.1007/s12204-013-1468-0 Jules White, Brian Dougherty, and Douglas C. Schmidt. 2009. Selecting Highly Optimal Architectural Feature Sets with Filtered Cartesian Flattening. J. Syst. Softw. 82, 8 (Aug. 2009), 1268–1284. DOI:http://dx.doi.org/10.1016/j.jss.2009.02.011 Jules White, Brian Doughtery, and Douglas C. Schmidt. 2008. Filtered Cartesian Flattening: An Approximation Technique for Optimally Selecting Features while Adhering to Resource Constraints. In Software Product Lines, 12th International Conference, SPLC 2008, Limerick, Ireland, September 8-12, 2008, Proceedings. Second Volume (Workshops). 209–216. Shengxiang Yang, Miqing Li, Xiaohui Liu, and Jinhua Zheng. 2013. A Grid-Based Evolutionary Algorithm for Many-Objective Optimization. IEEE Transactions on Evolutionary Computation 17, 5 (2013), 721– 736. Shin Yoo and Mark Harman. 2012. Regression testing minimization, selection and prioritization: a survey. Softwware Testing, Verification and Reliability 22, 2 (2012), 67–120. Qingfu Zhang and Hui Li. 2007. MOEA/D: A multiobjective evolutionary algorithm based on decomposition. IEEE Transactions on Evolutionary Computation 11, 6 (2007), 712–731. ¨ Eckart Zitzler and Simon Kunzli. 2004. Indicator-Based Selection in Multiobjective Search. In Proceedings of the International Conference on Parallel Problem Solving from Nature (PPSN). 832–842. Eckart Zitzler, Marco Laumanns, and Lothar Thiele. 2002. SPEA2: Improving the strength Pareto evolutionary algorithm for multiobjective optimization. In Evolutionary Methods for Design, Optimisation and Control. Barcelona, Spain, 95–100. Eckart Zitzler and Lothar Thiele. 1999. Multiobjective evolutionary algorithms: A comparative case study and the strength Pareto approach. IEEE Transactions on Evolutionary Computation 3, 4 (1999), 257– 271.
Appendix
ACM Transactions on Software Engineering and Methodology, Vol. V, No. N, Article A, Pub. date: January YYYY.
SIP: Optimal Product Selection from Feature Models using Many-Objective Evolutionary OptimisationA:35 Table XXV. E-Shop, 500,000 evaluations, direct encoding Algorithm NSGA-II IBEA MOEA/D-WS MOEA/D-TCH MOEA/D-PBI SPEA2+SDE
(n+1) approach HV VN (/30) 0.000031 30 0.209585 3 0.068365 30 0.000000 0 0.066717 17 0.000000 0
VR 1.53% 31.63% 19.38% 0.00% 26.60% 0.00%
1+n approach HV VN (/30) 0.114196 15 0.145794 19 0.212465 4 0.200243 2 0.182576 6 0.163580 17
VR 100% 100% 100% 100% 100% 100%
Table XXVI. E-Shop, 500,000 evaluations, hierarchical encoding Algorithm NSGA-II IBEA MOEA/D-WS MOEA/D-TCH MOEA/D-PBI SPEA2+SDE
(n+1) approach HV VN (/30) 0.000165 30 0.262434 6 0.089034 30 0.000000 0 0.074348 2 0.000000 0
VR 3.13% 34.86% 26.43% 0.00% 27.34% 0.00%
1+n approach HV VN (/30) 0.227710 3 0.229755 5 0.212465 4 0.200243 2 0.182576 6 0.163580 17
VR 100% 100% 100% 100% 100% 100%
Table XXVII. E-Shop, 500,000 evaluations, core encoding Algorithm NSGA-II IBEA MOEA/D-WS MOEA/D-TCH MOEA/D-PBI SPEA2+SDE
(n+1) approach HV VN (/30) 0.000157 30 0.290457 30 0.114511 30 0.000000 0 0.112882 30 0.139973 1
VR 3.00% 32.51% 24.91% 0.00% 30.27% 1.00%
1+n approach HV VN (/30) 0.183741 30 0.202537 30 0.243644 30 0.218663 30 0.148149 30 0.175895 30
VR 100% 100% 100% 100% 100% 100%
Table XXVIII. E-Shop, 500,000 evaluations, novel encoding Algorithm NSGA-II IBEA MOEA/D-WS MOEA/D-TCH MOEA/D-PBI SPEA2+SDE
(n+1) approach HV VN (/30) 0.000522 30 0.297780 30 0.262634 30 0.165437 25 0.249707 30 0.237403 30
VR 4.31% 81.10% 45.66% 17.16% 55.57% 19.47%
1+n approach HV VN (/30) 0.209032 30 0.234368 30 0.255900 30 0.252809 30 0.229405 30 0.194677 30
VR 100% 100% 100% 100% 100% 100%
Table XXIX. E-shop, 500,000 evaluations, novel encoding: statistical tests SPEA2+SDE MOEA/D-PBI MOEA/D-TCH MOEA/D-WS IBEA
NSGA-II 0.531/0.7959 0.039/0.8302 0.000/0.8589 0.000/0.8589 0.002/0.8589
IBEA 0.000/0.8589 1.000/0.3359 0.006/0.8379 0.000/0.8589
MOEA/D-WS 0.000/0.8589 0.000/0.8322 1.000/0.2996
MOEA/D-TCH 0.000/0.8589 0.000/0.8131
MOEA/D-PBI 0.000/0.8589
Table XXX. Amazon, 50,000 evaluations, direct encoding Algorithm NSGA-II IBEA MOEA/D-WS MOEA/D-TCH MOEA/D-PBI SPEA2+SDE
(n+1) approach HV VN (/30) 0.000000 0 0.144944 30 0.119316 1 0.000000 0 0.107419 2 0.116526 2
VR 0.00% 8.11% 5.56% 0.00% 8.81% 1.00%
1+n approach HV VN (/30) 0.129914 28 0.132120 22 0.112178 22 0.109089 14 0.106987 7 0.128739 25
VR 100% 100% 100% 100% 100% 100%
ACM Transactions on Software Engineering and Methodology, Vol. V, No. N, Article A, Pub. date: January YYYY.
A:36
R. M. Hierons et al. Table XXXI. Amazon, 50,000 evaluations, core encoding Algorithm NSGA-II IBEA MOEA/D-WS MOEA/D-TCH MOEA/D-PBI SPEA2+SDE
(n+1) approach HV VN (/30) 0.000000 0 0.151427 30 0.127254 2 0.099013 1 0.107979 9 0.115566 8
VR 0.00% 12.58% 8.97% 2.38% 6.77% 1.00%
1+n approach HV VN (/30) 0.133433 26 0.134244 26 0.112202 21 0.109077 20 0.110211 7 0.131327 26
VR 100% 100% 100% 100% 100% 100%
Table XXXII. Amazon, 50,000 evaluations, novel encoding Algorithm NSGA-II IBEA MOEA/D-WS MOEA/D-TCH MOEA/D-PBI SPEA2+SDE
(n+1) approach HV VN (/30) 0.110013 30 0.163411 30 0.164305 30 0.118666 24 0.165420 30 0.126991 30
VR 1.89% 25.18% 32.26% 5.96% 32.32% 1.93%
1+n approach HV VN (/30) 0.160488 30 0.157962 30 0.158237 30 0.155518 30 0.140233 30 0.161408 30
VR 100% 100% 100% 100% 100% 100%
Table XXXIII. Amazon, 50,000 evaluations, novel encoding: statistical tests SPEA2+SDE MOEA/D-PBI MOEA/D-TCH MOEA/D-WS IBEA
NSGA-II 1.000/0.0191 0.000/0.8302 0.070/0.4428 1.000/0.0515 0.331/0.3359
IBEA 0.141/0.4848 0.000/0.8302 1.000/0.0687 1.000/0.2004
MOEA/D-WS 1.000/0.0363 0.000/0.6871 0.585/0.2520
MOEA/D-TCH 0.026/0.5191 0.000/0.7444
MOEA/D-PBI 0.000/0.8189
Table XXXIV. Berkeley, 50,000 evaluations, direct encoding Algorithm NSGA-II IBEA MOEA/D-WS MOEA/D-TCH MOEA/D-PBI SPEA2+SDE
(n+1) approach HV VN (/30) 0.091832 30 0.178069 30 0.156807 30 0.154944 30 0.155631 30 0.175910 30
VR 12.38% 38.02% 39.24% 18.75% 33.14% 20.17%
1+n approach HV VN (/30) 0.180725 30 0.180511 30 0.165982 30 0.177966 30 0.171807 30 0.181689 30
VR 100% 100% 100% 100% 100% 100%
Table XXXV. Berkeley, 50,000 evaluations, core encoding Algorithm NSGA-II IBEA MOEA/D-WS MOEA/D-TCH MOEA/D-PBI SPEA2+SDE
(n+1) approach HV VN (/30) 0.143163 30 0.178476 30 0.157743 30 0.164103 30 0.156345 30 0.179584 30
VR 22.47% 49.42% 45.63% 31.07% 40.85% 32.00%
1+n approach HV VN (/30) 0.180552 30 0.179754 30 0.166099 30 0.176773 30 0.170947 30 0.181689 30
VR 100% 100% 100% 100% 100% 100%
Table XXXVI. Berkeley, 50,000 evaluations, novel encoding Algorithm NSGA-II IBEA MOEA/D-WS MOEA/D-TCH MOEA/D-PBI SPEA2+SDE
(n+1) approach HV VN (/30) 0.176215 30 0.179804 30 0.160527 30 0.175297 30 0.162768 30 0.181372 30
VR 50.97% 99.74% 56.89% 76.25% 56.29% 49.00%
1+n approach HV VN (/30) 0.180645 30 0.180814 30 0.166096 30 0.177354 30 0.180148 30 0.181689 30
VR 100% 100% 100% 100% 100% 100%
ACM Transactions on Software Engineering and Methodology, Vol. V, No. N, Article A, Pub. date: January YYYY.
SIP: Optimal Product Selection from Feature Models using Many-Objective Evolutionary OptimisationA:37 Table XXXVII. Berkeley, 50,000 evaluations, novel encoding: statistical tests SPEA2+SDE MOEA/D-PBI MOEA/D-TCH MOEA/D-WS IBEA
NSGA-II 0.000/0.9182 1.000/0.4409 0.000/0.8589 0.000/0.8709 1.000/0.3535
IBEA 0.023/0.9194 0.095/0.6478 0.000/0.8599 0.000/0.8721
MOEA/D-WS 0.000/0.9329 0.000/0.8709 0.368/0.8709
MOEA/D-TCH 0.000/0.9182 0.037/0.8493
MOEA/D-PBI 0.000/0.9182
Table XXXVIII. Drupal, 50,000 evaluations, direct encoding Algorithm NSGA-II IBEA MOEA/D-WS MOEA/D-TCH MOEA/D-PBI SPEA2+SDE
(n+1) approach HV VN (/30) 0.000389 30 0.265727 30 0.043566 30 0.098523 1 0.048361 30 0.202298 30
VR 3.37% 54.19% 18.75% 2.04% 27.19% 12.93%
1+n approach HV VN (/30) 0.246052 30 0.276827 30 0.227422 30 0.265018 30 0.268241 30 0.265182 30
VR 100% 100% 100% 100% 100% 100%
Table XXXIX. Drupal, 50,000 evaluations, core encoding Algorithm NSGA-II IBEA MOEA/D-WS MOEA/D-TCH MOEA/D-PBI SPEA2+SDE
(n+1) approach HV VN (/30) 0.000860 30 0.275768 30 0.190881 30 0.169133 30 0.198277 30 0.244092 30
VR 4.61% 67.76% 28.65% 9.47% 38.79% 21.43%
1+n approach HV VN (/30) 0.254493 30 0.280267 30 0.232008 30 0.253550 30 0.254135 30 0.268569 30
VR 100% 100% 100% 100% 100% 100%
Table XL. Drupal, 50,000 evaluations, novel encoding Algorithm NSGA-II IBEA MOEA/D-WS MOEA/D-TCH MOEA/D-PBI SPEA2+SDE
(n+1) approach HV VN (/30) 0.129260 30 0.281322 30 0.227704 30 0.219116 30 0.227913 30 0.256962 30
VR 8.05% 93.63% 53.19% 31.34% 57.59% 43.30%
1+n approach HV VN (/30) 0.253853 30 0.280415 30 0.231898 30 0.262656 30 0.273876 30 0.269118 30
VR 100% 100% 100% 100% 100% 100%
Table XLI. Drupal, 50,000 evaluations, novel encoding: statistical tests SPEA2+SDE MOEA/D-PBI MOEA/D-TCH MOEA/D-WS IBEA
NSGA-II 0.000/0.8550 0.000/0.8589 0.201/0.8111 0.324/0.8589 0.000/0.8589
IBEA 0.000/0.8589 0.109/0.8474 0.000/0.8589 0.000/0.8589
MOEA/D-WS 0.000/0.8589 0.000/0.8589 0.000/0.8589
MOEA/D-TCH 0.640/0.6527 0.003/0.7787
MOEA/D-PBI 1.000/0.5669
Table XLII. ERS, 50,000 evaluations, direct encoding Algorithm NSGA-II IBEA MOEA/D-WS MOEA/D-TCH MOEA/D-PBI SPEA2+SDE
(n+1) approach HV VN (/30) 0.033958 1 0.070791 30 0.044121 13 0.000000 0 0.044723 17 0.347087 30
VR 1.03% 6.51% 6.16% 0.00% 6.66% 48.83%
1+n approach HV VN (/30) 0.079792 30 0.077870 30 0.078050 27 0.069301 30 0.038985 30 0.078671 30
VR 100% 100% 100% 100% 100% 100%
ACM Transactions on Software Engineering and Methodology, Vol. V, No. N, Article A, Pub. date: January YYYY.
A:38
R. M. Hierons et al.
Table XLIII. ERS, 50,000 evaluations, core encoding Algorithm NSGA-II IBEA MOEA/D-WS MOEA/D-TCH MOEA/D-PBI SPEA2+SDE
(n+1) approach HV VN (/30) 0.038090 26 0.075840 30 0.056119 30 0.030018 6 0.056045 30 0.045583 14
VR 1.07% 8.60% 10.86% 1.98% 10.80% 1.50%
1+n approach HV VN (/30) 0.082308 30 0.079331 30 0.082215 30 0.067155 30 0.039005 30 0.080126 30
VR 100% 100% 100% 100% 100% 100%
Table XLIV. ERS, 50,000 evaluations, novel encoding Algorithm NSGA-II IBEA MOEA/D-WS MOEA/D-TCH MOEA/D-PBI SPEA2+SDE
(n+1) approach HV VN (/30) 0.049091 30 0.080182 30 0.074869 30 0.043524 16 0.075265 30 0.075718 30
VR 2.05% 16.46% 20.39% 2.12% 20.28% 7.53%
1+n approach HV VN (/30) 0.082716 30 0.079453 30 0.082129 30 0.080916 30 0.040918 30 0.080945 30
VR 100% 100% 100% 100% 100% 100%
Table XLV. ERS, 50,000 evaluations, novel encoding: statistical tests SPEA2+SDE MOEA/D-PBI MOEA/D-TCH MOEA/D-WS IBEA
NSGA-II 0.029/0.4339 0.000/0.8661 0.028/0.4978 1.000/0.2949 0.000/0.7494
IBEA 0.183/0.4453 0.004/0.8642 0.192/0.4060 0.000/0.7508
MOEA/D-WS 0.494/0.4067 0.000/0.8634 0.473/0.3626
MOEA/D-TCH 1.000/0.0229 0.000/0.8634
MOEA/D-PBI 0.000/0.8634
ACM Transactions on Software Engineering and Methodology, Vol. V, No. N, Article A, Pub. date: January YYYY.