voltage stability consideration. An IEEE-6 bus test system is used to demonstrate the results. One of the modern power system analyzer MiPower software is ...
International Journal of Computer Applications (0975 – 8887) Volume 20– No.5, April 2011
Optimal Re-Scheduled Generation using Participation Factors J. Vara Prasad
K. Chandra Sekhar
P. S. Venkataramu
Asst. Professor Dept. of Electrical & Electronics GGITM, Bhopal, MP, India
Professor Dept. of Electrical & Electronics RVR&JC CE, Guntur, AP, India
Professor Dept. of Electrical & Electronics GGITM, Bhopal, MP, India
ABSTRACT The objective of power systems operation and planning in the interconnected power system is to maximize the social welfare through minimizing total generation costs. This paper presents a novel approach for optimal generation considering stability limits. The paper examines two approaches for optimal generation. The first approach is based on analyzing their shares in increased load on system. The second approach is based on voltage stability consideration. An IEEE-6 bus test system is used to demonstrate the results. One of the modern power system analyzer MiPower software is used to model and solve the optimization problems involved and the MATLAB software is used to perform graphical representations through an interface between both programs.
Keywords Generation shift factors, Participation factors, Re-Scheduling, Voltage instability.
1. INTRODUCTION Electric power today plays an exceedingly important role in the life of the community and in the development of various sectors of economy. In fact, the modern economy is totally dependent on the electricity as a basic input. This in turn has led to the increase in the number of power stations and their capacities and consequent increase in power transmission lines which connect the generating stations to the load centers. Interconnections between systems are also on the increase to enhance reliability and economy. The transmission voltage, while dependent on quantum of power transmitted, should fit in with the long-term system requirement as well as provide flexibility in system operation [1]. With the ever increasing per capita energy consumption and exponentially rising population, a social welfare plan is, therefore, necessary to ensure that energy supply to humanity at large is assured for a long time and at low economic cost. The objective of the economic dispatch problem of electric power generation, whose characteristics are complex and highly nonlinear, is to schedule the committed generating unit outputs so as to meet the required load demand at minimum operating cost while satisfying all units and system equality and inequality constraints [2]. While attaining optimized value of this objective by the power system operators, the operating limitations arise to them from the fact that the generating units, transmission lines and other regulating equipment, such as transformers, phase shifters, etc. cannot be loaded beyond their capacity. Further declared bus voltages should be maintained within an allowable range conforming to the statutory act.
Optimal load flow is achieved after solving a large number of load flow solutions corresponding to a set of specified values of consumer demand. In this process, the control variables are not stated singularly but their ranges of variation are specified according to the objective to be optimized [3]. This paper examines two approaches for optimal generation. The first approach is based on analyzing their shares in increased load on system. Using participation factors [4], it is easy to obtain new optimal generations for increased demand on the system. The second approach is based on voltage stability consideration. Generally, the voltage instability study provides information about lack of reactive power support to transfer large amount of energy through the transmission system. So, the optimal value of loading limit on the system without sacrificing system security limits is main focusing point in this paper. This paper organized as follows. Section 2 discusses the calculation of optimal re-scheduled generation using Participation Factors (PF) and with these generations, the congestion in transmission system was verified using Generation Shift Factors (GSF) [4]. Voltage instability study is outlined in Section 3. Section 4 presents the procedure for obtaining optimal loading limit on system. Studies on the IEEE 6-bus system to demonstrate the implementation of proposed algorithm are presented in Section 5.
2. OPTIMAL RE-SCHEDULED GENERATION As explained in [4], it is easy to calculate new optimal dispatch using participation factors and expected line loadings with those optimal generations in transmission system can be calculated using generation shift factors.
2.1 Participation Factors (PF) As the unit load is changed by an amount ∆Pi, the system incremental cost moves from λ0 to (λ0 +∆λ). For small change in power output on this single unit, Here is the second derivative of cost function. This is true for each of the NG units on the system, so that
The total change in generation or change in total system demand is equal to the sum of individual unit changes. Let P D be the total demand on the generation (where PD = PLoad + PLosses), then
29
International Journal of Computer Applications (0975 – 8887) Volume 20– No.5, April 2011 Using equations (2) & (4), the participation factor for each unit can be calculated as follows.
The new values of generation is calculated using
2.2 Generation Shift Factors (GSF) The approximate change in line flows for changes in generations on the network configuration can be derived from DC load flow. The generation shift factors are designated and here the following definition.
Here Δfi is the change in megawatt power flow on line l when a change in generation, ΔPi occurs at bus i. If any generation changes at generator i, the new power flow on any line in the network could be calculated using a pre-calculated set of „a‟ factor as follows:
3. VOLYAGE INSTABILITY STUDY The voltage stability problem with voltage collapse as its final consequence is an emerging phenomenon in planning and operation of modern power systems. The increase in utilization of existing power systems may get the system operating closer to voltage collapse. This possibility in association with several incidents throughout the world have given major impetus for analyzing the problem with increased interest in modeling of generation, transmission and distribution/load equipment of electric power systems. A large number of scientists and engineers have been attracted by the voltage stability problem. Their attention has resulted with a number of papers being published in magazines and conference proceedings. Extensive bibliography [5] treats the most referenced ones among them. Present trends in the field are certainly dominated by deregulated market conditions and transmission system open access. A challenge also appeared within operating grid issues related to a new FACTS technology. So it is worthwhile to evaluate optimal re-schedule generation for maximum allowable loading limit on system considering system operating conditions including voltage stability problem. To estimate this operating condition, we use MiPower Software [6]. L-Index method [7] had been used to determine ill condition with incremental load on a particular load bus.
Step 1: Run base case DC-OPF (DC Optimal Power Flow) for initial optimal generations. Step 2: Calculate participation factors for each generator. Step 3: Using participation factors, calculate new optimal generations for incremental demand. Step 4: Compute line loadings using generation shift factors. Step 5: Repeat step 3 & step 4 till any one of the line flow reaches to its maximum loading limit (Thermal loading). Step 6: Resolve the problem with incremental demand obtained in step 5 using DC-OPF for congestion relief. Step 7: verify whether this loading limit is under voltage stability constrained loading value or not. Step 8: If step 7 is not satisfied, decrease loading limit till the voltage stability condition fulfill. Step 9: Calculate maximum allowable load demand on system optimally.
5. RESULTS The proposed approach has been examined on IEEE-6 Bus system. One of the advanced modern power system software, MiPower has been used for simulation purpose. The price bid by generators of the system are given in table 1 where P is in MW and $ is a momentary unit which may be scaled by any arbitrary constant without affecting the results and P i min, Pi max are power generation limits of each generator. Detailed information of the system is found in MATPOWER [8]. The base load on the system was 210MW. The system production cost before rescheduling and after rescheduling is given in table 2. The significant reduction in production cost can be found after rescheduling of generations. Table 1. Bid prices of generator Generator
Bid price($/h) 2
Pmin
Pmax
1
213.1+11.669P1+0.00533 P1
50
200
2
200.0+10.333P2+0.00889 P22
37.5
150
3
2
45
180
240.0+10.833P3+0.00741 P3
Table 2. System production cost Before Re-Schedule Generator
Generation
Cost($/h)
1
100
1433.300
2
50
738.875
3
60
916.656
Generator
Generation
Cost($/h)
1
50.00
809.8750
2
88.07
1179.000
3
71.93
1057.600
Total Cost ($/h) 3087.831
After Re-Schedule Total Cost ($/h) 3046.41
4. EVALUATION OF OLC The proposed procedure to determine Optimal Loading Condition (OLC) of the system has been given below. The re-dispatch generations with incremental demand in system and their production costs are given in table 3. The incremental generations at each generator are calculated using Participation Factors (PF) as explained in Section 2A. For each incremental
demand, expected line loadings are calculated using Generation Shift Factors (GSF) as explained in section 2B. It can be observed that line 2-4 is loaded with 60.87MW at 40% increment demand. But its loading limit is 60MW only. By
30
International Journal of Computer Applications (0975 – 8887) Volume 20– No.5, April 2011 performing DC-OPF with 40% incremented demand, the congestion on line 2-4 has been relieved. The generations and system production cost with optimal re-schedule generation has been highlighted in table 4. The results of line loadings to optimal dispatch by participation factors and corrected solution for congestion relief with OPF have been given in Table 5. Table 3. System Production cost with incremented demand Incremented demand Generator
10%
20%
30%
40%
1
59.0562
68.1124
77.1687
86.2249
2
93.4997
98.9293
104.359
109.789
3
78.4441
84.9582
91.4724
4073.10
Cost ($/h)
3300.00
3555.70
3813.40
4073.10
6. CONCLUSION One of the challenging tasks of ISO is optimal load dispatch. This task can also be solved using cost free technique redispatch. In this paper, participation factors are proposed to determine the maximum loading limit on the system with the objective of minimization of production cost without compromising system security. The congestion problem in the network is identified with generation shift factors and redispatch schedule was obtained for its alleviation with DC-OPF. MiPower software results of voltage instability studies at different load buses validate this approach in real time applications. The proposed method has been implemented on IEEE 6 bus system. Without facing congestion problem in this present competitive power market, this method gives the easiest way to evaluate maximum available market power with redispatch generations.
7. ACKNOWLEDGMENTS Table 4. Optimal Re-Scheduled generation OPF at 40% Incremented demand Gen 1
Gen 2
Gen 3
Production cost ($/h)
88.17
105.05
100.79
4074.10
The authors wish to thank the Management of GGITM, Bhopal for their constant encouragement to this work and the students of Electrical & Electronics Engineering department Deepali Mishra, Priyanka Mahoviya, Reena Singh for their simulation work using MiPower Software.
8. REFERENCES Table 5. Congestion relief at 40% loading condition
1-2
Line limit (MW) 40
Actual flow (MW) 11.10
Re-Scheduled flow (MW) 12.21
1-4
60
41.54
42.21
1-5
40
33.58
33.75
2-3
40
-0.02
-1.23
2-4
60
60.87
60.00
2-5
30
26.18
25.61
2-6
90
33.86
32.87
3-5
70
30.22
30.73
3-6
80
67.75
68.82
4-5
20
4.41
4.21
5-6
40
-3.61
-3.70
Line
So, it can be concluded that the maximum allowable loading on system for trading by DISCOs is equal to 294MW (1.4×base case load). Comparison between productions at different cases is shown in Figure 1. MiPower software has been used to identify the voltage instability at all load buses. This study has been performed to identify further possible incremental load at a particular bus without sacrificing system voltage stability criterion. It can be observed from simultaneous voltage instability studies at bus 4, 5 & 6 (Figures. 2, 3 & 4), early more than 90MW demand on system causes to voltage drop by 0.95 p.u. So by considering line loading limits and under voltage limit, we can conclude maximum load demand is limited to nearly 85MW as obtained by proposed method.
[1] “Power System Optimization”, D.P.Kothari., J.S.Dhillon. Prentice – Hall of India Private Limited, New Delhi. 2004. [2] “Power System Analysis” Hadi Saadat., Tata – McGrawHill., New Delhi. 2002 [3] “Computer Aided Power System Operation and Analysis”, R.N.Dhar., [4] “Power Generation, Operation, and Control”, Allen J. Wood and Bruce F. Woollenberg., Wiley India (P.) Ltd., New Delhi. 2010 [5] Ajjarapu V., Lee B., “Bibliography on Voltage Stability” IEEE Trans. Power systems, Vol.13, no 1; February 1998, pp.115-125. [6] MiPower Software”, Power Research & Development Consultancy Private Limited., Banglore., India. Consultancy Private Limited., Banglore., India. [7] Makasa, K.J.; Venayagamoorthy, G.K.; “Estimation of Voltage Stability Index in a Power System with Plug-in Electric Vehicles”, Bulk Power System Dynamics and Control (iREP) - VIII (iREP), 2010 iREP Symposium, Issue Date: 1-6 Aug. 2010; On page(s): 1 – 7. [8] “MATPOWER 4.0b4” PSERC. Ray D. Zimmerman, May 21, 2010.
31
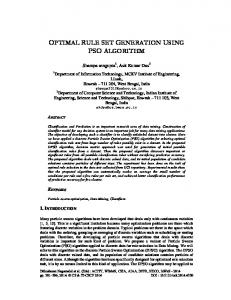
International Journal of Computer Applications (0975 – 8887) Volume 20– No.5, April 2011 Generations at different case studies 120 Gen1 Gen2 Gen3
Generations (MW)
100
80
60
40
20
Fig 3: Voltage instability study at bus 5. 0
Base case
40% Load Increment
Resheduled Generations
Fig 1: Comparison between generations.
Fig 4: Voltage instability study at bus 6.
Fig 2: Voltage instability study at bus 4.
32