Smart Machines – Neural Evolution - September 2012 - Banff, AB, Canada
Optimal Sampling for Identifying Models for FES Control of Neuroprostheses Schearer EM1, Liao Y1, Perreault EJ2,3, Tresch MC2,3, Lynch KM1,4 1. Department of Mechanical Engineering, Northwestern University, Evanston, IL, United States 2. Department of Biomedical Engineering, Northwestern University, Evanston, IL, United States 3. Department of Physical Medicine and Rehabilitation, Northwerstern University, Evanston, IL, United States 4. Northwestern Institute on Complex Systems, Northwestern University, Evanston, IL, United States
Abstract A major challenge in controlling multiple-input multiple output functional electrical stimulation systems is the large amount of time required to identify a workable system model due to the high dimensionality of the space of inputs. To address this challenge we are exploring optimal methods to sample the input space. In this paper we present two methods for optimally sampling a nine-dimensional input space of muscle stimulations that control the endpoint force of a human arm with implanted FES electrodes. One method maximizes the information about the nine individual muscle models, and the second method minimizes the average covariance of the predicted output force. We compared these methods to two previously-used methods in simulation. The simulation model was identified from data collected during experiments with a human subject with a high spinal cord injury who has surgically implanted FES electrodes. Using the optimal sampling methods required 10-30% fewer system identification data points than the previously-used methods to achieve a given level of model prediction accuracy.
Introduction Functional electrical stimulation (FES) is a strategy to restore limb movements in persons with paralysis. Many tasks, such as reaching motions of the arm, require using multiple muscles. A model of the relationship between the stimulation inputs of the muscles and the resulting forces or motions of the arm identified for each specific human subject is critical in designing controllers for these tasks. Densely sampling the input space for FES tasks requiring coordination of multiple muscles is infeasible. The input space typically includes the stimulation inputs to the muscles. Experiments with FES in human subjects are often limited by time and human fatigue. Multi-muscle tasks can require identifying recruitment curves, muscle dynamics, and skeletal dynamics. Each addition of complexity adds extra dimensions of the FES system to explore. To save time and effort in experiments and to decrease errors in control tasks we are examining optimal methods to sample the input space as an alternative to dense sampling. Our current focus is on choosing the optimal inputs to identify a model that maps muscle stimulation inputs to the steady-state isometric force measured at the end of a human arm controlled by FES. Our model includes a recruitment curve for each muscle and linearly combines the muscle forces to produce a predicted endpoint force. Methods for identifying recruitment curves have been previously studied [1]. The simplest and most used method is the steady-state step response method [1]. For the steady-state step response method, a constant input, usually a stimulation amplitude or pulse width, is applied, and the output is averaged after it reaches steady state. Inputs are selected evenly over the domain of possible inputs. When ample experiment time exists the recruitment curve can be sampled at many input levels several times each to estimate the mean and variance of the force output at each input level. Optimal sampling methods, also known as optimal experiment designs, are well-studied for functions that are similar to those used to model
recruitment curves [2]. Some examples include psychometric functions in two-alternative forced-choice experiments, dose-response curves for medicines, and reliability curves in engineering. We previously studied optimal methods to sample the recruitment curve for a single muscle [3]. We now address the problem of how to sample the inputs of a multiple-input multiple-output FES system. In this case, we not only determine what input to apply to a single muscle, but what muscle should be stimulated out of several possible muscles. With multiple muscles, some muscles may be sampled more than others depending on how important each muscle is in producing the desired outputs. In this paper we apply two well-known methods from optimal experiment design [4] to the problem of sampling muscle inputs to identify a model for endpoint force control and compare them to two previously-used sampling methods. We compare the methods in a simulation based on a model identified for a human subject with a high spinal cord injury. The first optimal method minimizes the variance of the parameters of the recruitment curve model for each muscle by choosing inputs that maximize information about the parameters. The second optimal method minimizes the average covariance of the predicted endpoint force output. The first previously-used method evenly samples the input domain for each muscle. The second previously-used method [5] bisects adjacent pairs of previous inputs for each muscle. Each subsequent input is the mean of the pair of adjacent previous inputs with the largest difference in output. Because we are motivated by limited experiment time for identifying human FES systems, the goal of this study is to determine if the optimal sampling methods require fewer data points than previously-used methods require to identify a model that makes output predictions with a given level of accuracy.
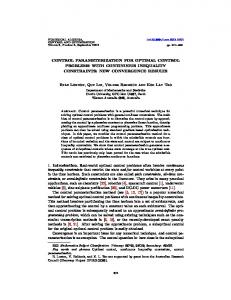
Materials and Methods FES System The simulation model used in this study is based off of previously conducted experiments [6]. The setup for the previous experiments is pictured in Fig. 1. The subject sustained a hemisection of the spinal cord at the C1-C2 level. The subject has nine stimulation electrodes surgically implanted into her shoulder complex and arm. This includes intramuscular electrodes that stimulate the subject’s upper pectoralis, lower pectoralis, and rhomboids and nerve cuff electrodes that stimulate the subject’s radial nerve, musculocutaneous nerve, long thoracic nerve, suprascapular nerve, axillary nerve, and thoracodorsal nerve. We refer to a muscle unit as either an individual muscle or a group of muscles that contract when a specific nerve is stimulated. The subject’s forearm was attached to a fixed force/torque sensor. We previously identified a model mapping the stimulation pulse widths of the nine electrodes to the force measured at the sensor attached to the subject’s forearm. Input/output data was gathered to identify the model by stimulating each muscle at various pulse width levels with a constant current amplitude and measuring the resulting force. 1/4
Smart Machines – Neural Evolution - September 2012 - Banff, AB, Canada
Model to Identify The goal is to pick the muscle stimulation inputs to identify the model that gives us the best predictions of the endpoint force output. The model mapping the stimulation inputs of the muscles to the steady-state isometric endpoint force measured at the hand consists of a recruitment curve for each muscle and a linear transformation from the outputs of the recruitment curves to the endpoint force of the arm. We model the recruitment curves with a sigmoid function,
where u is the input, typically a stimulation pulse width or amplitude, g is the force output of the muscle, a is the maximum output of the sigmoid function, b is proportional to the slope of the sigmoid function at 50% of the maximum output, and c is the input at which the sigmoid function outputs 50% of its maximum output. The second term on the right-hand side is an offset term that forces the output to be zero when the input is zero. A linear mapping scales the muscle output force and points it in the direction of the endpoint force that results from stimulating the muscle. The endpoint force f, is
where g is the vector of muscle forces, and A is a matrix that scales and points the muscle forces. By doing experiments with a simulated FES system we identify the parameters in (1) and (2) for all the muscles. A single data point consists of applying one input to a single muscle and measuring the endpoint force output. Note that in our experiments we do not stimulate multiple muscles at the same time. A series of data points defines an experiment design. The size of an experiment design is the number of data points making up the design. By sampling the domain of the input u for each muscle, and measuring the resulting output f , we estimate the parameters, a, b, and c using maximum likelihood estimation (MLE) and the matrix A using linear regression. Having computed the best estimate of the parameters, we also estimate the endpoint force output f(u), and its covariance Σf(u)2, for any vector of muscle inputs, u.
Sampling Methods We use four experiment design methods for sampling the inputs to
estimate the parameters in (1) and (2). The first two methods, which we call even and bisection, do not explicitly optimize anything. The third and fourth methods, referred to as D-optimal and V-optimal in optimal experiment design literature [3], explicitly minimize objective functions. The even method samples the recruitment curve for each muscle at evenly-spaced levels in the domain of inputs. The entire even experiment design for all the muscles is determined before any experiment design sequence begins. We compute the MLE of the parameters after all data points of an even design are collected. The bisection method [4] first collects three data points for each muscle: one at a low input level, one at a middle input level, and one at a high input level. The difference in force output between the low and middle inputs and the difference in force output between middle and high inputs are compared. The pair of adjacent inputs with the largest output difference is bisected, meaning that the mean of those inputs becomes the input for the next data point. Each subsequent input is the mean of the adjacent previous inputs that have the largest difference in muscle force output. We compute the MLE of the parameters after all data points in a bisection design are collected. The D-optimal method determines the input for the next data point or vector of inputs for the next series of data points by solving
is the information matrix that depends both on the set of all where M previous data points U, and the candidate input for the next data point or vector of inputs for the next series of data points u, which is the variable over which to optimize. The D-optimal method maximizes the determinant of the information matrix of the parameters of each individual muscle model. It is equivalent to minimizing the variance/covariance ellipsoid of the model parameters. The D-optimal inputs are those inputs where the model parameters are most sensitive. We compute the D-optimal design for each of the individual muscle units, and each muscle unit has the same number of data points. The V-optimal method determines the input for the next data point or vector of inputs for the next series of data points by minimizing the determinant of the predicted covariance of the output Σf(u)2, integrated over the stimulation inputs that produce a set of desired outputs,
where P(u) is a probability distribution that weighs the predicted output covariance given a particular input vector of muscle stimulations. All inputs that produce the desired outputs are given equal weight, and all inputs that do not produce the desired outputs are given zero weight. For example, if several of the desired endpoint force targets require stimulating a muscle at 30% stimulation level, the covariance of the output when stimulating that muscle at 30% will receive a large weight in the optimization. If none of the desired endpoint force targets requires stimulating a muscle at 90% stimulation level, then the covariance of the output when stimulating that muscle at 90% will receive zero weight in the optimization. The V-optimal method determines the muscle unit and stimulation level for the next data point that will decrease output covariance the most. The V-optimal method minimizes the covariance of the entire multi-muscle system, whereas the other three methods focus on identifying individual muscle models. The even, bisection, and D-optimal methods use an equal number of experiments for each muscle, while the V-optimal method does not have this constraint. The V-optimal method could collect many data points for one muscle and fewer data points for another muscle depending on which muscle contributes the most covariance to the 2/4
Smart Machines – Neural Evolution - September 2012 - Banff, AB, Canada endpoint force predictions. Implementing the D-optimal and V-optimal designs requires prior knowledge of the model parameters. Because (1) is nonlinear in the parameters, its derivatives, which show up in the objective functions to be minimized, are functions of the parameters themselves. To determine the importance of having good prior estimates of the model parameters in computing optimal designs we compare estimates of endpoint force using two procedures to find the initial four experiment inputs for each muscle required to solve for the parameters of (1) and (2) and estimate the covariance of the output. The first initialization procedure assumes perfect knowledge of the real parameters by using the parameters of the simulation model. Using these parameters we solve (3) in the D-optimal method and (4) in the V-optimal method to find the first four inputs for each muscle. The second procedure assumes no knowledge of the parameters and uses the bisection method to determine the inputs for the first four data points for each muscle. Both the D-optimal and V-optimal designs are sequentially computed. After collecting the first four data points for each muscle we compute the MLE of the parameters and use these new parameters to solve (3) or (4) for the next input, collect the next data point, and compute new parameter estimates. Collection of all subsequent data points proceeds similarly.
Evaluating the Sampling Methods To test the relative ability of the four experiment design methods to reduce the number of data points needed to identify a model that predicts endpoint force outputs with a desired accuracy and variance we use a simulation model. The model structure is identical to (1) and (2) except that it adds noise to the outputs. The parameters of the model were previously computed for the human subject pictured in Fig. 1. Using each of the four experiment design methods we determined a sequence of stimulation inputs, and the simulation model produced noisy outputs given the inputs. We ran experiment designs of increasing size, starting with 36 data points, or four data points for each muscle unit. We computed designs for 36, 45, 54, 63, 72, 81, and 90 data points, increasing the number of data points for each of the nine muscle units in the even, bisection, and D-optimal methods. With more than 36 data points the V-optimal design can produce designs where there is a different number of data points for each muscle. We used each experiment design method to gather data to identify 300 models for each size experiment design. The four experiment design methods are scored as follows. We treat the mean output of the simulation model at each stimulation input as the ground truth. We randomly select 1000 endpoint force targets from the space of achievable endpoint force targets. For each of the 300 models identified using the four experiment design methods we compute the output prediction error and covariance for each of the 1000 endpoint force targets. We then compute the RMS error over all the targets and take the determinant of the sum of the covariances over all the targets. For each size experiment design and each experiment design method there are 300 measures of the RMS error and determinant of the sum of the covariances, one for each random trial. We use the median of the 300 measures to score each design method for each experiment design size. The median is used because the covariance can be extremely high for some trials with low experiment design size. With large outliers, the median represents the central tendency better than the mean.
Results When accurate prior knowledge of the parameters of the model was assumed, the D-optimal and V-optimal experiment designs required fewer data points than did the even and bisection experiment designs to identify models with a given accuracy (Fig. 2). The savings was 9-27 data points or 10-30% of the maximum number of data points used in an
experiment design or one to three fewer data points to identify a model for each muscle unit. When no prior knowledge of the parameters was assumed the advantage of using the optimal methods decreased (Fig. 2). The savings in data required to achieve a desired accuracy when using the optimal designs was zero to nine data points or 0-10% of the maximum number of data points used. With no knowledge of the real parameters, the first several data points in the experiment design were suboptimal for all methods. With new data points the information about the parameters increased, and the subsequent D-optimal and V-optimal data points were optimal for the updated parameter estimates and yielded less-biased estimates of the muscle force output. When prior knowledge was assumed, both the D-optimal and V-optimal designs yielded output predictions with less covariance than the even and bisection designs (Fig. 3). The decrease in covariance was greatest for the V-optimal designs. This was expected as the V-optimal design explicitly minimizes the integrated output covariance. When no prior knowledge of the parameters was assumed the V-optimal designs yielded endpoint force predictions with similar covariance to V-optimal designs when prior knowledge was assumed (Fig. 3).
Discussions This study determined if using optimal sampling methods decreases the data required to identify models of force production via FES for a human arm when multiple muscles are used. By simulating experiments with four different design methods 300 times each we showed that optimal experiment designs require less data than do previously-used designs to identify models of similar accuracy. Further, the covariance in endpoint force estimates is decreased when experiment designs explicitly minimize the output covariance, as the V-optimal design does. The four experiment design methods resulted in different sampling of the input space. The even design samples the input space evenly (Fig. 4(a)). The bisection design attempts to sample the output space evenly (Fig. 4(b)). The even and bisection designs run one experiment at several unique 3/4
Smart Machines – Neural Evolution - September 2012 - Banff, AB, Canada
higher-dimensional spaces optimal designs will become more and more important in reducing data requirements, error, and variance.
Conclusions
input levels for each muscle unit. The D-optimal design reduces endpoint force error by collecting multiple data points in clusters near the three inputs where there is the most information about the parameters of the recruitment curve model, (Fig. 4(c)). Note that the sequential experiment design updates the estimate of the parameters and the optimal input after each data point is collected. The result is designs with three clusters of inputs rather than three inputs exactly repeated multiple times. Repeatedly placing inputs at the most sensitive stimulation levels reduces output bias at those inputs, as the mean of the data approaches the true mean with more and more data points. For example, when only one noisy data point was collected at the 100% input level with the even and bisection designs (Fig. 4(a) and (b)), there was error in the estimate of the output at 100% input. When multiple noisy data points were sampled at 100% input, as with the D-optimal design (Fig. 4(c)), there was less error in the estimate of the output at 100% input. The V-optimal design reduces endpoint force error and variance by collecting data points at inputs that are most often used to achieve the target outputs. It allows for more data points for a particular muscle unit if that unit contributes more to covariance in the endpoint force. The V-optimal design in Fig. 4(d) uses eight data points for this muscle unit, while the others use only six. The V-optimal design collects the most data at approximately 20% to 50% stimulation and at 100% stimulation, which are the input levels used most to achieve the desired force targets. Besides reduction in data requirements and variance there are other important reasons to use the optimal designs. The first is that they protect against particularly “bad” outliers, which are most damaging to predictions used for control when the data set is small. This can be seen from the outliers that caused a biased fit with the bisection design in Fig. 4(b). A second reason to further explore optimal designs for modeling of FES systems for control is that the space to explore quickly expands when doing dynamic force control or motion control. Rather than exploring the space of static inputs, one must explore the effects of stimulation inputs at various states of the arm and of the muscles. When exploring higher and
The optimal experiment design methods require 10-30% less data to identify a model for endpoint force control with a given accuracy than do the previously-used even and bisection experiment designs. The savings in data requirements with the optimal designs decreases as the prior knowledge of the model decreases. The V-optimal designs produce models with less variance than the D-optimal, even, and bisection designs even when prior knowledge of the model is not available.
References [1] W. K. Durfee and K. E. MacLean, “Methods for estimating isometric recruitment curves of electrically stimulated muscle,” IEEE Transactions on Biomedical Engineering, vol. 36, no. 7, pp. 654–666, 1989. [2] K. Chaloner and I. Verdinelli, “Bayesian experimental design: A review,” Statistical Science, vol. 10, no. 3, pp. 273–304, 1996. [3] E. M. Schearer, Y. Liao, E. J. Perreault, M. C. Tresch, and K. M. Lynch, “Optimal sampling of recruitment curves for functional electrical stimulation control,” in 34th Annual International Conference of the IEEE Engineering in Medicine and Biology Society, 2012, submitted. [4] A. C. Atkinson, A. N. Donev, and R. D. Tobias, Optimum Experimental Designs, with SAS. Oxford: Oxford University Press, 2007. [5] K. H. Polasek, H. A. Hoyen, M. W. Keith, and D. J. Tyler, “Human nerve stimulation thresholds and selectivity using a multi-contact nerve cuff electrode,” IEEE Transactions on Neural Systems and Rehabilitation Engineering, vol. 15, no. 1, pp. 76–82, 2007. [6] E. M. Schearer, Y. Liao, E. J. Perreault, M. C. Tresch, W. D. Memberg, R. F. Kirsch, and K. M. Lynch, “System identification for 3D force control of a human arm neuroprosthesis using functional electrical stimulation,” in International Conference on Robotics and Automation, 2012.
Acknowledgements This work was supported by NSF grant 0932263 and NSF Graduate Fellowship DGE-0824162. Author's E-mail:
[email protected] 4/4
Powered by TCPDF (www.tcpdf.org)