World Academy of Science, Engineering and Technology International Journal of Electrical, Computer, Energetic, Electronic and Communication Engineering Vol:7, No:2, 2013
Optimal Transmission Network Usage and Loss Allocation Using Matrices Methodology and Cooperative Game Theory Baseem Khan, Ganga Agnihotri
International Science Index, Electrical and Computer Engineering Vol:7, No:2, 2013 waset.org/Publication/9996913
Abstract—Restructuring of Electricity supply industry introduced many issues such as transmission pricing, transmission loss allocation and congestion management. Many methodologies and algorithms were proposed for addressing these issues. In this paper a power flow tracing based method is proposed which involves Matrices methodology for the transmission usage and loss allocation for generators and demands. This method provides loss allocation in a direct way because all the computation is previously done for usage allocation. The proposed method is simple and easy to implement in a large power system. Further it is less computational because it requires matrix inversion only a single time. After usage and loss allocation cooperative game theory is applied to results for finding efficient economic signals. Nucleolus and Shapely value approach is used for optimal allocation of results. Results are shown for the IEEE 6 bus system and IEEE 14 bus system. Keywords—Modified Kirchhoff Matrix, Power flow tracing, Transmission Pricing, Transmission Loss Allocation.
R
I. INTRODUCTION
ESTRUCTURING of Electricity Supply Industry (ESI) has taken place around the world. The main aim behind this restructuring is to introduce competition to increase efficiency and quality of services in the electricity supply industry. This restructuring consists of various new aspects such as transmission embedded cost allocation, transmission loss allocation, congestion management etc. These all issues raise problems and challenges in front of the utilities of ESI. After restructuring, competition is introduced in the distribution sector. But it is difficult to introduce competition in the transmission sector due to its monopolistic nature. In transmission sector it is not possible to build a separate transmission line for every generation facility. Hence transmission cost allocation is very complicated task in the deregulated environment. Further issues like the fair and equitable allocation of the transmission charges should be addressed. In the same way transmission loss allocation in an open access market is very significant issue. It is very well known fact that when the electrical power is transmitted through a network it will cause power losses in the network. The generator must compensate for the loss by generating more power but under competitive electricity market no generator Baseem Khan is with the National Institute of Technology, Bhopal, 462051 India (e-mail: baseem_khan04@ yahoo.com). Ganga Agnihotri with the National Institute of Technology, Bhopal, 462051 India. (e-mail:
[email protected]).
International Scholarly and Scientific Research & Innovation 7(2) 2013
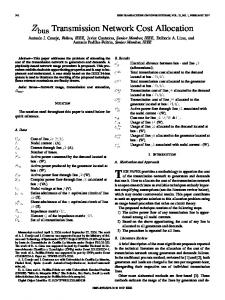
would want to generate more power to compensate this loss as it will increase their generation cost. From an economic point of view both generators and loads are supposed to pay for losses because they both use the network and thus are responsible for losses incurred. The problem of allocating transmission active power loss among the various participants has become more important with the increase in competition level in the electricity market. There are various transmission pricing methodologies which are used across the world for allocation of transmission charges to users. These are mainly classified into the embedded cost and market based pricing methodologies. Embedded Cost Pricing methods are based upon determining a utility’s total cost of providing the transmission services. It includes typically service related cost, asset related, and operation & management costs, while market based pricing methodologies are driven by a competitive bidding process which results in prices that are influenced by the demand of services. Classification of embedded cost methods is shown in Fig. 1.
Postage stamp method Roll-in methods Contract path method
Embedded cost transmission pricing methods
MW-Mile method Network based methods MVA-Mile method Power Flow Trcing Flow based methods Circuit Theory based
Fig. 1 Types of Embedded Transmission Pricing Methods
In all of these methods power flow tracing provide us a complete view of usage allocation problem which is very important for transmission cost allocation. When usage allocation is known it is straightforward to allocate the transmission cost to generators and loads. The first attempt to trace power flows was done by Bialek et al. when Topological Generation Distribution factors based Power flow tracing were proposed in March 1996 [2] which explained the method for
196
scholar.waset.org/1999.5/9996913
International Science Index, Electrical and Computer Engineering Vol:7, No:2, 2013 waset.org/Publication/9996913
World Academy of Science, Engineering and Technology International Journal of Electrical, Computer, Energetic, Electronic and Communication Engineering Vol:7, No:2, 2013
tracing generator's output. They introduce a simple topological method of tracing the flow of real and reactive power in transmission networks. In Feb 1997, Kirschen et al. [3] explained a power flow tracing method based on the proportional sharing assumption which introduces the concept of domains, commons, and links. In Nov 2000, Gubina et al. [4] described the method to determine the generators’ contribution to a particular load by using the nodal generation distribution factors. In Aug 2000, Wu et al. [5] explained the use of graph theory to calculate the contributions of individual generators and loads to line flows and the real power transfer between individual generators and loads. In 2009 Xie et al. [6] proposed and explained the power flow tracing algorithms founded in the extended incidence matrix considering loop flows. In Feb 2007, Conejo et al. [7] explained a method of network cost allocation based on Z-bus matrix. In Aug 2006 Abhyankar et al. [8] proposed real power flow tracing method based on optimization approach. In Aug 2010, Rao et al. [9] explained the Min-Max fair allocation criteria for transmission system usage allocation. Similarly many different loss allocation schemes have been proposed for transmission loss allocation. The existing transmission loss allocation methods may be classified into prorata method, marginal methods, power flow tracing-based methods, and circuit theory based methods [1]. Prorata method is one of the classical methods which are easy to implement and understand. It is characterized by the allocation of electric losses proportionally to the power delivered by each generator and each load. It is also assumed an equal allocation 50% to generator and 50% of the loads [10]. In marginal procedure incremental transmission coefficients are used for allocation of transmission losses to demands and generators [11]. The use of power flow tracing methods for allocation of transmission losses is proposed in [12]. In this work proportional sharing principle is combined with load flow results. The methods based on circuit theory are simple and easy to implement. In this category method based on Z- bus matrix is proposed by A. J. Conejo et al. This method presents a new procedure for allocating transmission losses to generators and loads in the context of pools operated under a single marginal price derived from a merit-order approach [13]. The main difficulty in allocating losses to load or generators to bilateral contracts by circuit theory is that, despite approximations the final allocations always contain a certain degree of arbitrariness. Recently several new algorithms and methods are also proposed such as in [14] a method based on complex power flow tracing is proposed. This method topologically determines the contribution of generators and loads to losses in transmission lines. In [15] author decomposed transmission losses into three components. Analytical proofs of the proposed loss decomposition are presented along with methods of allocating each component to the parties contributing to it. A method based on a combination of cooperative game theory and circuit theory is presented in [16]. A two step procedure is used for allocation of transmission losses. The Aumann Shapley method and circuit theory are used to calculate the participation of each real and
International Scholarly and Scientific Research & Innovation 7(2) 2013
imaginary components. In [17] a new algorithm is proposed for transmission loss allocation which is used path integral and based on transaction strategy. A new path integral method is developed by integrating the partial differential of the system loss along a path reflecting the transaction strategy. A usage based transmission loss allocation method is proposed in [18]. This new method calculates the portion of real power transmission loss contribution from the generators and simultaneously the portion of the real power transmission loss allocated to the loads using their contract obligations with the generators in the open access environment. In [19] method based on circuit theory and the concept of orthogonal projection for pool based electricity market is proposed. In this paper a power flow tracing based method is proposed which involves Matrices methodology for the transmission usage and loss allocation for generators and demands. The power flow tracing has been receiving more attention in recent years due to power industry restructuring because it is extremely important to calculate the contributions of individual generators and loads to line flows. This paper presents a model of usage and loss allocation based on the concept of the matrices methodology. In the proposed method modified Kirchhoff matrix is developed for usage allocation. After that loss allocation matrix is formed for transmission loss allocation to loads and generators. Further for optimal allocation cooperative game theory is applied to the results. The paper is organized as follows: section II presented the proposed methodology. The procedure of usage and loss allocation is presented in section III. Section IV gives an overview of cooperative game theory. Results and discussion are presented on IEEE 6 bus and IEEE 14 bus system in section V followed by a conclusion. II. PROPOSED MATRICES METHODOLOGY Let consider a simple diagraph G showed in Fig. 2. 1
3
4
2
Fig. 2 Simple Diagraph G
The Kirchhoff matrix of above diagraph is given by (1).
K G
1 1 0 0
0 2 1 1
1 0 2 1
0 1 1 2
Hence from the above example for a simple digraph G of n
197
scholar.waset.org/1999.5/9996913
World Academy of Science, Engineering and Technology International Journal of Electrical, Computer, Energetic, Electronic and Communication Engineering Vol:7, No:2, 2013
IT K
vertices, an n by n matrix called the Kirchhoff matrix K G or K k is defined as [1],
International Science Index, Electrical and Computer Engineering Vol:7, No:2, 2013 waset.org/Publication/9996913
K
d v x
for i for i
j j
pf
for i for i
p p pT
j and p j and p for i
0 0 j
(2)
where pT net lows on the nodes From the above matrix and using (1) the Modified Kirchhoff matrix is constructed as follows: Denoting Modified Kirchhoff matrix of a Power Network as k , the authors define the following expression K for elements of the Modified Kirchhoff matrix: for i
p pT 0
k
j and p for i j otherwise
0
KT I
p
for i
j and p
p and p
I
p 0
for i
j and p
p and p
p
0 p otherwise
(4)
(8)
PG
(9)
Equation (9) can be rewritten as I
T
K
PG
(10)
From the above matrix we get the inverse of Modified ) which is used for power flow tracing Kirchhoff matrix (K and loss allocation. In the next section procedure for power flow tracing and loss allocation is described. III. PROCEDURE FOR TRACING POWER FLOW AND LOSS ALLOCATION A. Model for Power Flow Tracing When Let ln=1........n represents the total number of lines in the system. M=1........m is the total number of generators and D 1. . . . . . d is the total number of loads in the system. Again let PGG diag PG , PG , … . , PG represents the number of generators in diagonal matrix. Thus IT PGG
PG
T
or PG
PGG I
(11)
Combining (11) and (8) PG
PGG K
PL
(12)
Matrix PGG K is named supply factor matrix. The supply factor matrix is denoted by T t , i. e., PGG K
PG
(5)
Property 2. The sum of all elements in column j of a Modified Kirchhoff matrix equals the total active power of generators at bus j. This property is mathematically expressed as:
International Scholarly and Scientific Research & Innovation 7(2) 2013
PL
(13)
and from (9)
A. Properties of Modified Kirchhoff Matrix Property 1. The sum of all elements in row j of a Modified Kirchhoff matrix equals the active load power at bus j. This property is mathematically expressed as: PL
(7)
T
K
T
where p p , and p p p p p = transmission loss in line i-j in actual direction p = transmission loss in line i-j in counter direction
K I
K
I
(3)
0
PG
From (5) and (7) we have
Now from the above Modified Kirchhoff matrix, Kirchhoff loss matrix can be formed as follows: kl
(6)
The above equation can be rewritten as follows
(1)
where d v = in-degree of the ith vertex, x = (i,j)th entry in the adjacency matrix This matrix is the basis of the proposed methodology. First Authors construct a power flow matrix from the Newton Raphson load flow. This matrix gives a complete overview of power flows in the system. It is formed between nodes of the system. Diagonal elements give net flows at nodes and off diagonal elements give the actual flows and counter flows in the system. The proposed matrix is defined as follows: active power in branch i– j from bus i to bus j as 0 and total inflow at bus i as pT p
T
PG
∑
t PL
(14)
where t PL denotes the active power distribution of generation output at bus i to the load situated at bus j [6]. P
t PL
(15)
Thus (15) gives the generator’s share to loads in the system. On the same line for calculating the generators shares to lines flow (15) is modified by replacing load power from the lines flow as shown in (16). It is assumed that a a : a (23:77) split in the transmission usage occurs between generators and demand [20].
198
scholar.waset.org/1999.5/9996913
World Academy of Science, Engineering and Technology International Journal of Electrical, Computer, Energetic, Electronic and Communication Engineering Vol:7, No:2, 2013
For example the generator share situated as bus s to the line s-t is given by P
t P a
(16)
Hence (15) and (16) gives the generators share in loads and lines flows. Similarly, the usage allocated to a load for the use of all lines can be defined by using a instead of a . For calculating the loads shares in line flows and generated power same procedure is followed: Considering dual of (9)
International Science Index, Electrical and Computer Engineering Vol:7, No:2, 2013 waset.org/Publication/9996913
PL
T
PLL K
PG
(17)
where the diagonal matrix PLL diag PL , PL , … . . , PL and T is the extraction factor matrix of loads from R= PLL K generators [6]. By using an extraction factor matrix, loads share in generating power and line flows is calculated. B. Model for Transmission Loss and Cost Allocation For transmission loss allocation to generator considers (16). In this equation line flows P is replaced by the transmission Loss in lines which is coming from the elements of the Kirchhoff loss matrix p and p . Hence transmission losses of line s-t allocated to generator located at bus i is given by: P
t p
(18)
Similarly transmission losses of line s-t allocated to load situated at bus j is given by: P
r p
(19)
From (18) and (19) losses are allocated to generators and loads respectively. This method of loss allocation is said to be direct because all the calculation is already done for usage allocation. If the usage cost of the line is denoted as C (in Rs/MW) then loss cost allocated to users is given by: For generators c
G
P
C
c
c
G
C LT
International Scholarly and Scientific Research & Innovation 7(2) 2013
c
LT
(23)
IV. COST ALLOCATION USING COOPERATIVE GAME THEORY Game theory is used for fair allocation of transmission charges among the users. It provides interesting concepts, methods and models that may be used when assessing the interaction of different agents in a competitive market [22]. In particular co-operative game theory arises as a most convenient tool to solve the cost allocation problem in deregulated markets. A. Cooperative Game Theory A cooperative game consists of two elements: (i) a set of players and (ii) a characteristic function specifying the value created by different subsets of the players in the game. Formally let N 1,2,3 … … . n be the finite set of the players and let ‘i’ where ‘i’ sums from 1 through n, index the different members of N. The characteristic function is a function denoted by v S that associate with every subset S of N a number denoted v S . The number v S is interpreted as the value created when the member of S come together and interact. In sum, a cooperative game is a pair N, v where N is a finite set and v is a function mapping subset of N of members [23]. The application of cooperative game theory is to suggest an optimal division of the resources among its different players. The resource allocation is represented in terms of a pay-off vector denoted as x , x , x … xN . If the allocation needs to be optimal and fair for all the players, three conditions, as given below, namely, individual, group and global rationalities need to be satisfied [22]. Individual Rationality xi
vi; i
xS
vS; S
N
Group Rationality N
Global Rationality
(21)
where C =Transmission Loss cost allocated to generator i for all the lines. Similarly for Loads
∑
where CLT = Transmiaaion Loss Cost Allocated to Load for all the Lines
(20)
G
(22)
L
G
∑
C
where c T = Transmission Loss cost Allocated to Load T for line s-t, p = Power Loss in Transmission Line s-t. Total transmission loss cost allocated to generators
where c =Transmission Loss cost allocated to generator i for line s-t, p = Power Loss in Transmission Line s-t. Total transmission loss cost allocated to generators CG
P
LT
xN
vN;
Any pay-off vector satisfying the above conditions is called an imputation [22]. There are various methods which are based on the game theory such as Core, Nucleolus, Shapley value, Solidarity value, Owen value etc. But in this paper use
199
scholar.waset.org/1999.5/9996913
World Academy of Science, Engineering and Technology International Journal of Electrical, Computer, Energetic, Electronic and Communication Engineering Vol:7, No:2, 2013
International Science Index, Electrical and Computer Engineering Vol:7, No:2, 2013 waset.org/Publication/9996913
of Shapley approach has been made to allocate the fixed cost to accommodate all the loads in a pool market and conclusions have drawn which show that the Shapley value is a more preferable method when it is in the core of the game. Fairness suggests that a fixed cost should be uniformly allocated among the players i.e. actually what does the sharing rule derive from the Shapley value. It overcomes the drawbacks of conventionally used methods and reflects the marginal contribution of a user to the aggregate system savings [24]. B. Shapley Value Shapley value is an a priori value that each entity contributes to the grand coalition in a game with a particular characteristic function. To obtain this all the possible permutations should be considered. Depending on the order of entry of each player the net contribution to the grand coalition is obtained. The sum of each of such contribution is obtained after neglecting the negative contributions. This sum gives the Shapley Value. The Shapley Value denoted by φi for a player ‘i’, assigns to the player, a share of the joint gain which is in proportion to the contribution of this player to the grand coalition [22]. |S|
Ø v , S
1 ! |N| |N|!
|S| !
v S
v S
i
where, S is the coalition containing i. S i is the coalition obtained by excluding i |S| is the number of entities in coalition S N is the total number of players v S is the characteristic value associated with coalition S In equation the first part of the expression gives the probability of a particular player joining that the coalition and the difference part give the contribution that particular player makes to the coalition by his joining. C. Nucleolus Solution Concept The nucleolus is a solution concept introduced by Schmeidler in 1969. Two important characters of nucleolus are, respectively, 1) every game has one and only one nucleolus, and 2) unless the core is empty, the nucleolus is in the core. The goal of using the nucleolus concept is to find a way to fairly allocate the power losses that are jointly created by all transactions. Suppose X x , x , … . , x is the set of each transaction’s allocation losses, Y y , y , … . , y is the set of the loss allocation imputation, and v S is the loss of the transaction coalition S. Nucleolus is based on the minimum core and is represented by C
ε y Y/φ y φ y max e S, y
ε
S N
value; and V S is the loss, which is created by the alternation of the member of transactions’ coalition S, namely V S
v i S
Use linear programming (LP) to solve (1), namely min ε s. t. V S
y S
V S
y
ε
S
where S is the coalition of all transactions, and S is all nonempty sub coalitions of transactions [22]. The total loss allocation for each transaction should be the summation of the loss created by all transactions and one created by the individual transaction, namely x
v i
y, i
1,2, … , n.
D. The Fixed Cost Allocation Game The journey from monopoly to competitive market increased the need for economic efficiency in the electricity industry. In this context, the solution mechanisms of cooperative game theory behave well in terms of economic efficiency, fairness and stability. Further Shapley value is a promising alternative solution to the common cost allocation problem and defines the fair division of fixed costs. It is a way to distribute total gains among the players, on the assumption that they have all collaborated. E. Characteristic Value and Standalone Cost The characteristic value specifies the minimal cost that will be incurred by each coalition of players [25]. In the cooperative game theoretic framework, there is no unique way of characterizing the cost of coalition, i.e. characteristic value, v S . In every approach of cooperative game v S is defined as per the choice of the user either on the basis of unit cost or on the basis of transmission usage. In this work, authors has chosen the basis of transmission network usage using tracing flow to evaluate the characteristic value as well as standalone cost to support the design of a fixed cost allocation system. The network operator calculates the cost, v i as if i were the only agent in the marketplace with either power flow or optimal power flow framework. This cost is known as standalone cost. Thus intend for the agents to cooperate is the existence of counter flows. F. Charge Allocated to Generators and Demands If the usage cost of line i j is denoted as C in Rs/hr, then charge allocated to a generator at bus k for this usage cost of line i j is given by
where ε represents an arbitrary small real number, e S, y is the coalition S’s excess value of imputation y Y, namely, ∑ S y ; φ y is the maximum of excess e S, y V S
International Scholarly and Scientific Research & Innovation 7(2) 2013
v S
C
200
P P
C
scholar.waset.org/1999.5/9996913
World Academy of Science, Engineering and Technology International Journal of Electrical, Computer, Energetic, Electronic and Communication Engineering Vol:7, No:2, 2013
The total charge allocated to generators at bus k for the use of all lines is given by C
C N
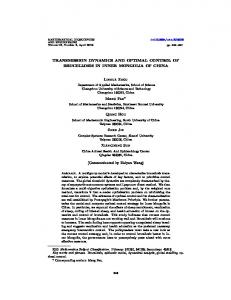
where C the total is allocated charge for the generators at bus k, and N is the number of branches. V. THE FLOW CHART FOR PROPOSED MATRICES METHODOLOGY IS GIVEN IN FIG. 3. RESULT AND DISCUSSION
International Science Index, Electrical and Computer Engineering Vol:7, No:2, 2013 waset.org/Publication/9996913
The proposed matrices methodology is applied to the IEEE 6 and IEEE 14 bus power system to demonstrate the feasibility and effectiveness of the methodology. A computer program coded in MATLAB is developed. A. Ieee 6 Bus System 1. Transmission Usage Allocation and Pricing The IEEE 6 bus power system is used to illustrate the proposed methodology. The summation of powers extracted by the load buses from all the generators equals the total load demand similarly the addition of powers contributed by the generator buses to all the demands equals the total generation power. For example load at bus 4 is 0.7 pu in which 0.53 is supplied by Generator 1 and remaining 0.2 pu is supplied by generator 2. Tables I and II give the generators and load contributions to line flows. These tables also provide the transmission charge allocation to generators and loads.
Fig. 3 Flow chart of Proposed Matrices Methodology
Line
Flow(pu)
1-2 1-4 1-5 2-3 2-4 2-5 2-6 3-5 3-6 4-5 5-6
0.29 0.44 0.35 0.03 0.33 0.15 0.26 0.19 0.44 0.04 0.02
TABLE I TRANSFERRED POWER AND CHARGE ALLOCATED TO GENERATORS FOR THE 6 BUS SYSTEM Supplied by Supplied by Supplied by Charge allocated Charge allocated to Cost (Rs/hr) Gen.1(pu) Gen.2(pu) Gen.3(pu) to Gen.1(Rs/hr) Gen.2(Rs/hr) 223.6 0.2907 0.0 0.0 51.4296 0 206.2 0.4366 0.0 0.0 47.4157 0 310.5 0.3556 0.0 0.0 71.4112 0 254.9 0.0112 0.0192 0.0 21.8371 37.4993 111.8 0.1240 0.2130 0.0 9.57547 16.4482 316.2 0.0577 0.0991 0.0 27.0752 46.5018 211.9 0.0983 0.1688 0.0 18.1468 31.1616 286.4 0.0034 0.0059 0.1840 1.16026 2.0134 101.9 0.0077 0.0132 0.4156 0.41424 0.71012 447.2 0.0317 0.0121 0.0 77.6342 29.6332 316.2 0.0107 0.0028 0.0044 45.7786 11.9795
Line
Flow(pu)
Cost(Rs/hr)
1-2 1-4 1-5 2-3 2-4 2-5 2-6 3-5 3-6 4-5 5-6
0.29 0.44 0.36 0.03 0.33 0.16 0.26 0.19 0.44 0.04 0.02
223.6 206.2 310.5 254.9 111.8 316.2 211.9 286.4 101.9 447.2 316.2
TABLE II EXTRACTED POWER AND CHARGE ALLOCATED TO LOADS FOR THE 6 BUS SYSTEM Extracted by Extracted by Extracted by Charge allocated Charge allocated Load4(pu) Load5(pu) Load6(pu) to Load4(Rs/hr) to Load5(Rs/hr) 0.1420 0.1177 0.0313 84.0178 69.6401 0.2132 0.1767 0.0471 77.4446 64.1860 0.1736 0.1440 0.0383 116.582 96.704 0.0121 0.0069 0.0111 79.1793 45.1518 0.1337 0.0761 0.1232 34.5647 19.6737 0.0622 0.0354 0.0574 97.7124 55.6112 0.1060 0.0603 0.0977 65.5112 37.2672 0.0 0.0578 0.1352 0 66.0341 0.0 0.1307 0.3053 0 23.5395 0.0396 0.0023 0.0001 324.677 18.8575 0.0 0.0166 0.0004 0 237.766
International Scholarly and Scientific Research & Innovation 7(2) 2013
201
scholar.waset.org/1999.5/9996913
Charge allocated to Gen.3(Rs/hr) 0 0 0 0 0 0 0 62.7907 22.3580 0 18.8249
Charge allocated to Load6(Rs/hr) 18.5194 17.1090 25.7206 72.6355 31.8502 90.1719 60.3816 154.460 54.9855 0.81989 5.72930
International Science Index, Electrical and Computer Engineering Vol:7, No:2, 2013 waset.org/Publication/9996913
World Academy of Science, Engineering and Technology International Journal of Electrical, Computer, Energetic, Electronic and Communication Engineering Vol:7, No:2, 2013
The IEEE 6 bus system has been considered as pool market place for realizing Shapley value and Nucleolus approach of cooperative game theory. Thus bilateral contracts are not allowed and the whole power is traded in a mandatory pool with the pool operator having a wide knowledge of the generator’s data. In this attempt gaming has been allowed among loads and they are the players in the pool market. The work follows the ratio for global usage allocation between generators and loads as 23%:77% [20], in examples of pool market. According to this trend of usage allocation, transmission usage has been split in two parts: one for the gaming among generators to allocate 23% of transmission usage and another for the gaming among loads to allocate 77%. If all the three loads are going to cooperate with each other than the possible coalitions are 7, including the single player coalition. The evaluated characteristic values using tracing flow for different seven coalitions are presented in Table III. TABLE III CHARACTERISTIC VALUE OF COALITION IN THE POOL MARKET FOR IEEE 6 BUS SYSTEM Coalition Tracing Flow Based Characteristic Value Sr. No. [Rs.] S 1 L4 94.555 2 L5 187.4266 3 L6 132.51355 4 L4L5 286.6206 5 L4L6 229.09439 6 L5L6 325.031208 7 L4L5L6 409.5005 TABLE IV SHAPLEY VALUE AND NUCLEOLUS VALUE ALLOCATION FOR LOADS Shapley value allocation for Loads Nucleolus value Sr. No. Load [Rs.] [Rs.] 1 L4 92.3257 92.89 2 L5 186.7080 185.7616 3 L6 130.4886 130.85
Motivation for the participants to cooperate is the existence of counter flows. Results obtained satisfy all the three conditions of gaming, individual rationality, group rationality and the global rationality of game theory, depicted below. Thus the accomplishment of group rationality proves that the solution lies in the core. As allocated payoff vector is part of the core hence more likely to be accepted by the players. Individual rationality, x i v i ; x L4 v L4 → 92.3257 94.555 x L5 v L5 → 186.7080 187.4266 x L6 v L6 → 130.4886 132.51355 Group rationality x S
Global Rationality x N x
v N ;
v L4L5L6
409.5005 Rs.
L ,L L
2. Transmission Loss Allocation and Pricing Table V and VI gives a transmission loss allocation to loads and generators. Total system losses occurred in the system is 0.084697 pu from which 23% is allocated to generators and 77% is allocated to demands. TABLE V TRANSMISSION LOSS ALLOCATION TO LOADS FOR IEEE 6 BUS SYSTEM Lines Loss(pu) L4(pu) L5 (pu) L6 (pu) 1-2 0.0094 0.003531 0.002927 0.00078 1-4 0.0113 0.004245 0.003519 0.000937 1-5 0.0112 0.004208 0.003488 0.000929 2-3 0.0004 0.000124 7.04E-05 0.000114 2-4 0.0164 0.00507 0.002885 0.004674 2-5 0.0056 0.001731 0.000985 0.001596 2-6 0.0062 0.001917 0.001091 0.001767 3-5 0.0123 0 0.002838 0.006633 3-6 0.0108 0 0.002492 0.005824 4-5 0.0004 0.000291 1.71E-05 4.31E-07 5-6 0.0006 0 0.000451 1.1E-05 Total 0.084697 0.021117 0.020764 0.023263 TABLE VI TRANSMISSION LOSS ALLOCATION TO GENERATORS FOR IEEE 6 BUS SYSTEM Lines Loss(pu) G1(pu) G2 (pu) G3(pu) 1-2 0.0094 0.002162 0 0 1-4 0.0113 0.002599 0 0 1-5 0.0112 0.002576 0 0 2-3 0.0004 3.43E-05 5.88E-05 0 2-4 0.0164 0.001405 0.002412 0 2-5 0.0056 0.00048 0.000824 0 2-6 0.0062 0.000531 0.000912 0 3-5 0.0123 5.01E-05 8.57E-05 0.002697 3-6 0.0108 4.4E-05 7.53E-05 0.002368 4-5 0.0004 6.95E-05 2.64E-05 0 5-6 0.0006 8.64E-05 2.25E-05 3.55E-05 Total 0.084697 0.010037 0.004417 0.0051
B. Ieee 14 Bus System 1. Transmission Usage Allocation and Pricing The proposed method is also applied on IEEE 14 bus system [21]. Authors assume that cost of the line is proportional to the length of the line. After this the share of each generator (load) in load (generator) and line flows is calculated. Table VII presents generators and loads shares to various line flows respectively.
v S ;
x L4L5 v L4L5 ; x L4 x L5 v L4L5 ; 92.3257 186.7080 286.6206 279.0337 286.6206
International Scholarly and Scientific Research & Innovation 7(2) 2013
202
scholar.waset.org/1999.5/9996913
World Academy of Science, Engineering and Technology International Journal of Electrical, Computer, Energetic, Electronic and Communication Engineering Vol:7, No:2, 2013
Cost (Rs/hr)
Supplied by Gen.1(MW)
Supplied by Gen.2(MW)
Extracted by Load3(MW)
Extracted by Load4(MW)
Extracted by Load 5(MW)
Extracted by Load 6(MW)
Extracted by Load7(MW)
Extracted by Load8(MW)
Extracted by Load 9(MW)
Extracted by Load 10(MW)
Extracted by Load 11(MW)
Extracted by Load 12(MW)
Extracted by Load 13(MW)
Extracted by Load 14(MW)
141.27 71.83 73.85 58.72 44.53 23.77 27.73 16.06 59.44 44.71 7.579 7.932 18.00 0.0 27.73 5.072 9.215 3.973 1.732 5.918
62.263 229.49 203.47 185.65 182.97 183.69 44.176 209.12 556.18 252.02 220.41 283.81 146.10 176.15 110.01 90.289 298.77 208.86 297.92 387.73
141.3 71.8 67.9 54.0 41.0 23.5 27.5 15.9 60.0 45.2 7.7 8.0 18.2 0.000 27.5 5.0 9.1 4.1 1.8 6.1
0.00 0.00 8.1 6.5 4.9 1.7 1.9 1.1 2.4 1.8 0.3 0.3 0.7 0.000 1.9 0.4 0.6 0.2 0.1 0.2
55.02 27.98 38.36 30.50 23.13 4.993 5.823 3.372 6.717 5.052 0 0 0 0 0 0 0 0 0 0
28.44 14.46 14.14 11.24 8.527 9.812 11.44 6.627 13.20 9.930 0 0 0 0 0 0 0 0 0 0
4.62 2.35 1.22 0.97 0.74 0 0 0 3.98 3.00 0 0 0 0 0 0 0 0 0 0
6.795 3.455 1.802 1.433 1.087 0 0 0 5.867 4.413 1.895 1.983 4.500 0 0 0 0 0 0 0
0 0 0 0 0 0 0 0 0 0 0 0 0 0 0 0 0 0 0 0
0 0 0 0 0 0 0 0 0 0 0 0 0 0 0 0 0 0 0 0
17.55 8.922 8.728 6.940 5.263 6.055 7.062 4.090 8.149 6.130 0 0 0 0 18.72 3.424 6.222 0 0 0
5.467 2.780 2.142 1.703 1.291 1.029 1.201 0.695 3.525 2.651 0.692 0.724 1.643 0 3.180 0.582 1.057 2.127 0 0
2.161 1.099 0.569 0.452 0.343 0 0 0 1.860 1.399 0.600 0.628 1.426 0 0 0 0 1.846 0 0
3.744 1.904 0.990 0.787 0.597 0 0 0 3.234 2.432 1.045 1.094 2.482 0 0 0 0 0 1.348 0
8.335 4.238 2.208 1.756 1.331 0 0 0 7.192 5.410 2.323 2.431 5.517 0 0 0 0 0 0.267 4.107
9.140 4.648 3.685 2.930 2.222 1.883 2.196 1.272 5.706 4.292 1.025 1.072 2.434 0 5.826 1.066 1.936 0 0.118 1.812
1-2 1-5 2-3 2-4 2-5 4-3 4-7 4-9 5-4 5-6 6-11 6-12 6-13 7-8 7-9 9-10 9-14 11-10 12-13 13-14
2. Transmission Loss Allocation and Pricing Table VIII presents the transmission loss allocation between generators and Loads respectively. Total system losses occur
in IEEE 14 Bus system is 15.87016 MW. 23% of total losses i.e. 3.70114478 MW is allocated to generators and 77% i.e. 12.16902 is allocated to loads.
Losses(MW)
Supplied by Gen.1(MW)
Supplied by Gen.2(MW)
Extracted by Load3(MW)
Extracted by Load4(MW)
Extracted by Load 5(MW)
Extracted by Load 6(MW)
Extracted by Load7(MW)
Extracted by Load8(MW)
Extracted by Load 9(MW)
Extracted by Load 10(MW)
Extracted by Load 11(MW)
Extracted by Load 12(MW)
Extracted by Load 13(MW)
Extracted by Load 14(MW)
TABLE VIII TRANSMISSION LOSS ALLOCATION TO GENERATORS AND LOADS FOR IEEE 14 BUS SYSTEM
Line
International Science Index, Electrical and Computer Engineering Vol:7, No:2, 2013 waset.org/Publication/9996913
Line
Flow (MW)
TABLE VII TRANSFERRED POWER ALLOCATED TO GENERATORS FOR THE IEEE 14 BUS SYSTEM
1-2 1-5 2-3 2-4 2-5 4-3 4-7 4-9 5-4 5-6 6-11 6-12 6-13 7-8 7-9 9-10 9-14 11-10 12-13 13-14 Total
4.1760 3.297543 2.983856 2.255 1.314226 0.435399 0 0 0.539251 0 0.106067 0.099624 0.301612 0 0 0.010827 0.136837 0.034065 0.011037 0.097146 15.87016
0.9605 0.7584 0.5490 0.4149 0.2418 0.0901 0 0 0.1191 0 0.0234 0.022 0.0666 0 0 0.0022 0.0283 0.0076 0.0025 0.0219 3.3084
0 0 0.1579 0.1193 0.0695 0.0160 0 0 0.0112 0 0.0022 0.0021 0.0062 0 0 0.0004 0.0050 0.0007 0.0002 0.002 0.3927
1.2219 0.9649 1.1718 0.8855 0.5161 0.0704 0 0 0.0457 0 0 0 0 0 0 0 0 0 0 0 4.8762
0.6431 0.5078 0.4365 0.3299 0.1923 0.1375 0 0 0.0914 0 0 0 0 0 0 0 0 0 0 0 2.3385
0.0965 0.0762 0.046 0.0347 0.0202 0 0 0 0.0291 0 0 0 0 0 0 0 0 0 0 0 0.3026
0.1608 0.127 0.0689 0.0521 0.0304 0 0 0 0.0415 0 0.0204 0.0192 0.0581 0 0 0 0 0 0 0 0.5783
0 0 0 0 0 0 0 0 0 0 0 0 0 0 0 0 0 0 0 0 0
0 0 0 0 0 0 0 0 0 0 0 0 0 0 0 0 0 0 0 0 0
0.3859 0.3047 0.2757 0.2084 0.1214 0.0872 0 0 0.0581 0 0 0 0 0 0 0.0056 0.0706 0 0 0 1.5175
0.1286 0.1016 0.0689 0.0521 0.0304 0.0134 0 0 0.0249 0 0.0074 0.0069 0.0209 0 0 0.001 0.0126 0.0139 0 0 0.4826
0.0643 0.0508 0.023 0.0174 0.0101 0 0 0 0.0125 0 0.0065 0.0061 0.0186 0 0 0 0 0.0123 0 0 0.2216
0.0965 0.0762 0.023 0.0174 0.0101 0 0 0 0.0249 0 0.0114 0.0107 0.0325 0 0 0 0 0 0.0066 0 0.3093
0.1929 0.1524 0.0689 0.0521 0.0304 0 0 0 0.0498 0 0.0253 0.0238 0.072 0 0 0 0 0 0.0013 0.0524 0.7212
0.2251 0.1777 0.1149 0.0868 0.0506 0.0268 0 0 0.0415 0 0.0106 0.01 0.0302 0 0 0.0018 0.0221 0 0.0006 0.0224 0.8212
VI. CONCLUSION In the proposed work authors presents a combined methodology for the transmission usage and loss allocation which is based on the matrices methodology. This method is simple and easy to implement in large power system. Furthermore transmission loss allocation by this method is
International Scholarly and Scientific Research & Innovation 7(2) 2013
direct because all the calculation previously done for usage allocation. This method requires less calculation as compared to other methods such as Topological generator distribution factors proposed by Bialek [4] because matrix inversion is required only one time. Also the proposed matrix has a huge number of zero elements hence it is highly sparse in nature. After usage and allocation cooperative game theory is applied
203
scholar.waset.org/1999.5/9996913
World Academy of Science, Engineering and Technology International Journal of Electrical, Computer, Energetic, Electronic and Communication Engineering Vol:7, No:2, 2013
for getting efficient economic signals. Results are shown for the IEEE 6 bus system and IEEE 14 bus system. REFERENCES [1] [2] [3] [4]
International Science Index, Electrical and Computer Engineering Vol:7, No:2, 2013 waset.org/Publication/9996913
[5]
[6] [7] [8]
[9]
[10]
[11] [12] [13] [14] [15] [16]
[17]
[18] [19] [20]
[21]
Narsingh Deo, “Graph Theory with Applications to Engineering and Computer Science”, Prentice-Hall of India, 1994, pp. 220-227. J. Bialek, D. B. Tam, “Tracing The Generators’ Output”, Opportunities and Advances in International Power Generation, 18-20th March 1996. Daniel Kirschen Ron Allan Goran Strbac, “Contributions of Individual Generators to Loads and Flows”, IEEE Transactions on Power Systems, Vol. 12, No. 1, February 1997. Ferdinand Gubina, David Grgiˇc, Ivo Baniˇ, “A Method for Determining the Generators’ Share in a Consumer Load”, IEEE transactions on power systems, vol. 15, no. 4, November 2000. Felix F. Wu, Yixin Ni, and Ping Wei, “Power Transfer Allocation for Open Access Using Graph Theory — Fundamentals and Applications in Systems without Loop flow”, IEEE transactions on power systems, vol. 15, no. 3, august 2000. Kaigui Xie, Jiaqi Zhou, Wenyuan Li, “Analytical model and algorithm for tracing active power flow based on extended incidence matrix” Electric Power Systems Research 79 (2009) 399–405. Antonio J. Conejo, Javier Contreras, Delberis A. Lima, Antonio PadilhaFeltrin, “Z-bus Transmission Network Cost Allocation”, IEEE transactions on power systems, vol. 22, no. 1, February 2007. A. R. Abhyankar, S. A. Soman, S. A. Khaparde, “Optimization Approach to Real Power Tracing: An Application to Transmission Fixed Cost Allocation”, IEEE transactions on power systems, vol. 21, no. 3, august 2006. Rao M.S.S., Soman S.A., Chitkara P., Gajbhiye R.K., Hemachandra N., Menezes B.L., "Min-Max Fair Power Flow Tracing for Transmission System Usage Cost Allocation: A Large System Perspective", IEEE Transactions on Power Systems , Vol. 25, no. 3, pp. 1457-1468, Aug. 2010. A. J. Conejo, J. M. Arroyo, N. Alguacil, and A. L. Guijarro, “Transmission Loss Allocation: A Comparison of Different Practical Algorithms”, IEEE Trans. Power Syst., VOL. 17, NO. 3, AUGUST 2002. J. J. González and P. Basagoiti, “Spanish power exchange market and information system. Design concepts, and operating experience,” in Proc. IEEE PICA Conf., Santa Clara, CA, May 1999, pp. 245–252. J. W. Bialek, S. Ziemianek, and N. Abi-Samra, “Tracking-based loss allocation and economic dispatch,” in Proc. 13th PSCC, Trondheim, Norway, June/July 1999, pp. 375–381. A. J. Conejo, F. D. Galiana, and I. Kockar, “Z-bus loss allocation,” IEEE Trans. Power Syst., vol. 16, pp. 105–110, Feb. 2001. S. Abdelkader, “Transmission loss allocation through complex powerflow tracing,” IEEE Trans. Power Syst., vol. 22, no. 4, pp. 2240– 2248, Nov. 2007. S. Abdelkader, “Charactirization of transmission losses” IEEE Trans. Power Syst., vol. 26, no. 1, February 2011. Yuri P. Molina, Ricardo B. Prada, and Osvaldo R. Saavedra, “Complex Losses Allocation to Generators and Loads Based on Circuit Theory and Aumann-Shapley Method”, IEEE Trans. Power Syst., VOL. 25, NO. 4, NOVEMBER 2010. Kyung-Il Min, Sang-Hyeon Ha, Su-Won Lee, and Young-Hyun Moon, “Transmission Loss Allocation Algorithm Using Path-Integral Based on Transaction Strategy”, IEEE Trans. Power Syst., VOL. 25, NO. 1, FEBRUARY 2010. P.V. Satyaramesh, C. RadhaKrishna, “Usage-based transmission loss allocation under open access in deregulated power systems”, IET Gener. Transm. Distrib., 2010, Vol. 4, Iss. 11, pp. 1261–1274, 2010. Hai-Xia Wang, Rao Liu, and Wei-Dong Li, “Transmission Loss Allocation Based on Circuit Theories and Orthogonal Projection”, IEEE Trans. Power Syst., VOL. 24, NO. 2, MAY 2009. Rohit Bhakar, V. S. Sriram, Narayana Prasad Padhy and Hari Om Gupta, “Probabilistic Game Approaches for Network Cost Allocation,” IEEE Transactions on Power Systems, Vol. 25, No. 1, pp. 51-58, February 2010. Ahiakwor C.O., Chukwu U.C., Dike D.O., “Optimal transmission line pricing algorithm for a restructured power system”, Transmission and Distribution Conference and Exposition, 2008, 21-24 April 2008.
International Scholarly and Scientific Research & Innovation 7(2) 2013
[22] Rohit Bhakar, V. S. Sriram, N. P. Padhy, H. O. Gupta, “Network Embedded Cost Allocation: A Game Theoretic Approach”, 32ed National Systems conferences, (NSC 2008), Dec. 17-19, 2008. [23] Adam Brandenburger, “Co-operative Game Theory: Characteristic Function Allocations, Marginal Contribution”, version 01/04/07. [24] C.W.Yu, A.K.David and Y.K.Wong, “The Use of Game Theory in Transmission Embedded Cost Allocation”, Proceedings of the 5th International Conference on Advances in Power System Control, Operation and Management (APSCOM 2000), Hong Kong, October 2000. [25] P.A.Kattuman, R.J.Green and J.W.Bailek, “Allocating Electricity Transmission Cost Through Tracing: A Game-Theoretic Rationale,” Operation Research Letters 32, pp. 114-120, 2004.
Baseem Khan was born in Gwalior, India in 1987. He received BE degree (2008) from Maharana Pratap College of Technology Gwalior and received M.Tech. Degree (2010) in Power System from MANIT Bhopal. At the moment he is a research scholar at MANIT Bhopal, India. Ganga Agnihotri received BE degree in Electrical engineering from MACT, Bhopal (1972), the ME degree (1974) and PhD degree (1989) from University of Roorkee, India. Since 1976 she is with Maulana Azad College of Technology, Bhopal in various positions. Currently she is professor. Her research interest includes Power System Analysis, Power System Optimization and Distribution Operation.
204
scholar.waset.org/1999.5/9996913