Journal of Tropical Forest Science 24(2): 241–248 (2012)
Zaidon A et al.
OPTIMISATION OF THE PROCESSING VARIABLES for HIGH POLYMER LOADING IN COMPRESSED WOOD using RESPONSE SURFACE METHODOLOGY A Zaidon1, *, GH Kim2, MT Paridah3, ES Bakar1 & I Rushdan4 1
Faculty of Forestry, Universiti Putra Malaysia, 43400 Serdang, Selangor Darul Ehsan, Malaysia Division of Environmental Science and Ecological Engineering, Korea University, Seoul 136-713, Korea 3 Institute of Tropical Forestry and Forest Products, Universiti Putra Malaysia, 43400 Serdang, Selangor Darul Ehsan, Malaysia 4 Forest Research Institute Malaysia, 52109 Kepong, Selangor Darul Ehsan, Malaysia 2
Received March 2011 Zaidon A, Kim GH, Paridah MT, Bakar ES & Rushdan I. 2012. Optimisation of the processing variables for high polymer loading in compressed wood using response surface methodology. Response surface methodology (RSM) was applied to optimise processing variables in achieving high polymer loading in compressed sesenduk (Endospermum diadenum) wood. Central composite design (CCD) using RSM with three process variables, namely, phenol formaldehyde concentration (PC), pre-curing time (PCT) and compression ratio (CR) was used in this study to optimise effects of these variables on polymer loading. A quadratic model was obtained for polymer loading through this design. The experimental values were in good agreement with the predicted ones and the model was highly significant with correlation coefficient of 0.915. Within the pre-curing time applied in this study, the independent variable did not show any significant effect on polymer loading. Interactions between PC and PCT, PC and CR, and PCT and CR were negligible. Maximum polymer loading was achieved with 36% phenol formaldehyde solution and 74% compression ratio. Keywords: Response surface method, central composite design, compreg Zaidon A, Kim GH, Paridah MT, Bakar ES & Rushdan I. 2012. Pongoptimuman pemboleh ubah pemprosesan untuk memperoleh ketahanan polimer yang tinggi dalam kayu termampat menggunakan keadah permukaan respons. Kaedah permukaan respons (RSM) digunakan untuk mengoptimumkan pemboleh ubah pemprosesan bagi memperoleh ketahanan polimer yang tinggi dalam kayu sesenduk (Endospermum diadenum) termampat. Reka bentuk komposit pusat (CCD) menggunakan RSM dengan tiga pemboleh ubah proses iaitu kepekatan fenol formaldehid (PC), masa pra-pematangan (PCT) dan nisbah mampatan (CR) digunakan dalam kajian ini untuk mengoptimumkan kesan pemboleh ubah terhadap ketahanan polimer. Model kuadratik untuk ketahanan polimer telah diperoleh menggunakan reka bentuk ini. Nilai yang diperoleh daripada eksperimen adalah sebaik nilai yang diramalkan dan model yang diperoleh sangat signifikan dengan pekali korelasi iaitu 0.915. Dalam had masa pra-pematangan yang digunakan dalam kajian ini, pemboleh ubah bebas tidak menunjukkan sebarang kesan ketara terhadap ketahanan polimer. Interaksi antara PC dengan PCT, PC dengan CR dan PCT dengan CR sangat kecil. Ketahanan polimer maksimum boleh dicapai dengan larutan 36% fenol formaldehid dan nisbah mampatan 74% .
INTRODUCTION Lesser-known timber species in Malaysia are still not fully utilised due to their poor inherent properties. These timbers are usually low in density but have potential to be utilised for highvalue-added products if their properties can be improved. Chemical modification of wood either by bulking, internal coating or cross-linking is attractive for the improvement of strength properties, dimensional stability and durability *E-mail:
[email protected] © Forest Research Institute Malaysia
241
of wood against decay (Hill 2006). An effective method to improve properties of low density wood involves phenol formaldehyde (PF) resin impregnation and compression at considerably high hot-pressing pressure (Shams & Yano 2004). This product is known as compressed wood (compreg). It has also been found that PFimpregnated wood strips followed by laminating in a hot press can produce high quality compreg
Journal of Tropical Forest Science 24(2): 241–248 (2012)
Zaidon A et al.
laminates which have potential applications in parquet flooring, panelling and furniture components (Zaidon et al. 2010). One of the dominant factors in improving properties and dimensional stability of treated wood is the level of polymer loading. Density and mechanical properties of compressed wood increase with increasing polymer loading coupled with the densification process (Yano et al. 2001). On the other hand, dimensional stabilisation of compressed wood is dependent on polymer loading and polymer distribution in the treated wood (Rowell & Konkol 1987, Inoue et al. 1991). Another factor worth considering is the molecular weight of the PF resin. PF resin with molecular weight (Mw) of 290–480 is able to penetrate into the cell wall and significantly reduces swelling (Rowel 2005). However, PF resin with Mw of 820 remains in the cell lumen without resulting in any significant stability (Furuno et al. 2004). Highpolymer loading in compressed wood can be achieved by optimising the processing variables. These include Mw of the PF resin, concentration of the PF resin, pre-curing time and compression ratio (ratio of final thickness to initial thickness of wood). Response surface methodology (RSM) is a mathematical and statistical technique used for analysing effects of several independent variables (Myers & Montgomery 2002). In many cases, the relationship between the response and independent variables is not known. Therefore, in the first step of RSM, it is crucial to approximate the response in terms of analysing independent variables. This process usually employs a loworder polynomial equation in a predetermined region of the independent variables, which will later be analysed to locate the optimum values of independent variables for the optimum response (Ceylan et al. 2008). In this study, a model for high polymer loading in compressed wood of sesenduk (Endospermum diadenum) was developed using RSM. Independent variables studied were PF concentration (PC), pre-curing time (PCT) and compression ratio (CR).
MATERIALS AND METHODS
(1) PL % = 100 where Wf is the constant weight in a conditioning room after treatment and Wi is the constant weight in a conditioning room before treatment.
Response surface methodology and central composite design To explore the effect of variables on the response in the region of investigation, a central composite design (CCD) with three factors and three levels was performed. CCD with RSM has previously been used to evaluate the effect of multiple parameters on properties of panel product (Wang & Lam 1999, Li et al. 2009). It is considered as a robust mathematical and statistical technique for models that alleviated tribulation where multiple parameters may influence responses. Previous work (Zaidon et al. 2010) showed that treating solution concentration, pre-curing time and compression ratio were considered the most effective independent variables. The percentage of polymer loading was taken as the response. The CCD was applied using Design Expert Software (State Ease, Design Expert 8). The range and the level of variables under investigation are given in Table 1. In the regression equation, the test variables were coded according to equation 2:
Methodology The material used in this study were wood strips of sesenduk (E. diadenum). Treating solution used was low molecular weight phenol formaldehyde © Forest Research Institute Malaysia
(approximately 600 Mw, LmwPF). Pre-weighed, air dry (15% moisture content) wood strips of 25 × 150 × 5 mm thick were treated with LmwPF solution using vacuum-pressure process. The process involved 30 min vacuum followed by filling the set up with solution and soaking under pressure of 690 kPa for 30 min. After treatment they were pre-cured in an oven at 65 °C prior to compression in a hot press at 150 ± 2 °C for 20 min (Rowell & Konkol 1987). The compreg was then conditioned in a conditioning room at 25 ± 2 °C and 65 ± 2% relative humidity until constant weight. The weight was recorded. The polymer loading was determined as follows:
242
(2)
where xi is the independent variable coded value, xi is the independent variable real value, xi0 is the independent real value on the centre point
Journal of Tropical Forest Science 24(2): 241–248 (2012)
Table 1 Factor
Zaidon A et al.
The range and level of the variables Variable
Unit
Range and level of actual and coded values -α
x1
PC
%
x2
PCT
Hour
x3
CR
%
-1
0
1
α
20
24.05
30
35.95
40
3
4.21
6
7.79
9
70
74.05
80
85.95
90
PC = phenol formaldehyde concentration, PCT = pre-curing time, CR = compression ratio
(Elibol 2004, Roriz et al. 2009) and ∆xi is the interval, i = 1, 2, 3. A quadratic model equation was used to express the response as a function of independent variables as shown in the following equation.
(3)
where Y is the predicted response, β 0 is the constant coefficient, βi is the linear coefficient, βii is the quadratic coefficient, βij is the interaction of the coefficient, and xi and xj are the coded factors (Aghaie et al. 2009). Three important parameters, i.e. concentration of phenol formaldehyde (PC = x1), pre-curing time (PCT = x2) and compression ratio (CR = x3) were selected as the independent variables and the polymer loading (PL = Y) was the dependent response variable. Each of the independent variable was studied at five different levels containing two star points (α = 1.68) and seven replications of the central point with a total of 20 experiments. The effect on polymer loading corresponding to combined effects of the three variables was studied in their specific ranges: PC from 24.05–40.00%, PCT 3–9 hours and CR (per cent change of thickness after compressing) 70–90%. The plan of CCD in coded and actual levels of the three independent variables are shown in Table 2. The results of the experimental design were analysed and interpreted using Design Expert Software (Stat Ease version 8) and the response 3D plots were built using the same software.
RESULTS AND DISCUSSION The actual and predicted percentages of polymer obtained through RSM analysis are presented in Table 3. Actual values corresponded to the measured response data for a particular run and predicted values were evaluated from the © Forest Research Institute Malaysia
243
model. We used quadratic model to explain the mathematical relationship between independent variables and the dependent response. In the first stage of analysis, the results showed that the coefficients, x2, , x1, x2, x1.x3 and x2.x3 were statistically insignificant. Therefore, they were deleted from the equation and added to the lack of fit. As a result, new regression models were obtained for both coded and actual factors (equations 4 and 5 respectively): Y = 57.9027 + 14.60537x 1 – 2.1196x 3 + (4) 2.358194 + 3.316324
PL, % = 673.08 – 1.546 PC – 15.36 CR + 0.067 PC2 + 0.094 CR2 (5)
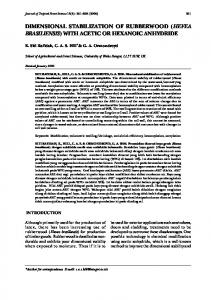
The results of analysis of variance (ANOVA) are shown in Table 4. The model of the equation and each term were significant at the 1% level. The equation was highly reliable as reflected by the high coefficient of determination value (r2), 0.915. The model also revealed a statistically insignificant lack of fit (p = 0.224) at 5% level. Since this value was more than 0.05, the model was statistically appropriate for further analysis. The effects of variables on polymer loading are shown in Figures 1–3. A graph was constructed by plotting the central values of the variables that affected polymer loading, i.e. 30% PC, 6 hours PCT and 80% CR. The effect of PC and PCT on the response at a fixed CR of 80% is shown in Figure 1. It could be seen that polymer loading increased with increasing resin concentration regardless of pre-curing time. The response value reached its highest value (74%) at 36% resin concentration. This result was comparable with that of Zaidon (2009). Using similar treatment process, the author found that sesenduk treated with 30–40% LmwPF had polymer loading of 68.61–85.52%. It is anticipated that when the treating concentration increases to a certain high value, the loading reaches a plateau and remains
Journal of Tropical Forest Science 24(2): 241–248 (2012)
Table 2
Zaidon A et al.
Experimental conditions of central composite design (CCD)
Run
Coded value x1
x2
Actual value x3
PC (%)
PCT (hours)
CR (%)
1
-1
-1
-1
24.05
4.21
74.05
2
1
-1
-1
35.95
4.21
74.05
3
-1
1
-1
24.05
7.79
74.05
4
1
1
-1
35.95
7.79
74.05
5
-1
-1
1
24.05
4.21
85.95
6
1
-1
1
35.95
4.21
85.95
7
-1
1
1
24.05
7.79
85.95
8
1
1
1
35.95
7.79
85.95
9
-1.68
0
0
20
6
80
10
1.68
0
0
40
6
80
11
0
-1.68
0
30
3
80
12
0
1.68
0
30
9
80
13
0
0
-1.68
30
6
70
14
0
0
1.68
30
6
90
15
0
0
0
30
6
80
16
0
0
0
30
6
80
17
0
0
0
30
6
80
18
0
0
0
30
6
80
19
0
0
0
30
6
80
20
0
0
0
30
6
80
PC = phenol formaldehyde concentration, PCT = pre-curing time, CR = compression ratio
constant even if more concentration is used. Rowell (2005) stated that higher solute content in PF solution might increase the viscosity, thus, limiting the penetration through the minute structure of the wood. The results also revealed that the range of PCT used did not significantly affect polymer loading. According to Shams and Yano (2004), the purpose of pre-curing is to plasticise the cell wall before initiating collapse at lower pressure. PF resin is effective since it polymerises before curing and fixes the deformation condition permanently after curing (Shams & Yano 2011). The effect of PC and CR on polymer loading at fixed PCT of six hours is presented in Figure 2. Increasing the PC and decreasing the CR increased the polymer loading in the wood. Maximum loading of 80% was attained at 36% PC and 74% CR. Figure 3 shows the effect of PCT and CR on the response at a fixed PC of 30%. Polymer loading increased with decreased CR at any PCT. PCT gave no significant effect
© Forest Research Institute Malaysia
244
on PL in the wood within the range of the tested period. The maximum loading was 63.5%. The relationship between CR and PL is not clear. However, it is believed that the lower the CR, the more PF resin fixes the cell deformation. As a consequence, more polymer is retained in the wood.
Adequacy of the model The fitted model needs to be assessed to ensure that it gives sufficient approximation of the results obtained in the experimental conditions. The coefficient of multiple regressions, r2, is a global statistic parameter to assess the fit of a model (Myers & Montgomery 2002). In this model, r2 was 0.915, which indicated the fitness of the model (Table 4). For further validation of the model, adjusted r2 was used for confirming the model adequacy. The adjusted r2 was calculated to be 0.958 which indicated a good model for use in field conditions. A residual
Journal of Tropical Forest Science 24(2): 241–248 (2012)
Table 3
The actual and predicted polymer loading percentages
Run
Table 4 Source
Zaidon A et al.
Response
R-studentised residual
Observed
Predicted
1
52.33
51.09
0.517
2
83.44
80.30
1.311
3
54.18
51.09
1.290
4
79.44
80.30
-0.360
5
45.44
46.85
-0.590
6
78.79
76.06
1.139
7
45.7
46.85
-0.481
8
80.57
76.06
1.883
9
40.32
40.01
0.179
10
84.84
89.14
-2.480
11
56.2
57.90
-0.673
12
59.61
57.90
0.675
13
68.28
70.85
-1.482
14
62.3
63.72
-0.819
15
57.32
57.90
-0.230
16
54.44
57.90
-1.369
17
59.91
57.90
0.794
18
56.21
57.90
-0.669
19
56.7
57.90
-0.476
20
59.53
57.90
0.643
ANOVA for response surface reduced quadratic model Sum of square
Model x1
Df
Mean square
F-value
Prob > F
799.21
4
799.21
109.96
< 0.0001
2913.24
1
2913.24
400.83
< 0.0001
61.36
1
61.36
8.44
0.0109
2
80.94
1
80.94
11.14
0.00450
2
22.02
0.000289
x3 x1
160.07
1
160.07
Residual
7.27
15
7.27
Lack of fit
8.75
10
8.75
Pure error
4.30
5
4.30
799.21
19
x2
Total r2
Adjusted r2
0.9148
analysis was also carried out for validating the model accuracy (Myers & Montgomery 2002). Identification of the outliers was performed by examining the internally studentised residuals. The residual should be approximately normal with mean zero and unit variance. Figure 4 shows
© Forest Research Institute Malaysia
245
2.04
0.224
0.9582
that none of the studentised residuals had value higher than 2. To validate the model further and check the outliers, the r-studentised values were calculated (Table 3). All the values were within -2.5 to +2.5 (values between –3 and +3 were the acceptable limit), thereby validating the model.
Journal of Tropical Forest Science 24(2): 241–248 (2012)
Zaidon A et al.
80
PL (%)
72 64 56 48
Figure 1
24.0
6.89
26.4
(%)
28.8
PC
31.2
33.6
36.0
40
4.21
5.11
7.79
6.00 PCT (hours)
3D-surface plot of polymer loading (PL) in compreg wood as a function of phenol formaldehyde concentration (PC) and pre-curing time (PCT) at a fixed value of 80% compression ratio
90.0
PL (%)
80.0 70.0 60.0 50.0
Figure 2
24.0
26.4
%)
83.6 28.8
PC (
31.2
33.6
36.0
40.0
74.0
76.4
78.8
86.0
81.2 CR (%)
3D-surface plot of polymer loading (PL) in compreg wood as a function of phenol formaldehyde concentration (PC) and compression ratio (CR) at a fixed value of six hours pre-curing time
CONCLUSIONS Response surface methodology was successfully applied to determine the optimal operational conditions for maximum PL in compreg E. diadenum wood. A quadratic model in terms of PC, PCT and CR was developed. The experimental values were in good agreement with predicted ones and the model was highly significant with correlation coefficient of
© Forest Research Institute Malaysia
246
0.915. The independent variable did not show any significant effect on polymer loading. Interactions between PC and PCT, PC and CR, and PCT and CR were negligible. Maximum polymer loading was achieved when treated with 36% phenol formaldehyde solution and 74% compression ratio. The minimum polymer loading in the wood was found to be treatment with 20% PF concentration and 85% CR, with a value of 40.3%. At each centre point of the
Journal of Tropical Forest Science 24(2): 241–248 (2012)
Zaidon A et al.
64
PL (%)
62 60 57
4.21
rs)
74.05
75.75
77.45
79.15
80.85
85.95 84.25 82.55 %)
CR (
3D-surface plot of polymer loading (PL) in compreg wood as a function of pre-curing time (PCT) and compression ratio (CR) at a fixed value of 30% phenol formaldehyde concentration
Normal % probability
Figure 3
(hou
5.11
PCT
6.00
6.89
7.79
55
99 95 90 80 70 50 30 20 10 5 1
-3.00
-2.00
-1.00
0.00
1.00
2.00 2.00
Internally studentised residual
Figure 4
Studentised plot showing normal % probability versus internally studentised residuals
REFERENCES
independent variables, which were PC 30%, PCT 6 hours and CR 80%, the optimal polymer loading was in the range of 57–60%.
ACKNOWLEDGEMENTS The authors wish to thank Universiti Putra Malaysia for providing Research University Grant Scheme (RUGS) to finance this research. © Forest Research Institute Malaysia
247
Aghaie E, Pazouki M, Hosseini MR, Ranjbar M & Ghavipanjeh F. 2009. Response surface methodology (RSM) analysis of organic acid production for kaolin beneficiation by Aspergillus niger. Chemical Engineering Journal 147: 245–251. Ceylan H, Kubilay S, Aktas N & Sahiner N. 2008. An approach for prediction of optimum reaction conditions for laccase-catalysed bio-transformation of 1-nalphtol by response surface methodology (RSM). Bioresource Technology 99: 2025–2031.
Journal of Tropical Forest Science 24(2): 241–248 (2012)
Zaidon A et al.
Elibol M. 2004. Optimization of medium composition for actinorhodin production by Streptomyces coelicolor A3(2) with response surface methodology. Process Biochemistry 39: 1057–1062. Furuno T, Imamura Y & Kajita H. 2004. The modification of wood by treatment with low molecular weight phenolformaldehyde resin: properties enhancement with neutralized phenolic-resin and resin penetration into wood cell walls. Wood Science and Technology 37: 349–361. Hill Cas. 2006. Wood Modification: Chemical, Thermal and Other Processes. John Wiley and Sons, London. Inoue M, Norimoto M, Otsuka Y & Yamada T. 1991. Surface compression of coniferous lumber. III. Permanent set of the surface compression layer by water solution low molecular weight phenolic resin. Mokuzai Gakkaishi 37: 234–240. Li X, Li Y, Zhong Z, Wang D, Ratto JA, Sheng K & Sun XS. 2009. Mechanical and water soaking properties of medium density fiberboard with wood fiber and soybean protein adhesive. Bioresource Technology 100: 3556–3562. M yers Rh & M ontgomery Dc. 2002. Response Surface Methodology. John Wiley and Sons, New York. R oriz Ms, O sma Jf, T eixeira Ja & C outo SR. 2009. Application of response surface methodological approach to optimize reactive black 5 decolouration by crude laccase from Trametes pubescens. Journal of Hazardous Materials 169: 691–696. R owell RM. 2005. Chemical modification of wood. In Rowell RM (ed) Handbook of Wood Chemistry and Wood Composites. CRC Press, Florida.
© Forest Research Institute Malaysia
248
Rowell RM & Konkol P. 1987. Treatments That Enhance Physical Properties of Wood. Forest Products Laboratory General Technical Report No. 55. US Department of Agriculture, Forest Service, Madison. Shams Mi & Yano H. 2004. Compressive deformation of wood impregnated with low molecular weight phenol formaldehyde (PF) resin II: effects of processing parameters. Journal of Wood Science 50: 343–350. Shams Mi & Yano H. 2011. Compressive deformation of phenol formaldehyde (PF) resin-impregnated wood related to the molecular weight of resin. Wood Science and Technology 45: 73–81. Wang K & Lam F. 1999 Quadratic RSM models of processing parameters for three-layer oriented flakeboards. Wood Fiber Science 31: 173–186. Yano H, Hirose A, Collings Pj & Yazaki Y. 2001. Effects of matrix substances as a pretreatment in the production of high strength resin-impregnated wood based materials. Journal of Material Science Letters 20: 1125–1126. Z aidon A. 2009. Improvement of raw materials from underutilised timber species through chemical and densification treatments for value added laminated products. End of report submitted to the Ministry of Science and Technology, Malaysia. Z aidon A, B akar ES & P aridah MT. 2010. Compreg laminates made from low density tropical hardwoods. Proceedings of the International Convention of Society of Wood Science and Technology and United Nations Economic Commission for Europe Timber Committee. 11–14 October 2010, Geneva.