Int. J. Emerg. Sci., 2(3), 433-454, September 2012 ISSN: 2222-4254 © IJES
Experimental Study on Optimization of Thermal Properties of Groundnut Shell Particle Reinforced Polymer Composites G. U. Raju1*, V. N. Gaitonde2, S. Kumarappa3 1
Department of Mechanical Engineering, B. V. B. College of Engineering and Technology, Hubli-580 031, Karnataka, India Tel: +91 836 2378275; Fax: +91 836 2374985 2 Department of Industrial and Production Engineering, B.V.B. College of Engineering and Technology, Hubli-580 031, Karnataka, India, Tel: +91 836 2378275; Fax: +91 836 2374985; 3 Bapuji Institute of Engineering and Technology, Davangere-577 004, Karnataka, India
[email protected],
[email protected],
[email protected]
Abstract Recently, thermoplastic and thermoset polymers are combined with natural fillers to produce the composites, which possess better strength and good resistance to fracture. Due to an excellent property profile, these composites find wide applications in packaging, building and civil engineering fields. The present work aims to elucidate the optimization of thermal properties such as thermal conductivity, linear thermal expansion and specific heat of groundnut shell particles reinforced polymer composite materials. The composite specimens were prepared with different weight percentages of randomly distributed groundnut shell particles in polymer matrix. The experiments were planned as per Taguchi L9orthogonal array. The analysis of means (ANOM) was performed to determine the optimal parameter levels and analysis of variance (ANOVA) was employed to identify the level of importance of the parameters on each of the properties. TGA and DSC analyses were also carried out to ascertain the thermal stability of these composites. The results revealed that using groundnut shell particles as reinforcement for polymer matrix could successfully develop beneficial composites and can be used for thermal applications. Keywords: Groundnut shell particles, Polymer resin, Thermal properties, Taguchi design, TGA, DSC
1 INTRODUCTION Due to increased environmental consciousness throughout the world the application of natural fibers has drawn much attention in different engineering fields. The make use of natural fibers as reinforcing materials in thermoplastics and thermoset matrix composites provides optimistic environmental profits with regard to ultimate disposability and better use of raw materials. The natural fibers are now believed to be
433
G. U. Raju, V. N. Gaitonde, S. Kumarappa
as an option to synthetic fibers such as glass fiber, carbon fiber, etc. Presently, lignocellulosic bio-fibers as reinforcing materials are being utilized widely for the manufacture of cost effective eco-friendly bio-composites. Due to better strength properties such as easy availability, light weight, high toughness, non-corrosive nature, low density, low cost, good thermal properties, reduced tool wear, less dermal and respiratory irritation, less abrasion to processing equipment and renewability the natural fibers are preferred over synthetic fibers and hence find wide applications in different industries. In recent years, major industries such as automotive, construction and packaging industries have shown enormous interest in the development of new biocomposite materials and are currently engaged in searching for new and alternate products to synthetic fiber reinforced composites. Many authors have reviewed the latest developments in the application of natural fibers [1-4]. The widespread investigations on the preparation and properties of thermoset and thermoplastic composites with the application of natural fibers such as kenaf [5-6], jute [7-8], sisal [9-10], bagasse [11], bamboo [12], pineapple [13], rice husk [14] and groundnut shell[15] have also been carried out. The natural fibers are used for variety of appliances such as packaging, low-cost housing and structures and the use of agricultural crop residues could progress rural agriculture based economy. The various thermal properties such as thermal conductivity, diffusivity and specific heat of polyester/ natural fiber (banana/sisal) composites were investigated by Idicula et al. [16] as the function of filler concentration and fibre surface treatments. It was observed that the composite thermal contact resistance decreases with chemical treatment of the fibres. The heat transport ability of the compositewas also improved due to hybridization of natural fiber with glass. The banana/sisal fiber-polyester composites with 20 and 40-volumepercentage of fibers have thermal conductivity of 0.153-0.140 W m−1 K−1 and specific heat of 1199-1246 J kg−1 K−1 respectively were observed. The developed sodium hydroxide treated fiber composites showed 43% higher thermal conductivity than the untreated fiber composites. It was also noticed in their study that the variation of specific heat is not so significant. Behzad and Sain [17] studied the transverse and in-plane thermal conductivities for oriented and randomly oriented composites for several volume fractions of fibers in hemp fiber reinforced composites. It was found that the orientation of fibers has a noteworthy influence on thermal conductivity of composites. Li et al. [18] determined various thermal properties, namely, thermal conductivity, thermal diffusivity and specific heat of flax fiber–HDPE biocomposites around 170–200oC temperature range. The thermal conductivity, thermal diffusivity and specific heat found to be decrease with increased fiber content, however there is no appreciable change in thermal conductivity as well as thermal diffusivity in the specified temperate range. Conversely, the specific heat of flax fiber–HDPE composites steadily increased with temperature. Thermal properties like thermal conductivity and thermal diffusivity of oil-palmfiber-reinforced composites with and without alkali treatment at room temperature were analyzed by Agrawal et al. [19] using transient plane source technique. The study showed that the treatments employed, namely, saline alkali and acetylation of fibers
434
International Journal of Emerging Sciences 2(3), 433-454, September 2012
increased the proposed thermal properties of oil-palm-fiber-reinforced composites. It was reported that the saline alkali treated fiber has superior polarity due to the formation of silonal group on the surface and hence resulting in elevated thermal conductivity of saline treated composites. The alkalization treatment eliminates impurities and enhances the fiber surface adhesion characteristic with the resin and gives to a superior thermal conductivity. On the other hand, the acetylation to some extent increased the polarity of the fiber with minor increasing thermal conductivity of the oil-palm-fiber-reinforced composites. Agarwal et al. [20] assessed the thermal conductivity as well as thermal diffusivity properties of banana-fiber reinforced polyester composites with the addition of glass fiber. They found that, even though the thermal conductivity increased when compared to polymer matrix, but the thermal conductivity decreases with increased percentage of glass fiber compared to pure banana fiber composites. Alsina et al. [21] estimated the thermal properties of jute-cotton, sisal-cotton and ramie-cotton hybrid fabric reinforced unsaturated polyester composites. The volume fractions of ramie, sisal and jute fibers in the fabrics were found to be 0.77, 0.69, and 0.64 respectively. The results showed that sisal-cotton hybrid polyester composites have thermal conductivity 0.213-0.25 W/m-k and specific heat of 1.065-1.236 J/cm3 oC; Jute-cotton hybrid polyester composites have thermal conductivity 0.10-0.237 W/m-k and specific heat of 0.869-1.017 J/cm3 oC; Ramie-cotton hybrid polyester composites have thermal conductivity 0.19-0.22 W/m-k and specific heat of 0.839-0.894 J/cm3 oC. A major deficiency in the natural fiber-plastic composites is the poor bonding between the natural fiber and the plastic, mainly due to dissimilar chemical nature of both the materials. The natural fiber surface is hydrophilic and that of the plastic is hydrophobic. Hence, in order to have enhanced mechanical and thermal properties, it is essential to apply hydropobicity to natural fibers by appropriate treatments to the composites. Recent studies showed that surface modification techniques, namely, chemical treatments, acetylation and graft co-polymerisation are used to overwhelm the incompatible surface polarities between the natural fiber and the polymer matrix. The chemical treatment permits a better make contact with fiber-matrix and diminishes the thermal contact resistance significantly [16]. It has been reported that NaOH chemical treatment of fiber allows major increase of thermal and mechanical properties of composites [15, 22-24]. The treatment with NaOH eliminates almost all non-cellulose components except waxes. By the dissolution of lignin by alkali, some pores are formed on the surface of fiber, which progresses the contact area between the fiber and the matrix. The natural fiber-plastic composites found numerous applications in automotive sector, building and construction, even though these materials have poor compatibility between hydrophilic natural fibers and hydrophobic polymer matrices. As per authors‟ information, no investigation has been discussed in the literature on optimization of thermal properties of groundnut shell particles reinforced polymer composite materials. Hence, an attempt has been made in this paper to optimize the thermal properties of groundnut shell particles reinforced polymer composite (GSPC) materials using
435
G. U. Raju, V. N. Gaitonde, S. Kumarappa
Taguchi technique. The novel bio-based composite materials were prepared from groundnut shell particles in polymer matrix. Taguchi L9 orthogonal array was used to conduct the experiments. The analysis of means (ANOM) was employed to identify the optimal level of each parameters and the analysis of variance (ANOVA) was used to find the relative importance among the parameters.
2 MATERIALS AND METHOD 2.1 Groundnut Shell
Groundnut botanically known as Arachishypogeae belongs to Leguminosae family. It is the fourth largest oilseed produced in world and India is the second largest producer of groundnut after China. In India, groundnut is the largest oilseed in terms of production and accounted for about 7.5 million tons during 2009-10. A complete seed of groundnut is called as pod and outer layer of groundnut is called shell. Groundnut shell chemical composition is compared with some of the available natural fibers and is shown in Table 1. The hemicelluloses content of the fiber is found to be 18.7%, cellulose 35.7%, lignin 30.2% and ash content 5.9%. Lignin is often called the cementing agent that binds individual fiber cells together. The lignin content of groundnut shell fiber is much greater than that of banana, baggase, rice husk, jute, hemp, kenaf and sisal fibers. The hemicellulose is accountable for substantial amount of moisture absorption. The hemi cellulose content of groundnut shell is less than wood, banana, baggase, rice husk and kenaf fibers. Pre-treated groundnut shell is used in this study to modify the surface properties to ensure interfacial interactions between the particles and the resin. Table 1.Chemical composition of natural resources.
Species
Cellulose (wt%)
Hemicellulose (wt%)
Lignin (wt%)
Ash (wt%)
Reference
Pine (softwood) Maple (hardwood) Banana Coir Sisal Jute Kenaf Hemp Bagasse Groundnut shell Rice husk Pineapple
40-45 45-50 63-64 32-43 63-64 61-71.5 31-39 70.2-74.4 40-46 35.7 31.3 81
25-30 22-30 19 0.15-0.25 12 12-20.4 21.5 17.9-22.4 24.5-29 18.7 24.3 -
26-34 22-30 5 40-45 10-14 11.8-13 15-19 3.7-5.7 12.5-20 30.2 14.3 12.7
2 1.5-2.4 5.9 23.5 -
[15] [15] [16] [25] [25] [26] [26] [26] [27] [15] [28] [16]
436
International Journal of Emerging Sciences 2(3), 433-454, September 2012
2.2 Polymer Resins
In the present study three different polymer resins, namely, epoxy, vinyl ester and polyester were used as matrix materials. Epoxy resin is a polymer containing two or more epoxy groups and has high mechanical properties due to its low shrinkage and relatively unstressed structures. Epoxy resin system exhibits extremely high resistance alkali, good acids and solvent resistance. It has good electrical properties over a range of frequencies and temperature. The cured epoxy systems generally exhibit good dimensional stability, thermal stability and exhibit resistance to most fungi. They are self-excellent moisture barriers exhibiting low water absorption and moisture transmission. The epoxy of grade LY554 and hardener HY951 was used with the weight ratio of 10:1 to prepare the composite specimens. Vinyl ester resin exhibits a polyester resin type of cross-linking molecules in the bonding process and is tougher and more resilient than polyesters. A vinyl ester resin has excellent physical and mechanical properties and is familiar for its versatility as a composite matrix. The processability of vinyl ester resin at low temperatures has drawn substantial responsiveness from the composite industry. The vinyl ester of grade GR 200-60 was used with hardener, catalyst and accelerator with 1.5-wt % to prepare the composite specimens. Polyester resin is usually used as matrix material in polymer composites, for instance fiber-reinforced plastics and polyester concrete. Polyester resins have good range of mechanical properties. Polyester resin is durable, comparatively inexpensive, superior corrosion resistance and little weight. The polyester of grade PxGp 002 and the catalyst benzoyl peroxide with prescribed proportion was used to develop the composite specimens. 2.3 Taguchi Technique
Taguchi technique is a powerful methodology to contract with the response controlled by the number of parameters. Taguchi design is applied to devise the experimental layout, examine the effect of each parameter and to determine the optimal level of each identified parameter. Taguchi design utilizes an orthogonal array to study the whole space with minimum number of experiments [29, 30] and hence it is achievable to condense time and cost of the experimental research. Taguchi method consists of plan of experiments, in which the factors are situated at different rows in an intended orthogonal array. An orthogonal array provides more consistent estimates of factor effects with little number of experiments, when compared to conventional methods. Depending on number of factors and identified levels of each factor, an appropriate array is chosen [29, 30]. Each column of the orthogonal array delegates a parameter and its setting levels in each experiment and each row entrusts an experiment with the level of several parameters in that experiment. After performing the experiments as per orthogonal array (OA), the results are converted into signal to noise (S/N) ratio data. In Taguchi technique, the term „signal‟
437
G. U. Raju, V. N. Gaitonde, S. Kumarappa
represents desirable value (mean) and „noise‟ represents undesirable value (standard deviation) for the response. Therefore, S/N ratio is the mean to standard deviation, which specifies the degree of predictable performance of a product or process in the existence of noise factors [29, 30]. The S/N ratio is used to measure the performance characteristics and to identify the important parameters through analysis of variance (ANOVA). Taguchi classifies objective functions into three categories, namely, smaller the better type, larger the better type and nominal the best type [29, 30]. The optimum level for a factor is the level, which results in highest S/N ratio value in the experimental space.
3 EXPERIMENTAL DETAILS Clean and dried groundnut shells were initially washed with water to take away the sand and other impurities. The washed shells were later chemically treated with 10% NaOH solution for 2 hours and then washed with distilled water until all NaOH gets eliminated. Subsequently, the shells were solar dried and ground. Then the particles were sieved through 0.5, 1 and 1.5 mm BS sieves to get different size groundnut shell particles. These particles are used as reinforcement material in polymer matrix. 3.1 Preparation of Composite Boards A mould with the dimension of 130 mm in diameter and 10 mm thick was used to prepare the composite specimen. A layer of wax was applied to the mould so that the specimen can be easily taken out of the mould. Measured quantities of groundnut shell particles and resin were taken in a plastic container and stirred thoroughly to get homogeneous mixture. After adding the suitable quantity of hardener and catalyst, the mixture was again stirred for 10 minutes and thoroughly mixed mixture was placed in the mould and compressed uniformly. This set up allowed for curing and then the composite specimen was taken out from the mould. Curing time was different for different resins. Groundnut shell particles reinforced polymer composite (GSPC) specimens were prepared by varying three parameters, namely, particle size, weight percentage of reinforcement material and matrix material. 3.2 Orthogonal Array Selection In the present study, particle size, weight percentage of reinforcement material and matrix material are selected as the process parameters, which affect the thermal properties, namely, thermal conductivity, linear thermal expansion and specific heat of groundnut shell particles reinforced polymer composite materials. Each parameter was examined at three levels to study the non-linearity effect of the process parameters. The
438
International Journal of Emerging Sciences 2(3), 433-454, September 2012
selected process parameters and their levels are given in Table 2. In the present investigation, with three parameters at three levels each, L9 (34) orthogonal array (OA) [29, 30] is used and accordingly nine GSPC specimens were prepared as per the experimental layout plan (Table 3). Table 2.Process parameters and their levels selected for the preparation of GSPC specimens.
Levels
Code
Parameters
A B C
Particle size (mm) Groundnut shell particle (wt %) Polymer resin
1
2
3
0.5 20 Epoxy resin
1 40 Vinyl ester
1.5 60 Polyester resin
Table 3.Experimental layout plan and thermal properties.
Levels of process parameter settings Thermal properties Trial Particle Groundnut Polymer Thermal Linear thermal Specific no. size shell particle resin conductivity expansion 10-5 heat (A) (B) (C) (W/m-K) (/ 0C) (J/kg-K) 1 2 3 4 5 6 7 8 9
1 1 1 2 2 2 3 3 3
1 2 3 1 2 3 1 2 3
1 2 3 2 3 1 3 1 2
0.2545 0.1956 0.2061 0.2580 0.1703 0.1918 0.3140 0.1983 0.1262
10.43 5.33 4.62 5.29 4.19 3.69 3.46 3.36 3.25
1410.58 1043.02 1805.06 1448.36 2446.09 2188.08 1950.01 2099.78 1452.02
3.3 Thermal Conductivity Test A circular disc shaped specimen of size 130 mm in diameter and 10 mm thick was prepared for each of the trials as per the layout plan of OA. For measuring the thermal conductivity of composites, the method presented in Behzad and Sain [17] was used. The experimental setup consists of heating element, connected to a conducting material of same size as that of the specimen. Three thermocouples were connected to the specimen at different points. The entire setup was placed in a thermally insulated evacuated chamber in order to prevent loss of heat from specimen. The heat supplied was maintained constant until steady state is reached and then temperature at the thermocouples was noted using digital temperature indicator. The thermal conductivity was determined, measuring temperatures, heat supplied and area of the specimen by using a discrete approximation of Fourier‟s law for one dimensional heat conduction, given by:
439
G. U. Raju, V. N. Gaitonde, S. Kumarappa
Q KA
dT dx
(1)
where, Q: Heat dissipated through the plate; K: thermal conductivity of the composite plate; A: surface area of the specimen; dT : temperature difference (T1-T2); dx : thickness of the disc. The validation of the test was done through measuring the thermal conductivities of known materials such as neat epoxy, neat vinyl ester and neat polyester. It was observed that the determined thermal conductivity values substantiate the standard values with the greatest accuracy. The thermal conductivity for each trial of an orthogonal array was obtained by averaging five measurements at various positions of the prepared specimen and the mean values of the nine trials are presented in Table 3. 3.4 Linear Thermal Expansion Test Each specimen of size 150 40 10 mm3 was prepared as per the layout plan of OA for carrying out the linear thermal expansion test. The experimental setup consists of heater and conductive material such as aluminum plate. The specimen was kept over the plate and dial gauges were placed at the ends of the specimen at different points to measure the deflection. Thermocouples were placed in the specimen and are connected to the temperature-measuring instrument. The initial temperature of the specimen was recorded and then heated uniformly. For the increase in temperature, corresponding deflection of the specimen was recorded at equal intervals. The coefficient of thermal expansion of GSPC specimens was determined by averaging five readings and using the following formula: L L0 ( 1 t ) (2) where, L0and L:initial and final length of the specimen at temperatures Ti and Tf; α : coefficient of thermal expansion; Ti and Tf: initial and intermediate temperatures of the specimen; t = (Tf - Ti) temperature difference. The linear thermal expansion for each trial of an orthogonal array was obtained by averaging five measurements at various positions of the prepared specimen and the mean values of the nine trials are summarized in Table 3. 3.5 Specific Heat Test The spherical shaped composite specimen of size 30 mm diameter was prepared for each of the trials of the experimental layout plan (Table 3).Three thermocouples were placed at different depths and positions of the specimens and are connected to the temperature indicator. The specimen was placed in a thermally insulated evacuated chamber and the specific heat of each GSPC specimen was calculated by measuring heat supplied, change in temperature and mass of the specimen using the formula:
440
International Journal of Emerging Sciences 2(3), 433-454, September 2012
Cp
Q T * m
(3)
where, Q: heat supplied; δT: change in temperature (Tf – Ti); m: mass of the specimen. The specific heat for each trial of an OA was obtained by averaging five measurements at various positions of the prepared specimen and the mean values of the nine trials are illustrated in Table 3.
4 ANALYSIS OF DATA, RESULTS AND DISCUSSION Table 3 summarizes the experimental results of thermal conductivity, linear thermal expansion and specific heat of groundnut shell particles reinforced polymer composite materials. It is observed that the GSPC materials have thermal conductivities in the range 0.1262 and 0.3140 W/m-K. The specimens having epoxy matrix with particle size of 1 mm and highest weight (60%) of filler material decreases the thermal conductivity. However, the specimens having vinyl ester matrix with 1.5 mm particle size and highest weight (60%) of particle shows decreased thermal conductivity. On the other hand, polyester matrix composites with medium ranges of particle size (1 mm) and 40% filler material exhibit lower thermal conductivity. Decrease in thermal conductivity for higher filler loading is due to the lower thermal conductivity of groundnut shell particle filler material. Several researchers [16, 31] were also observed similar behaviour of composites. From Table 3, it is seen that the specimens have linear thermal expansion ranging from 3.2489 10-5 to 10.4310 10-5 /°C. It has been observed that decreased weight % of particle increases the coefficient of linear thermal expansion for epoxy as well as vinyl ester matrix composites. This behavior is possibly due to lower thermal expansion of filler material than the epoxy and vinyl ester matrix. However, polyester matrix composite exhibits increased linear thermal expansion with increase in weight percentage of particles. It was also found that linear thermal expansion of composite specimen is more for smaller the grain size of the groundnut shell particles for all the polymer resins considered in the study. The results of the specific heat capacity of different groundnut shell particle reinforced polymer composite specimens (Table 3) revealed that the specific heat capacity of GSPC specimen is high for 1 mm grain size for all the polymer resins specified. The specific heat capacity is also high for 60-wt% of particles in case of epoxy and vinyl ester resins; whereas higher heat capacity is observed for 40-wt% of particles for polyester resin. 4.1 Analysis of Experimental Data Based on S/N Ratio
441
G. U. Raju, V. N. Gaitonde, S. Kumarappa
In Taguchi design, the S/N ratio analysis has been carried out to determine the optimal parametric condition for each of the thermal properties considered. In our present investigation, to obtain the optimal operating parameters, smaller the better type category is used for thermal conductivity and linear thermal expansion; whereas larger the better type is employed for specific heat.
1 n 2 yi ] n i1
(4)
1 n 2 yi ] n i1
(5)
S/N ratio for smaller-the-better type category is 10 log 10 [ S/N ratio for larger-the-better type category is 10 log 10 [
where, y is the response and n is the number of replications for each trial i. The computed values of S/N ratio (η) for each trial of L9OA for each of the thermal properties are demonstrated in Table 4. Table 4.Computed values of S/N ratios for thermal properties.
S/N ratio (dB) for thermal properties Trial no.
Thermal conductivity
Linear thermal expansion
Specific heat
1 2 3 4 5 6 7 8 9
11.8862 14.1726 13.7184 1.7676 15.3757 14.3430 10.0614 14.0535 17.9788
-20.3657 -14.5345 -13.2928 -14.4691 -12.4443 -11.3405 -10.7815 -10.5268 -10.2377
62.9880 60.3659 65.1298 63.2175 67.7694 66.8013 65.8007 66.4435 63.2395
4.2 Analysis of Means and Analysis of Variance The data analysis using Taguchi design entails analysis of means (ANOM) and analysis of variance (ANOVA). The process of determining the direct effects of each variable is the ANOM and the effect of a parameter level is the deviation it causes from the overall mean response [29].The S/N ratio for each process parameter level is determined by averaging the S/N ratios when the parameter is kept at that level. The ANOM helps in identifying the optimal factor combinations. On the other hand, ANOVA ascertains the comparative importance of the parameters in terms of % contribution to the response [29, 30]. ANOVA is also required for determining the error variance for the effects and variance of prediction error. This is to be accomplished by separating the total
442
International Journal of Emerging Sciences 2(3), 433-454, September 2012
variability of S/N ratio, which is measured by sum of squared deviations from the total mean S/N ratio, into contributions by each of the design parameters and the error [29, 30]. The % contribution designates the relative power of a parameter to diminish variation. For a parameter with a high % contribution with a small variation has a huge control on the response. 15.5
S/N ratio for thermal conductivity (dB)
15 14.5 14 13.5 13 particle size wt % of filler material
12.5
polymer resin overall mean
12 11.5 11
1
2 Level
Figure 1.Response graph of S/N ratio for thermal conductivity.
443
3
G. U. Raju, V. N. Gaitonde, S. Kumarappa
-10
S/N ratio for linear thermal expansion (dB)
-11
-12
-13
-14 particle size wt % of filler material -15
polymer resin overall mean
-16
-17
1
2 Level
3
Figure 2.Response graph of S/N ratio for linear thermal expansion.
The results of ANOM are represented in response graphs (Figures 1, 2, and 3). The level of a process parameter with highest signal to noise (S/N) ratio value is the optimum level. As seen in Figure 1,the optimal combination of process parameter settings for minimizing the thermal conductivity of groundnut shell particles reinforced polymer composite is A3, B3 and C2 i.e. the specimen having particle size of 1.5 mm with 60-wt% of particles using vinyl ester as the matrix material. Figure 2presents the optimal combination of process parameter settings for minimizing the linear thermal expansion of groundnut shell particles reinforced polymer composite, which is given by A3, B3 and C3 i.e. the specimen having particle size of 1.5 mm with 60-wt% of particles using polyester resin as the matrix material. On other hand, as demonstrated in Figure 3, it was found that the optimal combination process parameter settings for maximizing the specific heat of groundnut shell particles reinforced polymer composite is A2, B3 and C3 i.e. the specimen having particle size of 1.0 mm with 60-wt% of particles using polyester resin as the matrix material. However, the comparative magnitude among the process parameters has to be investigated through the ANOVA.
444
International Journal of Emerging Sciences 2(3), 433-454, September 2012
66.5 particle size wt % of filler material
66
polymer resin overall mean
S/N ratio for specific heat (dB)
65.5 65 64.5 64 63.5 63 62.5 62
1
2 Level
3
Figure 3.Response graph of S/N ratio for specific heat.
Tables 5-7 present the summary of ANOVA results for thermal conductivity, linear thermal expansion and specific heat of groundnut shell particles reinforced polymer composite materials. From Table 5, it can be seen that the % of filler material has major influence (67.39%) on minimizing thermal conductivity and the vinyl ester matrix material has less effect (9.81%), whereas the particle size does not have significant effect in minimizing thermal conductivity. On the other hand, the particle size has more contribution (58.12%) for minimizing thermal expansion followed by the % of filler material (25.98%). However, the polyester resin matrix has the least effect for minimizing thermal expansion as shown in Table 6. It is clear from Table 7 that, the polyester resin matrix material is the most dominant significant parameter (59.13%) and the particle size (35.35%) has the moderate effect to maximize the specific heat. Table 5.Summary of ANOVA on S/N ratio for thermal conductivity.
Source
Degrees of freedom
Sum of squares
Mean square
% contribution
Particle size (A) Groundnut shell particle (B) Polymer resin (C)
2 2 2
0.9617 28.3997 4.1315
0.4809 14.1998 2.0658
2.28 67.39 9.81
445
G. U. Raju, V. N. Gaitonde, S. Kumarappa
Error Total
2 8
8.6483 42.1412
4.3242 5.2677
20.52 100
Table 6.Summary of ANOVA on S/N ratio for linear thermal expansion.
Source
Degrees of freedom
Sum of squares
Mean square
% contribution
Particle size (A) Groundnut shell particle (B) Polymer resin (C) Error Total
2 2 2 2 8
46.7677 20.9095 5.4463 7.3507 80.4742
23.3838 10.4548 2.7232 3.6754 10.0593
58.12 25.98 6.76 9.14 100
Table 7.Summary of ANOVA on S/N ratio for specific heat.
Source
Degrees of freedom
Sum of squares
Mean square
% contribution
Particle size (A) Groundnut shell particle (B) Polymer resin (C) Error Total
2 2 2 2 8
15.6541 1.8868 26.1890 0.5569 44.2868
7.8271 0.9434 13.0945 0.2785 5.5359
35.35 4.26 59.13 1.26 100
4.3 Verification of Experiments Once the optimal levels of the process parameters have been identified for each of the thermal properties, the next step is to predict and verify the performance characteristic using the optimal level of design parameters [29, 30]. The predicted optimum value of S/N ratio (ηopt) of the response is determined by the formula [29, 30]: k1
opt m [( mi , j )max - m ]
(6)
j 1
where, m is the overall mean of S/N ratio; (mi,j)max is the S/N ratio of optimum level i of factor j and k1 is the number of main design parameter that affect the response. In order to see the closeness of observed value of S/N ratio (ηobs)with that of the predicted value (ηopt), the confidence interval (CI) value of ηopt for the optimum parameter level combination at 95% confidence level is calculate, given by [30]:
CI F( 1,e )Ve (
1 1 ) neff nver
446
(7)
International Journal of Emerging Sciences 2(3), 433-454, September 2012
where, F( 1 ,e ) is the F value for 95% confidence interval; e is the degrees of freedom
N ; N is the total trial number in 1 orthogonal array ; = degrees of freedom of k1 factors and nver is the confirmatory test trial number. If the error of prediction i.e. (ηopt–ηobs) is within CI value, then the optimum process parameter level combination and additive model for the variable effects are valid. Here, three validation experiments were conducted at optimal levels of process parameters for each of the thermal properties and the results of conformity tests are presented in Table 8. It is observed that the calculated value of prediction error of each of the thermal properties is within the confidence limit, thus clearly indicating the adequacy of the additivity of thermal property models. The best combinations of process parameters for achieving minimum thermal conductivity and thermal expansion and for maximum specific heat capacity along with the corresponding optimal values of thermal properties are exhibited in Table 9. for error; Ve is the variance of error; neff
Table 8.Results of the verification tests.
Performance measure
Thermal conductivity
Linear thermal expansion
Specific heat
Levels (A, B, C) S/N predicted( ηopt), dB S/N observed(ηobs), dB Prediction error, dB Confidence interval (CI), dB
3, 3, 2 16.6049 17.9788 1.3739 ±7.8880
3, 3, 3 -8.0912 -9.7144 1.6232 ±7.2722
2, 3, 3 67.9406 68.7776 -0.837 ±2.0018
Table 9. Best combination values of the process parameters and the corresponding optimal values of thermal properties.
Optimal process parameter settings Thermal Property Thermal conductivity Linear thermal expansion Specific heat
Optimal value
Particle size (mm)
Groundnut shell particle (wt%)
Polymer resin
1.5
60
Vinyl ester
0.1262 W/m-K
1.5
60
Polyester resin
3.06
1
60
Polyester resin
2747.13 J/kg-K
4.4 Thermo-Gravimetric Analysis (TGA)
447
10-5 / 0C
G. U. Raju, V. N. Gaitonde, S. Kumarappa
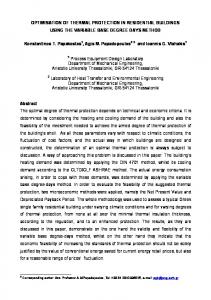
Thermo-gravimetric analysis (TGA) is employed to analyze the thermal stability of composites. Thermal stability is believed to be one of the limiting factors in the use of natural fibers when compared to synthetic fibers. Hence, thermal stability of groundnut shell particles reinforced polymer composite has been investigated in the current investigation. The TGA tests were performed for all the nine developed GSPC specimens as per ASTM E1131 standard. All the measurements were performed using TG analyzer instrument of high Resolution SDT Q600 V20.9. The samples weighing between 10 and 20mg were placed in a platinum pan and tests were performed within the temperature range of 20–700o C at a heating rate of 5o C/min under nitrogen atmosphere at flow rate of 50 ml/min. TG and DTG curves were exercised to study the high temperature degradation behavior of GSPC specimens. The combined thermogravimetric analysis (TGA) and differential thermal analysis (DTA) results of GSPC composites are depicted in Figures 4 and 5respectively. S1 to S9 represent the GSPC specimens prepared as per the trial numbers of an experimental layout plan of Table 3. Table 10.Thermal degradation data of GSPC specimens.
Onset End of Weight Speci degradation degradation loss mens temperature temperature (%) o o ( C) ( C)
Weight loss peak temperature (oC) †
Melting point temperature (oC) #
S1 118.63 440.59 72.79 375.19 114.44 S2 157.97 509.24 82.80 402.05 159.72 S3 116.32 486.90 67.84 321.42 112.74 S4 149.49 471.28 69.49 396.38 148.73 S5 143.86 447.96 72.60 325.25 145.03 S6 122.97 467.09 79.98 382.19 115.34 S7 118.40 435.43 66.90 325.01 113.35 S8 155.77 458.87 73.20 379.25 158.32 S9 164.30 477.36 78.09 404.44 162.12 †: Weight loss peak temperature determined from DTA thermograms. # Melting point temperature determined from DSC curves.
448
Residual char at 690oC (wt. %) 20.97 13.82 28.54 25.52 20.94 15.05 24,80 22.02 16.73
International Journal of Emerging Sciences 2(3), 433-454, September 2012
S1 S2 S3 S4 S5 S6 S7 S8 S9
100
Weight loss (%)
80
60
40
20
0 0
100
200
300
400
500
600
700
o
Temperature ( C)
Figure 4.TGA thermograms of GSPC specimens.
The TGA curves of GSPC specimens provide three distinct temperature regions, wherein the samples experience major weight loss. A small weight loss was observed during first region attributed to the evaporation of moisture [32, 33]. Actual degradation happens in second region attributed to the thermal degradation of hemicelluloses, cellulose and lignin [34, 35] together with polymeric matrix and thereafter the rate of decomposition was slow. These results are also confirmed by DTA curves wherein, it can be appreciated that most decomposition occurs at the temperature of 321 to 405°C (second region). Quantitative data in second region including onset thermal degradation temperature, end of degradation temperature, corresponding weight loss, weight loss peak temperatures and the char yields at 690 oC are presented in Table 10. As can be seen from TGA (Figure 4) and DTA (Figure 5) curves, the thermal decomposition initiation temperature is the lowest for S3 composite specimen (particle size of 0.5 mm, 60-wt% of filler material with polyester resin) exhibiting 116.32 oC and the highest of 157.53 oC for S9 composite specimen (particle size of 1.5 mm, 60-wt% of filler material with vinyl ester resin), indicating the higher thermal stability for S9 composite. On the other hand, it was observed that, S2 composite specimen (particle size of 0.5 mm, 40wt% of filler material with vinyl ester resin) is having subsequent higher thermal stability with 155.10oC onset degradation temperature. For S3 composite specimen, the
449
G. U. Raju, V. N. Gaitonde, S. Kumarappa
weight loss peak took place at a lower temperature of 321.42 oC, while it is the highest for S9 composite specimen occurred at 404.44oC. Thermal degradation of S3 composite specimen produced much higher charred residue of about 28.54 %. 1.0
S1 S2 S3 S4 S5 S6 S7 S8 S9
0.6
o
Derivative weight (%/ C)
0.8
0.4
0.2
0.0
-0.2 0
100
200
300
400
500
600
700
o
Temperature ( C)
Figure 5.DTA thermograms of GSPC specimens.
4.5 Differential Scanning Calorimetry (DSC) Test Differential scanning calorimetry (DSC) was performed using a DSC Q20 V24.4 (Universal V4.5A TA) instrument to determine the melting point of composites. The tests were performed from 27 to 400oC at a heating rate of 25oC/min in nitrogen atmosphere of 100 mL/min flow rate. The melting point temperature of composite was calculated from the main peak of endothermic curve plotted by DSC. The DSC thermographs of the samples were shown in Figure 6. As seen from Table 10, melting temperature of the GSPC materials is found to be around 112.74–162.12°C. It is also observed that, the melting temperature is the lowest for S3 composite (particle size of 0.5 mm, 60-wt% of filler material with polyester resin) exhibitiing112.74 oC and the highest temperature of 162.12 oC for S9 composite (particle size of 1.5 mm, 60-wt% of filler material with vinyl ester resin).
450
International Journal of Emerging Sciences 2(3), 433-454, September 2012
0.0
S1 S2 S3 S4 S5 S6 S7 S8 S9
-0.4
Heat flow (mW)
-0.8 -1.2 -1.6 -2.0 -2.4 -2.8 -3.2 25
50
75
100
125
150
175
200
225
250
o
Temperature ( C)
Figure 6. DSC curves of GSPC specimens.
5 CONCLUSIONS The present study highlights the application of Taguchi methodology to determine the best combination of process parameters for optimizing the thermal properties such as thermal conductivity, linear thermal expansion and specific heat of groundnut shell particles reinforced polymer composite materials. The composite specimens were prepared with different weight % of randomly distributed groundnut shell particles in polymer matrix. The experiments were planned as per Taguchi L9orthogonal array layout plan with particle size, % filler material and matrix material as the process parameters. The optimal conditions were identified using ANOM and the contribution of each process parameter in controlling the thermal properties was determined by ANOVA. From the analysis of results using S/N ratio and ANOVA, the following conclusions are drawn from the current investigation: 1. The ANOM results point out that the combination of higher particle size (1.5 mm) with higher wt% of filler material (60%) with polyester resin as the matrix material is beneficial for minimizing the thermal conductivity of groundnut shell particles reinforced polymer composite materials. The best combination of process parameter settings for minimal thermal expansion is particle size of 1.5 mm with 60-wt% of particles using polyester resin as the matrix material. On other hand, the optimal combination of process parameter settings for maximizing the specific heat of
451
G. U. Raju, V. N. Gaitonde, S. Kumarappa
2.
3. 4.
5.
groundnut shell particles reinforced polymer composite is particle size of 1mm with 60-wt% of particles using polyester resin as the matrix material. The ANOVA results revealed that the wt % of filler material has major contribution in minimizing both the thermal conductivity and thermal expansion. On the other hand, polyester resin matrix is the dominant factor, which maximizes the specific heat of groundnut shell particles reinforced polymer composite material. The particle size has also the noticeable effect on controlling the thermal expansion and specific heat. The confirmation results indicate that the additive models are adequate for determining the optimum thermal properties at 95% confidence interval. The groundnut shell as reinforcing material is an agricultural product; eco-friendly, non-toxic, low cost and easily available material as compared to conventional fibers like glass, kevlar, asbestos etc. Hence, this composite can be used as good alternate for wood in thermal applications such as thermal insulation and coatings. Thermal stability is valuable information required to manufacture more thermally stable composites, possibly with good fire resistance. The composite specimen of 1.5 mm particle, 60-wt% of filler material with vinyl ester resin has the higher thermal stability.
REFERENCES 1.
Mwaikambo. LY, Ansell MP, “Chemical Modification of Hemp, Sisal, Jute and Kapok Fibers by Alkalization”, Journal of Applied Polymer Science 2002; 84(12): 2222-2234.
2.
Mishra. S, Tripathy. SS, Misra. M, Mohanty. AK, Nayak. SK, “Novel Eco-Friendly Biocomposites: Biofiber Reinforced Biodegradable Polyester Amide Composites – Fabrication and Properties Evaluation”,Journal of Reinforced Plastics and Composites 2002;21(1): 55-70.
3.
Satyanarayana. KG, Sukumaran. K, Mukherjee. RS, Pavithran. C, Pillai. SGK, “Natural Fibre-Polymer Composites”,Journal of Cement and Concrete Composites 1990;12: 117-136.
4.
Bledzki. AK, Gassan. J, “Composites reinforced with cellulose based fibres”, Progress in Polymer Science1999;24: 221-274.
5.
Hirao. K, Inagaki. H, Nakamae. K, Kotera. M, Nishino. TK, “Kenaf Reinforced Biodegradable Composite”,Journal of Composites Science and Technology 2003;63: 12811286.
6.
Nor Azowa Ibrahim, KamarulArifinHadithon, KhalinaAbdan, “Effect of Fiber Treatment on Mechanical Properties of Kenaf Fiber Ecoflex Composites”,Journal of Reinforced Plastics and Composites2010;29: 2192-2198.
7.
Hinrichsen. G, Khan. MA, Mohanty. AK, “Influence of Chemical Surface Modification on the Properties of Biodegradable Jute Fabrics-Polyester Amide Composites”,Journal of Composites: Part A2000; 31(2): 143-150.
452
International Journal of Emerging Sciences 2(3), 433-454, September 2012
8.
AlokSatapathy, Alok Kumar Jha, SisirMantry, Singh. SK, AmarPatnaik, “Processing and Characterization of Jute-Epoxy Composites Reinforced with SiC Derived from Rice Husk”,Journal of Reinforced Plastics and Composites2010; 29 (18): 2869-2878.
9.
Joseph. PV, Kuruvilla. J, Thomas. S, “Effect of Processing Variables on the Mechanical Properties of Sisal-Fiber-Reinforced Polypropylene Composites”, Journal ofComposites Science and Technology 1999; 59(11): 1625-1640.
10. Bakare. IO, Okieimen. FE, Pavithran. C, Abdul Khalil. HPS, Brahmakumar. M, “Mechanical and thermal properties of sisal fiber-reinforced rubber seed oil-based polyurethane composites”, Materials and Design 2010; 31: 4274-4280. 11. Dominguez. VA, Kenny. JM, Vazquez. A, “Bagasse Fiber-Polypropylene Based Composites”, Journal of Thermoplastic Composite Materials 1999; 12(6): 477-497. 12. SmitaMohanty, Sanjay K. Nayak, “Short Bamboo Fiber-reinforced HDPE Composites: Influence of Fiber Content and Modification on Strength of the Composite”, Journal of Reinforced Plastics and Composites 2010; 29 (14): 2199-2212. 13. Mukherjee. PS, Satyanarayana. KG, “Structure and Properties of Some Vegetable Fibres Part 2 Pineapple Fibre”, Journal of Materials Science 1986; 21: 51-56. 14. Kim. HS, Yang. HS, Kim. HJ, Park. HJ, “Thermogravimetric Analysis of Rice Husk Flour Filled Thermoplastic Polymer Composites”,Journal of Thermal Analysis and Calorimetry 2004; 76: 395-404. 15. Raju. GU, Kumarappa. S, “Experimental Study on Mechanical Properties of Groundnut Shell Particle Reinforced Epoxy Composites”, Journal of Reinforced Plastics and Composites 2011; 30 (12): 1029-1037. 16. MariesIdicula, AbderrahimBoudenne. L, Umadevi, Laurent Ibos, Yves Candau, Sabu Thomas, “Thermophysical properties of natural fiber reinforced polyester composites”, Composites Science and Technology 2006; 66 (15): 2719-2725. 17. Behzad. T, Sain. M, “Measurement and prediction of thermal conductivity for hemp fiber reinforced composites”, Journal of Polymer Engineering and Science 2007; 47(7):977-983. 18. Xue. Li, Lope. G Tabil, Ikechukwuka. N Oguocha, SatyanarayanPanigrahi, “Thermal diffusivity, thermal conductivity, and specific heat of flax fiber–HDPE biocomposites at processing temperatures”, Journal of Composites Science and Technology2008; 68 (7): 1753-1758. 19. Agrawal. R, Saxena. NS, Sreekala. MS, Thomas. S, “Effect of treatment on the thermal conductivity and thermal diffusivity of oil-palm-fiber-reinforced phenol formaldehyde composites”, Journal of Polymer Science Part B: Polymer Physics 2000; 38(7): 916-921. 20. Agarwal. R, Saxena. NS, Sharma. KB, Thomas. S, Pothan. LA, “Thermal conduction and diffusion through glass-banana fiber polyester composites” Indian Journal of Pure Applied Physics 2003; 41(6): 448-452. 21. Alsina. OLS, de Carvalho. LH, Ramos Filho. FG, d Almeida. JRM, “Thermal properties of hybrid lignocellulosic fabric-reinforced polyester matrix composites”, Journal of Polymer Testing 2005;24: 81-85.
453
G. U. Raju, V. N. Gaitonde, S. Kumarappa
22. Mohanty. AK, Misra. M, Drzal. LT, “Surface modifications of natural fibers and performance of the resulting biocomposites: an overview”, Composite Interfaces 2001; 313343. 23. Abdelmouleh. M, Boufi. S, Belgacem. MN, Dufresne. A, “Short natural-fiber reinforced polyethylene and natural rubber composites: Effect of silane coupling agents and fibers loading”, Journal of Composites Science and Technology 2007; 67: 1627-1639. 24. MominulHaque. Md, Saiful Islam. Md, Sakinul Islam. Md, Nazrul Islam. Md, MonimulHuque. Md, “Physicomechanical properties of chemically treated palm fiber reinforced polypropylene composites”, Journal of Reinforced Plastics and Composites 2009; 29: 1734-1742. 25. Swamy. RP, Mohan kumar. GC, “Study of areca-reinforced phenol formaldehyde composites”, Journal of Reinforced Plastics and Composites 2004;23(13):1373-1382. 26. Mohanty. AK, Misra. M, Hinrichsen. G, “Biofibres, biodegradable polymers and biocomposites: an overview”, Journal of Macromolecular Materials and Engineering 2000; 276: 1-24. 27. John. Z Lu, Qinglin. Wu, Ioan. I, Negulescu. Yan Chen, “The influences of fiber feature and polymer melt index on mechanical properties of sugarcane fiber/polymer composites”, Journal of Applied Polymer Science” 2006; 102: 5607-5619. 28. Raveendran. K, Anuradda Ganesh. Kartic. C, Khilart, “Influence of mineral matter on biomass pyrolysis characteristics”, Journal of Fuel 1995; 74 (12): 1812-1822. 29. Phadke. MS, “Quality Engineering using Robust Design”,Prentice Hall, Englewood Cliffs, New Jersey, 1989. 30. Ross. PJ, “Taguchi Techniques for Quality Engineering”, McGraw-Hill, New York, 1996. 31. Ramanaiah. K, Ratna Prasad. AV, Hema Chandra Reddy. K, “Thermal and mechanical properties of waste grass broom fiber-reinforced polyester composites”, Materials and Design 2012; 40: 103-108. 32. Sharifah. HA, Martin. PA, “The effect of alkalization and fiber alignment on the mechanical and thermal properties of kenaf and hemp bastfibre composites: part 2 - cashew nut shell liquid matrix”, CompositeScience and Technology 2004; 64: 1231-1238. 33. Igor Maria De Rosa, Carlo Santulli, FabrizioSarasini, “Mechanical and thermal characterization of epoxy composites reinforced with random and quasi-unidirectional untreated Phormiumtenax leaf fibers”, Materials and Design2010; 31: 2397-2405. 34. Kim. HS, Yang. HS, Kim. HJ, Park. HJ, “Thermogravimetric Analysis of Husk Flour Filled Thermoplastic Polymer Composites”, Journal of Thermal Analysis and Calorimetry 2004; 76: 395-404.
35. Dobircau. L, Sreekumar. PA, Saiah. R, Leblanc. N, Terrie. C, Gattin. R, Saiter. JM, “Wheat flour thermoplastic matrix reinforced by waste cotton fibre: Agro-green-composites”, Journal of Composites: Part A 2009; 40: 329-334.
454