Journal of Chromatographic Science, Vol. 45, November/December 2007
Optimization of a High-Performance Liquid Chromatography Method for the Separation and Identification of Six Different Classes of Phenolics Dhirendra P. Singh1, R. Govindarajan1, Anakshi Khare2, and Ajay K. S. Rawat1,* Pharmacognosy and Ethnopharmacology Division, National Botanical Research Institute, Lucknow – 226 001, India and 2Chemistry, Lucknow University, Lucknow-226 001, India
Abstract Flavonoids are chemical moieties widely distributed in certain plants that are important biologically active constituents of a daily human diet, with significant pharmacological potential (antihepatotoxic, anti-allergic, anti-inflammatory, anti-osteoporotic, and anti-tumor activities). Thus keeping in view the importance of this class of compounds, a rapid method for the separation and identification of fifteen phenols belonging to six different types of phenolics in a sole analysis has been developed and validated using selectivity, precision, recovery, and robustness as parameters. The method developed, which is rapid, accurate, and robust for the analysis of different classes of phenols, can be used in the quality control and standardization of plant extracts as well as herbal drugs, including compound herbal formulations.
tems is strongly associated with mutagenesis, carcinogenesis, ageing and atherosclerosis (7–9). Considering the importance of phenolics, an HPLC method, using phenolics as marker components (10), has been developed as a standardization tool for “Chyavanprash,” a widely used herbal formulation in India and elsewhere as a health promotive and disease preventive. Thus keeping in view its biological importance, a method for the rapid estimation and separation of these phenolics has become a necessity in the development of herbal drugs, nutraceuticals, and cosmaceuticals. Although there have been many different approaches to their analysis, separation and quantitation of the phenolic compounds of a plant extract remains difficult. This is especially true of the simultaneous determination of different groups of phenolics in a sole analysis. HPLC is the method of choice for the analysis of phenolic compounds, due to its extremely high versatility, precision, and relatively low cost (11–13). The most frequently preferred method is
Introduction Most herbal medicines, and food items like grapes and wines, contain a range of antioxidant phenolics, with high-performance liquid chromatography (HPLC) being the most preferred method for their analysis and standardization (1). Polyphenols are important antioxidants because of their high redox potentials, which allow them to act as reducing agents, hydrogen donors, and singlet oxygen quenchers (2). They also have metal chelating potential (3). Plant polyphenolics, such as flavonoids, are described as scavengers of reactive oxygen species via inhibition of oxido-reductases (4–6). These compounds have many biological effects upon health promotion and disease prevention. An important protective effect is the reduction of oxidative damage, mediated by lipid peroxidation, which in living sys*Author to whom correspondence should be addressed: email
[email protected].
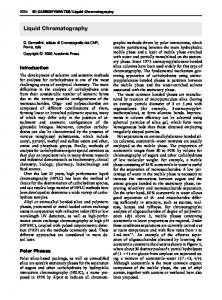
Figure 1. Structure of different phenolics separated in the current analysis.
Reproduction (photocopying) of editorial content of this journal is prohibited without publisher’s permission.
701
Journal of Chromatographic Science, Vol. 45, November/December 2007
on-reversed phase (RP) C18 columns, a binary solvent system containing acidified water, a polar organic solvent (acetonitrile or methanol), and UV–vis diode array detection (DAD), which constitute a crucial and reliable tool in the routine analysis of plant phenolics (1,14). Obtaining good resolution is considered as the prerequisite for a method targeted at the separation of multiple phenolic groups (12). According to the most relevant
bibliography, the HPLC–DAD chromatographic method seems to be a suitable tool for the separation and quantitation of phenolic compounds in plant extracts (14). Alternatively, the spectrophotometric method is ideal for quantitative estimation purposes, but this method’s shortcoming is that total phenols are indiscriminately measured (11). The aim of the present study is to develop an optimized, validated, and simple HPLC method for the separation and identification of the phenolic compounds in a sole analysis, taking six different types of phenolics like benzoic acids, cinnamic acids, flavonol, flavanol, flavone, and flavanone derivatives. An attempt has been made to separate a total of 15 such phenolic derivatives (Figure 1) in a sole analysis of 35 min duration. Once the method is developed, it is validated on the basis of its selectivity, linearity, precision, accuracy, and robustness (15), according to ICH requirements (16).
Experimental Chemicals
Figure 2. Structures of different flavonoids.
Apigenin, benzoic acid, catechol, chlorogenic acid, epicatechin, ferulic acid, gallic acid, myricetin, naringin, protocatechuic acid, quercitin, rutin, syringic acid, vanillic acid, and vanillin were obtained from Sigma Co. Ltd. (St. Louis, MO). HPLC-grade acetonitrile, water, and phosphoric acid were obtained from Merck (Darmstadt, Germany). HPLC–DAD system for qualitative and quantitative analysis of phenolic compounds
Figure 3. HPLC chromatogram of the phenolic in a sole analysis. Peaks are: gallic acid, 1; protocatechuic acid, 2; chlorogenic acid, 3; catechol, 4; vanillic acid, 5; syringic acid, 6; vanillin, 7; rutin, 8; epicatechin, 9; ferulic acid, 10; naringin, 11; benzoic acid, 12; myricetin, 13; quercitin, 14; apigenine, 15.
702
Analyses were performed in a liquid chromatograph with Waters (Milford, MA) pumps (Waters 515) equipped with an online degasser, a Waters PCM, Rheodyne 7725 injection valve furnished with a 20-µL loop, a Waters 2996 photodiode array detector, and Waters Empower software. Separation was carried out using a Merck Purospher Star (250 × 4.6-mm, i.d., 5-mm pore size) C18 column with guard column of same chemistry. HPLC fingerprint profile was established for phenolics. Elution was carried out at a flow rate of 0.8 mL/min with water–phosphoric acid (99.7:0.3 v/v) as solvent A and acetonitrile–water–phosphoric acid (79.7:20:0.3 v/v) as solvent B using a gradient elution in 0–5 min with 88–85% A, 5–6 min with 85–82% of A, 6–9.5 min with 82–75% of A, 9.5–10.5 min with 75–74% of A, 10.5–12 min with 74–73% A, 12–20 min with 73–70% A, 20–25 min with 70–50% A, 25–30 min with 50–30% of A and isocratic from 30–35 min with 30% A.
Journal of Chromatographic Science, Vol. 45, November/December 2007
Calibration
The contents of the active phenolic compounds were determined using a calibration curve established with seven dilutions of each standard, at concentrations ranging from 2.5 to 200 µg/mL. Each concentration was measured in triplicate. The corresponding peak areas were plotted against the concentration of the phenolic compound injected. Peak identification was achieved by comparison of both the retention time and UV absorption spectrum with those obtained for individual standards. The reference substances used were apigenin, benzoic acid, catechol, chlorogenic acid, epicatechin ferulic acid, gallic acid, myricetin, naringin, protocatechuic acid, quercitin, rutin, syringic acid, vanillic acid, and vanilllin.
in the quantitative analysis. Interday and intraday variability was studied for the mixture by injecting the same concentration of the mixture on three different days, and the standard error mean was calculated. Statistics When applicable, one- or two-way analyses of variance (SPSS11.0 for window) was used to assess the observed differences in the phenolic content. Differences were considered to be statistically significant when the p-value was < .05.
Results and Discussion
Validation parameters
Selectivity and peak purity Using a mixture of phenolics, separation and detection were optimized and selectivity was checked. The purity of the peaks was checked by DAD (λ = 200–400 nm) multivariate analysis. The three spectra corresponding to upslope, apex, and downslope of each peak were computer normalized and superimposed. Peaks were considered pure when there was a coincidence between the three spectra (match factor was ≥ 98%).
Polyphenolics is a highly inclusive term that covers many different subgroups of phenolic acids and flavonoids. More than 5000 polyphenolics, including over 2000 flavonoids, have been identified, and the number is still growing (17). Polyphenolics vary in structures: hydroxybenzoic acids and hydroxycinnamic acids have a single-ring structure, while flavonoids can be further classified into anthocyanins, flavan-3-ols, flavones, flavanones and flavonols. Some of the flavonoids such as flavan-3-ols can be found in dimers, trimers, and polymers. Flavonoids are benzo-γ-pyrone derivatives consisting of phenolic and pyran rings. They consist of benzene rings (A) and (B), comprising an oxygen-containing pyran ring (C). The differences in substitution on ring (C) distinguishes the different classes of flavonoids (Figure 2). A HPLC method for the separation and quantitation of six different types of phenolics with a total of 15 different phenolics in a sole analysis has been developed (Figure 3). The spectra of each of the phenols was also recorded and analyzed to study the method precision and for simple identification of the compounds
Linearity, limits of detection and quantitation The linearity of the detector response for the prepared standards was assessed by means of linear regression regarding the amounts of each standard, measured in µg, and the area of the corresponding peak on the chromatogram. After chromatographic separation, the peak areas obtained were plotted against the mixture (mixture of standards) concentrations by linear regression. Limits of detection and quantitation were determined by calculation of the signal-to-noise ratio. Signal-to-noise ratios of aproximately 3:1 and 10:1 were used for estimating the detection limit and quantitation limit, respectively, of the method. Table I. Regression Curves, Linearity, Limit of Quantitation (LOQ), Limit of Detection (LOD), and Recovery Precision To determine the repeatability of the injection Concentration Recovery integration, standard solution containing the 15 Compound tR (min) R2 range* LOD* LOQ* (%) reference compounds was injected 10 times. The mean amount and relative standard deviation Apigenin 30.45 ± 0.05 0.982 10–100 1.1 4.5 93.23 ± 1.6 (RSD) values of each constituent were calcuBenzoic acid 25.59 ± 0.06 0.995 10–100 0.8 3.9 95.32 ± 1.8 Catechol 12.12 ± 0.04 0.998 10–100 1.20 4.7 93.12 ± 1.7 lated. The precision was calculated at two difChlorogenic acid 11.63 ± 0.01 0.984 10–100 1.97 5.1 96.3 ± 0.92 ferent concentrations of high and low in the Epicatechin 20.24 ± 0.09 0.925 10–100 2.6 4.2 91.4 ± 1.5 concentration range. Accuracy The accuracy of the method was determined by analyzing the percentage of recovery of the phenolics in the mixture. Robustness To determine the method’s robustness, a number of chromatographic parameters (column package and size, mobile phase composition and gradient ratio, flow rate, and detection wavelength) were varied to determine their influence
Ferulic acid Gallic acid Myricetin Naringin Protocatechuic acid Quercetin Rutin Syringic acid Vanilic acid Vanilin
20.61 ± 0.07 5.40 ± 0.08 26.66 ± 0.05 24.77 ± 0.07 9.30 ± 0.10 29.64 ± 0.03 18.42 ± 0.12 14.13 ± 0.04 13.70 ± 0.05 17.76 ± 0.06
0.992 0.990 0.972 0.992 0.989 0.970 0.962 0.998 0.996 0.952
5–100 10–200 10–100 10–100 10–100 5–100 5–100 5–100 10–100 10–100
1.56 0.62 0.92 1.32 1.22 1.8 1.1 1.80 1.21 0.85
5.9 4.5 4.1 5.6 6.1 7.8 4.0 5.1 5.8 5.9
95.04 ± 1.28 96.92 ± 1.16 93.21 ± 1.37 96.45 ± 0.97 94.9 ± 1.55 98.8 ± 1.37 96.28 ± 1.35 93.80 ± 2.65 95.72 ± 2.12 95.78 ± 2.58
The retention times (tR) are the mean of 10 replicates ± S.D. *Values expressed in µg/mL.
703
Journal of Chromatographic Science, Vol. 45, November/December 2007
(Figure 4). The HPLC method was validated by defining the linearity, peak purity, limits of quantitation and detection, precision, accuracy, specificity, and robustness. For qualitative purposes, the method was evaluated by taking into account the precision in the retention time, peak purity, and selectivity of phenolic compounds eluted. A high repeatability in the retention time was obtained with RSD values lower than 5% for both standards and a mixture of phenolics even at high concentration. The peak purity was studied in mixture of phenolics. In no case were impurities or coelutions observed (match factor ≥ 93%). Linearity, limit of detection (LOD), limit of quantitation (LOQ), accuracy, and precision were evaluated for quantitative purposes (Table I). LOD values ranged from 0.6 to 1.97 µg/mL, and LOQ values from 3.9 to 7.8 µg/mL, which suggested full capacity for the quantitation of each phenolic compound investigated. R2 values of the phenolic compounds were higher than 0.92, thus confirming the linearity of the method. The high recovery values from the mixture of phenols (close to 91%) and a high repeatability indicated a satisfactory accuracy in the proposed method. Likewise, the accuracy was independent of both the compound concentration and the chemical structure. Finally, the robust-
ness of the method was assessed. Minor modifications of the initial mobile phase gradient (from 7 to 18% solvent B instead of 12%) had no major effect on the peak resolution of the compounds: all the peaks were well-resolved, with no merged peaks, though there was a minimal shift in the retention time (RT). With a reduction in the column size from 250 × 4.6 mm to 150 × 3.9 mm, there was a reduction in the RT of all the peaks by 1.5–1 min, but there was a minimal impact in the resolution of the peaks. The same was the case during the change in flow rate. Therefore, this HPLC method can be regarded as selective, accurate, precise, and robust, and has a wide scope in the area of natural product drug development and their quality control and standardization.
Acknowledgment The authors are thankful to the Director, NBRI, for his kind support and encouragement. D.P. Singh is thankful to CSIR, New Delhi for providing Senior Research Fellowship.
Figure 4. UV spectra (PDA) of the phenols: apigenin (A); benzoic acid (B); catechol (C); chlorogenic acid (D); epicatechin (E); ferulic acid (F); gallic acid (G); myricetin (H); naringin (I); protocatechuic acid (J); quercitin (K); rutin (L); syringic acid (M); vanillic acid (N); vanillin (O).
704
Journal of Chromatographic Science, Vol. 45, November/December 2007
References 10. 1. E. Revilla and J.M. Ryan. Analysis of several phenolic compounds with potential antioxidant properties in grape extracts and wines by high-performance liquid chromatography-photodiode array detection without sample preparation. J .Chromatogr. 881: 461–69 (2000). 2. M.P. Kahkonen, A.I. Hopia, H.J. Vuorela, J.P. Rauha, K. Pihlaja, T.S. Kujala, and M. Heinonen. Antioxidant activity of plant extracts containing phenolic compounds. J. Agric. Food Chem. 47: 3954–62 (1999). 3. C.A. Rice-Evans, N.J. Miller, P.G. Bolwell, P.M. Bramley, and J.B. Pridham. The relative antioxidant activities of plantderived polyphenolic flavonoids. Free Radic. Res. 22: 375–83 (1995). 4. S. Chen, J. Hwang, and P.S.K. Deng. Inhibition of NAD(P)H:quinone acceptor oxidoreductase by flavones: a structure-activity study. Arch. of Biochemi. and Biophys. 302: 72–77 (1993). 5. W. Krol, Z.P. Czuba, M.D. Thereadgill, B.D.M. Cunningham, and G. Pietsz. Inhibition of nitric oxide (NO.) production in murine macrophages by flavones. Biochem. Pharmacol. 50:1031–35 (1995). 6. G.D. Carlo, N. Mascolo, A.A. Izzo, and F. Capasso. Flavonoids: old and new aspects of a class of natural therapeutic drugs. Life Sci. 65: 337–44 (1999). 7. K. Yagi. Lipid peroxides and human diseases. Chem. Phys. Lipids. 45: 337–51 (1987). 8. R.G. Cultar. Antioxidants, aging and longevity. Pryor, W.A. Ed. Free Radicals in Biology. Vol. 6. Academic Press, Orlando, FL 1984, pp. 371. 9. R.G. Cultar. Genetic stability and oxidative stress: common mechanisms in aging and cancer. I. Emerit and B. Chance,.
11.
12.
13.
14.
15.
16.
17.
Eds., Free Radical and Aging. Birkhauser Verlag, Basel, Switzerland 1992, pp. 31. R. Govindarajan, D.P. Singh, and A.K.S. Rawat. High-performance liquid chromatographic method for the quantitation of phenolics in ‘Chyavanprash’ a potent Ayurvedic drug. J. Pharm. Biomed. Anal. (2006). 43: 527–532 (2007). A. Escarpa and M.C. González. Approach to the content of total extractable phenolic compounds from different food samples by comparison of chromatographic and spectrophotometric methods. Anal. Chim. Acta. 427: 119–127 (2001). R. Tsao and R. Yang. Optimization of a new mobile phase to know the complex and real polyphenolic composition: towards a total phenolic index using high-performance liquid chromatography. J. Chromatogr. 1018: 29–40 (2003). A. Escarpa and M.C. Gónzalez. Optimization strategy and validation of one chromatographic method as approach to determine the phenolic compounds from different sources. J .Chromatogr. 897: 161–70 (2000). K. Robards. Strategies for the determination of bioactive phenols in plants, fruit and vegetables. J .Chromatogr. 1000: 657–91 (2003). A.M. García-Campaña, J.M. Bosque-Sendra, L.C. Rodríguez, and E.A. López. A framework for in-house accuracy validation of analytical procedures. Biomed. Chromatogr. 14: 27–29 (2000). International Conference on Harmonization (ICH), Validation of Analytical Procedures, Commission of the European Communities, Brussels, III: 5626/94. J.B. Harborne (Ed.). The Flavonoids: Advances in Research Since 1986. Chapman and Hall, London, UK 1993. Manuscript received October 18, 2006; revision received March 1, 2007
705