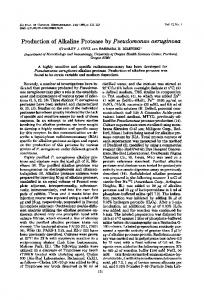
CURRENT MICROBIOLOGY Vol. 44 (2002), pp. 286 –290 DOI: 10.1007/s00284-001-0006-8
Current Microbiology An International Journal © Springer-Verlag New York Inc. 2002
Optimization of Alkaline Protease Production from Bacillus sp. by Response Surface Methodology Sumant Puri, Qasim Khalil Beg, Rani Gupta Department of Microbiology, University of Delhi South Campus, Benito Juarez Marg, New Delhi 110 021, India Received: 19 July 2001 / Accepted: 15 August 2001
Abstract. High yields (1939 U/ml) of an alkaline protease were obtained in batch fermentation of a Bacillus sp. using a response surface methodology. The interaction of four variables, viz., starch, peptone, incubation time, and inoculum density, suggested inoculum density to be an insignificant variable. However, incubation time had a profound effect on protease yields at all the concentrations of carbon and nitrogen used. The response surface raised and flattened with increase in time of incubation, and maximum protease production up to 1939 U/ml was obtained after 96 h of incubation. The model equation obtained was validated experimentally at maximum starch (15 mg/ml) and peptone (7.5 mg/ml) concentration with increased incubation time up to 144 h in the presence of minimum inoculum density (1%). An overall 2.6-fold increase in protease production was obtained as compared with mean observed response (750 U/ml) at zero level of all variables.
The ‘one-at-a-time-approach’ is the most frequently used operation in biotechnology to obtain maximum cell density, high yields of the desired metabolic product, or enzyme levels in a microbial system. This approach is not only time consuming, but ignores the combined interactions among various physicochemical parameters [4]. On the contrary, the response surface methodology (RSM), which includes factorial design and regression analysis, helps in evaluating the effective factors and building models to study interaction and select optimum conditions of variables for a desirable response [3, 4]. Recently, a number of statistical experimental designs with response surface methodology (RSM) have been employed for optimizing enzyme production from microorganisms [1, 3, 17]. It is a well-known fact that extracellular protease production in microorganisms is greatly influenced by media components, especially carbon and nitrogen sources [6 –10], metal ions [17], and physical factors such as pH, temperature, inoculum density [13], dissolved oxygen [5, 12], and incubation time [13, 14, 16]. We have earlier reported the effectiveness of an SDSstable alkaline protease from a newly isolated Bacillus sp. RGR-14 for use in detergent formulations [14]. Here, we report optimization of this protease from Bacillus sp. Correspondence to: R. Gupta; email:
[email protected]
as a result of the interaction between four variables with response surface methodology. Materials and Methods Chemicals. Casein for protease assay was from Sigma (St. Louis, MO, USA). All other analytical reagents and media components used were of highest purity grade available commercially in India. Microorganism and inoculum preparation. Bacillus sp. RGR-14, which produces an SDS-stable alkaline protease [14], was used in the present study. It was identified to be closely related to Bacillus sp. TSG437 strain on the basis of 16S rRNA homology by MIDILABS Inc., (Newark, DE, USA). The 6-h-old seed culture [prepared in nutrient broth (pH 7) at 37°C under shaking (200 rpm)] was used to inoculate production flasks. Selection of best carbon and nitrogen source. For selection of the best source of carbon and nitrogen for protease production, various simple and complex carbon (glucose, starch, pectin, wheat bran, carboxy methyl cellulose, xylan, chitin) and inorganic and complex nitrogen sources (ammonium chloride, soybean meal, casamino acids, casein, peptone, yeast extract, cornsteap solids, cornsteap liquor, corn glutan meal, skim milk) were supplemented individually in the previously reported medium [14] for protease production from Bacillus sp. All these sources were supplemented in the production medium at a final concentration of 1% wt/vol and 0.5% wt/vol for carbon and nitrogen, respectively, and protease yield was determined after 48 h of incubation at 37°C under shaking (200 rpm). Experimental design and protease production. The next stage in medium formulation was to determine the optimal levels of four variables, viz. starch (A), peptone (B), inoculum density (C), and
287
S. Puri et al.: Alkaline Protease Production from Bacillus sp. Table 1. Experimental range and levels of the four independent variables used in RSM in terms of actual and coded factors Range of levels Variables Starch (mg/ml) Peptone (mg/ml) Incubation time(h) Inoculum (%)
Actual
Coded
Actual
Coded
Actual
Coded
5 2.5 24 1
⫺1 ⫺1 ⫺1 ⫺1
10 5 48 2
0 0 0 0
15 7.5 72 3
⫹1 ⫹1 ⫹1 ⫹1
incubation time (D) on protease production. For this purpose, the response surface approach by using a set of experimental design (FCCCD: Face Centered Central Composite design) was adopted for improving total protease production. The statistical software package ‘Design-Expert威 6.0.1’, StatEase, Inc., (Minneapolis, MN, USA) was used to analyze the experimental design. Each factor in the design was studied at three different levels (⫺1, 0, ⫹1). For a 24 FCCCD with four factors, including six center points, a set of 30 experiments was carried out. All the variables were taken at a central coded value considered as zero. The minimum and maximum ranges of variables investigated and the full experimental plan with respect to their values in actual and coded form are listed in Table 1. Upon completion of experiments, the average maximum protease yield was taken as the dependent variable or response (Y). A second-order polynomial equation was then fitted to the data by the multiple regression procedure. This resulted in an empirical model that related the response measured to the independent variables of the experiment. For a four-factor system, the model equation is: Y ⫽  0 ⫹  1A ⫹  2B ⫹  3C ⫹  4D ⫹  11A 2 ⫹  22B 2 ⫹  33C 2 ⫹  44D 2 ⫹  12AB ⫹  13AC ⫹  14AD ⫹  23BC ⫹  24BD ⫹  34CD with Y, predicted response; 0, intercept; 1, 2, 3, 4, linear coefficients; 11, 22, 33, 44, squared coefficients; 12, 13, 14, 23, 24, 34, interaction coefficients. Design Expert Software, using the above model to obtain the optimum concentration of the medium components, was then used to generate response surface graphs. The final basal minimal medium (pH 7) used for protease production contained (g/L): starch (variable), peptone (variable); KH2PO4, 1; K2HPO4, 3. The production medium (50 ml in a 250-ml Erlenmeyer flask) was inoculated with the inoculum density (A550nm ⬵ 0.250 – 0.300) designated for each set and incubated at 37°C under shaking (200 rpm) in a New Brunswick Scientific Shaker (Edison, NJ, USA). After proper incubation time designated for each set, the cell-free supernatant was obtained by centrifugation at 14,000 rpm for 30 min at 4°C in a cold centrifuge (Sorvall威 RC 5C Plus), and the protease production was determined in the cell-free supernatant. Protease assay. The protease was assayed at 60°C in glycine NaOH buffer (0.05 M, pH 10.0) by using casein as substrate, as described previously [14]. One unit of protease was equivalent to the amount of enzyme required to release 1 g of tyrosine/ml/min under standard assay conditions.
Results and Discussion Effect of various carbon and nitrogen sources on protease production. Among the various carbon sources
Table 2. Effect of various carbon and nitrogen sources on protease production by Bacillus sp. after 48 h at 37°C under shaking (200 rpm). Nutrient source Carbon source (1%): Starch Pectin Wheat bran Carboxymethyl cellulose Chitin Glucose Nitrogen source (0.5%): Peptone Casein Soybean meal Yeast extract Casamino acids Cornsteep solids Corngluten meal Skim milk Cornsteep liquor Ammonium chloride
Protease yield (U/ml)
390 ⫾ 27 325 ⫾ 31 284 ⫾ 14 169 ⫾ 19 157 ⫾ 12 24 ⫾ 4 687 ⫾ 38 481 ⫾ 42 451 ⫾ 49 449 ⫾ 33 390 ⫾ 27 365 ⫾ 42 356 ⫾ 28 342 ⫾ 20 249 ⫾ 14 24 ⫾ 4
studied, the Bacillus sp. produced maximum protease in starch (390 U/ml), followed by pectin (325 U/ml) and wheat bran (284 U/ml) (Table 2). Glucose drastically inhibited protease production. Among nitrogen sources, peptone (687 U/ml) favored maximum protease production, followed by casein (481 U/ml), skim milk (451 U/ml), and yeast extract (449 U/ml). Thus, starch and peptone were selected as the source of carbon and nitrogen, respectively, for design of response surface methodology. Optimization by response surface methodology. The results of FCCCD experiments for studying the effects of four independent variables, viz., starch, peptone, incubation time, and inoculum density, on protease production are presented in Table 3 along with the mean predicted and observed response. The regression equation obtained after the analysis of variance (ANOVA) indicated the R2 value of 0.79 (a value of R2 ⬎ 0.75 indicates the aptness of the model), which ensured a satisfactory adjustment of the quadratic model to the experimental data and indi-
288
CURRENT MICROBIOLOGY Vol. 44 (2002)
Table 3. Experimental designs used in RSM studies by using four independent variables with six center points showing observed and predicted values of protease production
Run order
A (Starch)
B (Peptone)
C (Inoculum density)
D (Incubation time)
Mean observed response
Predicted response
1. 2. 3. 4. 5. 6. 7. 8. 9. 10. 11. 12. 13. 14. 15. 16. 17. 18. 19. 20. 21. 22. 23. 24. 25. 26. 27. 28. 29. 30.
⫺1 ⫺1 ⫺1 ⫺1 ⫺1 ⫺1 ⫺1 ⫺1 ⫹1 ⫹1 ⫹1 ⫹1 ⫹1 ⫹1 ⫹1 ⫹1 ⫺1 ⫹1 0 0 0 0 0 0 0 0 0 0 0 0
⫺1 ⫺1 ⫺1 ⫺1 ⫹1 ⫹1 ⫹1 ⫹1 ⫺1 ⫺1 ⫺1 ⫺1 ⫹1 ⫹1 ⫹1 ⫹1 0 0 ⫺1 ⫹1 0 0 0 0 0 0 0 0 0 0
⫺1 ⫺1 ⫹1 ⫹1 ⫺1 ⫺1 ⫹1 ⫹1 ⫺1 ⫺1 ⫹1 ⫹1 ⫺1 ⫺1 ⫹1 ⫹1 0 0 0 0 ⫺1 ⫹1 0 0 0 0 0 0 0 0
⫺1 ⫹1 ⫺1 ⫹1 ⫺1 ⫹1 ⫺1 ⫹1 ⫺1 ⫹1 ⫺1 ⫹1 ⫺1 ⫹1 ⫺1 ⫹1 0 0 0 0 0 0 ⫺1 ⫹1 0 0 0 0 0 0
271.60 391.60 410.60 316.30 318.30 467.40 368.80 198.40 296.60 301.10 705.40 552.60 321.60 282.30 1847.90 1223.40 194.60 707.20 164.52 560.62 456.60 273.60 750.97 702.20 750.01 750.30 748.70 756.30 747.77 747.77
331.28 585.78 199.29 135.34 220.71 334.96 469.32 265.12 157.52 207.52 846.78 578.33 511.50 429.25 1581.36 1172.66 394.31 761.20 368.49 610.36 337.10 646.81 610.32 734.45 610.32 610.32 610.32 610.32 610.32 610.32
cated that 79% of the variability in the response could be explained by the model. An adequate precision of 9.263 indicates an adequate signal as it measures the signal-tonoise ratio. The coefficients of the regression equation were calculated using Design Expert, and the following regression equation was obtained. Y ⫽ 610.32 ⫹ 183.44*A ⫹ 120.94*B ⫹ 154.86*C ⫺ 38.55*D ⫺ 32.57*A 2 ⫺ 120.90*B 2 ⫺ 118.37*C 2 ⫹ 162.68*D 2 ⫹ 116.14*AB ⫹ 205.31*AC⫺51.13*AD ⫹ 95.15*BC ⫺ 35.06*BD ⫺ 79.61*CD with Y, protease production (response); A, starch; B, peptone; C, incubation time; and D, inoculum density. The three-dimensional response surface curves were then plotted to understand the interaction of the medium components and the optimum concentration of each
component required for maximum protease production. Analysis of variance (ANOVA) showed that the factor D (inoculum density) was insignificant. It was, therefore, taken as minimum (1%) for further interpretation of the response surfaces. The response surfaces shown in Figs. 1–3 show the relative effect of the two variables (starch and peptone), with varying incubation time at constant inoculum density (1%). The coordinates of the central point within the highest contour levels in each of these figures corresponded to the optimum concentrations of the respective components. Figure 1 shows the response for the interactive factors, starch (A) and peptone (B), when the incubation time (C) was kept at the minimum (24 h). Maximum enzyme yield in these conditions was predicted to be 520 U/ml, corresponding to maximum levels ( ⫹ 1) of both starch (15 mg/ml) and peptone (7.5 mg/ml). However, the curve also suggested that the response did not vary much as a function of peptone concentration.
289
S. Puri et al.: Alkaline Protease Production from Bacillus sp.
Fig. 1. Response surface curve of protease production from Bacillus sp. showing interaction between starch and peptone after 24 h of incubation.
Fig. 3. Response surface curve of protease production from Bacillus sp. showing interaction between starch and peptone after 72 h of incubation. Table 4. Validation of the response surface model.
Incubation time (h) 72 (⫹1 level of the model) 96 (validation) 120 (validation) 144 (validation)
Predicted response (U/ml)
Mean observed response (U/ml)
1581 1758 1718 1425
1848 1939 1710 1450
and nitrogen sources are better substrates for protease production than simpler sugars, such as glucose, which cause catabolite repression [6, 8, 9].
Fig. 2. Response surface curve of protease production from Bacillus sp. showing interaction between starch and peptone after 48 h of incubation.
With an increase in incubation time, the enzyme production further increased to 1165 U/ml after 48 h (Fig. 2) and 1581 U/ml after 72 h (Fig. 3). However, the response curves did not show curvature; rather, they were flattened with more and more points moving towards higher enzyme units (Figs. 2 and 3). Thus, the surface plots suggested demand for higher concentrations of both starch and peptone along with longer time of incubation to obtain maximum protease production. This confirms earlier reports on protease production, where it has been observed that these complex carbon
Validation of the model. The model indicated that the selected concentrations of starch and peptone were limiting and thus did not result in the appropriate curved surface in the response surface graph. Therefore, further increase in their concentrations, along with increase in time interval, should be worked out for validation. But, owing to experimental limitations (increased starch concentrations lead to high viscosity of the medium), the model was validated only with increased time interval. The validation experiments showed that there was an increase in enzyme production (1939 U/ml) after 96 h (Table 4), which was closer to the predicted response (1758 U/ml) (Fig. 4). However, the major decline in enzyme production was obtained after 144 h, and protease production after 120 and 144 h was 1710 U/ml and 1450 U/ml, respectively (Fig. 4; Table 4). This could be because of expected carbon and nitrogen limitation. During a batch culture, the consumption of substrates or
290
CURRENT MICROBIOLOGY Vol. 44 (2002)
Literature Cited
Fig. 4. Contour plot of protease production from Bacillus sp. as a function of starch concentration and incubation time
depletion of nutrients has profound effects on protease production. Several factors, such as autodigestion of proteases and proteolytic attack by other proteases, have also been suggested to be involved in cessation of enzyme synthesis [2, 15]. An overall 2.6-fold (1939 U/ml) increase in protease production was achieved compared with the mean observed response (750 U/ml) in the basal medium (with all factors at their central levels) after optimization by using response surface methodology. Such high enzyme yields for protease over a longer time of 96 h have not been reported earlier in bacterial batch fermentations. However, controlled fed-batch fermentations and chemostat cultures [8, 11, 12] have so far been used successfully for improving protease production for a long time of incubation from a number of microorganisms. In a similar report, the production of an alkaline protease from Rhizopus oryzae was enhanced up to 2.5fold after optimizing concentrations of Tween-80 and metal ions in the medium by using a multifactorial approach [1]. Thus, a multifactorial statistical approach that considers the interaction of independent variables provides a basis for the model to search for the nonlinear nature of the response in a short-term experiment. ACKNOWLEDGMENTS The authors thank CSIR (Govt. of India) for financial assistance. Technical assistance provided by Mrs. M. Singh, Mr. M. Hussain, Mr. M. Lal, and Mr. Satish is acknowledged.
1. Banerjee R, Bhattacharyya (1992) Optimization of multiple inducers effect on protease biosynthesis by Rhizopus oryzae. Bioprocess Eng 7:225–228 2. Chu IM, Lee C, Li TS (1992) Production and degradation of alkaline protease in batch cultures of Bacillus subtilis ATCC 14416. Enzyme Microb Technol 14:755–761 3. De Coninck J, Bouquelet S, Dumortier V, Duyme F, Denantes VI (2000) Industrial media and fermentation process for improved growth and protease production by Tetrahymena thermophila BIII. J Ind Microbiol Biotechnol 24:285–290 4. Haaland PD (1989) Statistical problem solving. In: Haaland PD, ed., Experimental design in biotechnology. New York: Marcel Dekker, Inc, pp, 1–18 5. Hameed A, Keshavarz T, Evans CS (1999) Effect of dissolved oxygen tension and pH on the production of extracellular protease from a new isolate of Bacillus subtilis K2, for use in leather processing. J Chem Technol Biotechnol 74:5– 8 6. Hanlon GW, Hodges NA, Russel AD (1982) The influence of glucose, ammonium and magnesium availability on the production of protease and bacitracin by Bacillus licheniformis. J Gen Microbiol 128:845– 851 7. Kaur S, Vohra RM, Kapoor M, Beg QK, Hoondal GS (2001) Enhanced production and characterization of a highly thermostable alkaline protease from Bacillus sp. P-2. World J Microbiol Biotechnol 17:125–129 8. Kole MM, Draper I, Gerson DF (1988a) Production of protease by Bacillus subtilis using simultaneous control of glucose and ammonium concentrations. J Chem Technol Biotechnol 41:197–206 9. Kole MM, Draper I, Gerson DF (1988b) Protease production by Bacillus subtilis in oxygen-controlled, glucose fed-batch fermentations. Appl Microbiol Biotechnol 28:404 – 408 10. McKeller RC, Cholette H (1984) Synthesis of extracellular proteinase by Pseudomonas fluorescens under conditions of limiting carbon, nitrogen and phosphate. Appl Environ Microbiol 47:1224–1227 11. Moon SH, Parulekar SJ (1991) A parametric study of protease production in batch and fed-batch cultures of Bacillus firmus. Biotechnol Bioeng 37:467– 483 12. Moon SH, Parulekar SJ (1993) Some observations on protease production in continuous suspension cultures of Bacillus firmus. Biotechnol Bioeng 41:43–54 13. Nehete PN, Shah VD, Kothari RM (1985) Profiles of alkaline protease production as a function of composition of the slant, age, transfer and isolate number and physiological state of culture. Biotechnol Lett 7:413– 418 14. Oberoi R, Beg QK, Puri S, Saxena RK, Gupta R (2001) Characterization and wash performance analysis of a SDS-stable alkaline protease from Bacillus sp. World J Microbiol Biotechnol 17: 493– 497 15. Priest FG (1977) Extracellular enzyme synthesis in the genus Bacillus. Bacteriol Rev 41:711–753 16. Razak NA, Samad MYA, Basri M, Yunus WMZW, Ampon K, Salleh AB (1994) Thermostable extracellular protease of Bacillus stearothermophilus: factors affecting its production. World J Microbiol Biotechnol 10:260 –263 17. Varela H, Ferrari MD, Belobradjic L, Weyrauch R, Loperena ML (1996) Effect of medium composition on the production by a new Bacillus subtilis isolate of protease with promising unhairing activity. World J Microbiol Biotechnol 12:643– 645