Sensors 2015, 15, 8945-8967; doi:10.3390/s150408945 OPEN ACCESS
sensors ISSN 1424-8220 www.mdpi.com/journal/sensors Article
Optimization of Capacitive Acoustic Resonant Sensor Using Numerical Simulation and Design of Experiment Rubaiyet Iftekharul Haque 1,2,*, Christophe Loussert 2, Michelle Sergent 3, Patrick Benaben 1 and Xavier Boddaert 1,* 1
2 3
Centre Microélectronique de Provence, Ecole des Mines de Saint-Etienne, Gardanne 13541, France; E-Mail:
[email protected] TAGSYS RFID, 13600 La Ciotat, France; E-Mail:
[email protected] Aix-Marseille Université, LISA EA 4672, 13397 Marseille Cedex 20, France; E-Mail:
[email protected]
* Authors to whom correspondence should be addressed; E-Mails:
[email protected] (R.I.H.);
[email protected] (X.B.); Tel.: +33-442-616-761 (X.B.); Fax: +33-442-616-593 (X.B.). Academic Editor: Vittorio M.N. Passaro Received: 29 January 2015 / Accepted: 9 April 2015 / Published: 16 April 2015
Abstract: Optimization of the acoustic resonant sensor requires a clear understanding of how the output responses of the sensor are affected by the variation of different factors. During this work, output responses of a capacitive acoustic transducer, such as membrane displacement, quality factor, and capacitance variation, are considered to evaluate the sensor design. The six device parameters taken into consideration are membrane radius, backplate radius, cavity height, air gap, membrane tension, and membrane thickness. The effects of factors on the output responses of the transducer are investigated using an integrated methodology that combines numerical simulation and design of experiments (DOE). A series of numerical experiments are conducted to obtain output responses for different combinations of device parameters using finite element methods (FEM). Response surface method is used to identify the significant factors and to develop the empirical models for the output responses. Finally, these results are utilized to calculate the optimum device parameters using multi-criteria optimization with desirability function. Thereafter, the validating experiments are designed and deployed using the numerical simulation to crosscheck the responses.
Sensors 2015, 15
8946
Keywords: acoustic sensor; resonance; numerical simulation; design of experiments; response surface method; optimization
1. Introduction For many years, acoustic sensors have been used in many civilian and military applications, such as in cellular phones, hearing aids, and computers, in addition to high quality studio microphones for sound recording [1], sonar for underwater objects detection [2], and in the acoustic sensor systems for target acquisition and surveillance purposes [3] etc. An acoustic transducer provides analog output that is proportional to the variation of acoustic pressure acting upon a flexible diaphragm. Most familiar examples of acoustic sensors are the microphone, earphone etc. There are different types of acoustic sensors: namely, piezoelectric, piezoresistive, and capacitive [4]. Among them, capacitive acoustic sensors show the highest sensitivity while maintaining low power consumption [5]. Capacitive sensing is independent of the base materials and relies on the variation of the capacitance when geometry of a capacitor is changing. Furthermore, capacitive acoustic sensor can be used as both an active and passive sensing device. A capacitive acoustic transducer is an electromechanical-acoustic system. It usually consists of a fixed backplate electrode and a flexible diaphragm that acts as a second electrode, separated by a dielectric material, such as air, to form a parallel plate capacitor. The deflection of the diaphragm occurs due to incident acoustic pressure, thereby providing capacitance variation in response to the change in air gap. In general, capacitive acoustic transducer suffers from over-damping, as a thin layer of air is trapped in between the electrodes; therefore, capacitive acoustic transducers are usually designed and fabricated with porous membranes or/and perforated backplates to reduce the damping effect. To date, many capacitive acoustic sensors have been developed, and some of them are commercially available. However, its design varies based on the application domains, and the majority of these are targeted for audio applications with nearly uniform sensitivity over a relatively wide range of frequencies in the human hearing range, 20 Hz–20 kHz [4–10]. Recently, a new simplified design concept has been proposed to fabricate a capacitive acoustic transducer, which consists of a central cylindrical rigid backing electrode of small radius surrounded by a flat annular cavity below a vibrating membrane clamped at its periphery separated by an air gap, which provides good sensitivity and a large frequency bandwidth [9,10]. Honzik et al. [9] have reported that this design leads to a higher sensitivity, as well as a larger frequency bandwidth. A capacitive acoustic sensor, similar to that of a condenser microphone, can also be used as an acoustic resonant sensor by modifying different parameters related to the device fabrication. The characteristics of the damping material and other geometric parameters determine the transducer bandwidth. Generally, transducers respond to incident acoustic pressure over the entire range of relevant frequencies, whereas resonant transducers provide higher sensitivity at their natural frequencies. The design presented in Figure 1 can be a potential candidate to fabricate a capacitive acoustic resonant sensor with good selectivity at a certain frequency. During this work, we investigate the possibilities to develop the acoustic resonator based on this simplified design concept. To fulfill the
Sensors 2015, 15
8947
specific system requirement, a capacitive resonant sensor with strong sensitivity at specified frequency with narrow bandwidth is desired. To do so, one needs to optimize structural parameters, such as membrane radius, backplate radius, air gap, cavity height, membrane thickness, of the design of the acoustic sensor (Figure 1). In addition, the membrane tension and material uses to fabricate the device needed to be optimized, as well.
Figure 1. Schematic diagram of acoustic transducer. As a large number of parameters are involved in acoustic sensor optimization, numerical simulation can be a powerful and economical tool for virtual device prototyping. However, the extensive computational effort is involved in numerical simulation and thus it usually takes a substantial amount of time to complete simulation runs of a complex structure. This paper presents a new design scheme for acoustic sensor optimization that combines numerical simulation using the COMSOL Multiphysics software and design of experiments (DOE) approach to optimize the acoustic sensor of the proposed design to obtain the acoustic resonator. DOE helps to develop a plan of experiments that provides a great deal of information about the effect of input parameters on responses. In this scheme, a set of numerical experiments is conducted to generate responses. Thereafter, based on the numerical simulation results, namely, membrane displacement, capacitance variation, quality factor, etc., the response surface method (RSM) is used to derive empirical models for each of the responses, which will later be used for optimization process. The empirical model reduces computational efforts in the acoustic sensor optimization, since they are far less complex than the original finite element model. In case of a single response characteristic, optimization can simply be obtained by determining the experimental conditions that satisfied the expected response [11]. However, the performance of a capacitive acoustic resonant sensor is often characterized by a group of responses, such as static capacitance, capacitance variation, quality factor, etc. If more than one response comes into consideration, it is very difficult to select the optimal setting that can achieve all quality requirements simultaneously. Vogel et al. [12] have applied FEM and a sequential quadratic programming (SQP) method as part of the CAPA optimization module to optimize micromachined capacitive ultrasound transducer array (CMUT), the design of comb structures for use in acceleration sensors, and the optimization of an electrostatic membrane device for an integrated silicone microphone. The SQP method is generally used for a nonlinearly constrained optimization problem that approximately solves a sequence of optimization subproblems, each of which optimizes a quadratic model of the objective subject to a linearization of the constraints. However, it is difficult to implement SQP methods so that exact second derivatives can be
Sensors 2015, 15
8948
used efficiently and reliably [13]. The alternative of this approach, is to make use of a desirability function that transforms an estimated response into a scale-free value, known as global desirability [11,14,15]. With the multi-objective nature of our problem, desirability function is employed during this work to avoid the disadvantages of other methods. The objectives of this study are to investigate the effect of different parameters of the transducer on the output responses using the numerical analysis and DOE approach, and to optimize device parameters to develop acoustic resonator that provides good sensitivity and selectivity. In this regard, the first part of this paper is devoted to the theoretical analysis to understand the system, and then the construction of the finite element (FE) model of the acoustic sensor (based on the design presented in Figure 1). Thereafter, DOE is introduced to achieve greater information about the effects of different input parameters on output responses with the least possible number of experiments. Finally, multi-criteria optimization is performed to obtain the optimum set of parameters, which is verified using numerical simulation. 2. Theoretical Analysis A capacitive acoustic sensor is an electro-mechanical transducer that transforms the mechanical deformation of the diaphragm in an output signal. The capacitance ( ) of a parallel plate capacitor, with a fixed distance between the two electrodes ℎ and area of overlap of the two electrodes plates , also known as effective area, is given by C0 =
ε 0ε r S e
(1)
h0
where ε 0 represents electric constant ( ε 0 = 8.854 × 10 −12 Fm −1 ) and ε r represents the relative static permittivity of the materials between the plates (for a vacuum, ε r = 1). When an external DC voltage ( ) is applied, an electrostatic force ( and induces a membrane deformation.
) as presented by Equation (2), is created across the electrodes
Fes =
Thus the air gap ( h g ) becomes ( h0 + ξ
es
ε S Q2 = 0 2e V02 2ε 0 S e 2 h0
), where ξ
es
(2)
represents the quiescent average deformation
of membrane due to the electrostatic forces of the pre-polarization of the transducer. Therefore, the static capacitance ( ) of the acoustic sensor can be expressed as, Ci =
ε 0ε r S e ε ε S = 0 r e h0 + ξ es hg
The air gap of the transducer varies due to membrane deformation. If ξ
(3) Se
represents the average
small-signal deformation; the varied distance between the back electrode and the membrane becomes h g + ξ Se . Thus, the output capacitance ( ) due to incident pressure can be expressed as follows, Cn =
ε 0ε r S e ε ε S = 0 r e h g + ξ Se hg
ξ Se 1 − hg
ξ Se = C i 1 − hg
(4)
Sensors 2015, 15
8949
where the expression has been expanded to the first order (Taylor series). Therefore, the capacitance variation ( ) can be obtained by subtracting Equation (4) from Equation (3), ΔC = C n − C i = C i
ξ
Se
(5)
hg
On the other hand, the total voltage ( ) across the capacitor is the sum of the quiescent polarization ). The charge ( ) in the capacitor can be expressed as, voltage ( ) and the small-signal output voltage ( Q = CV
(6)
dQ = CdV + VdC
(7)
Its differentiation is given as: We assume that the system has a constant total charge, Q = q i = const. , thus dQ = 0 . The i
inclusion of this assumption in Equation (7) gives dV = −
Assuming
=
,
≈Δ ,
≈ Ci
Vout = V0
≈
,
ξ
dC V C
(8)
, and introducing them into Equation (8):
Se
hg
ξ Se C i 1 − hg
= V0
ξ
Se
hg
ξ Se 1 + hg
ξ Se ≈ V0 hg
(9)
The expression has been expanded to the first order (Taylor series), and the higher order term is negligible and thus removed. Based on the analysis, it has been observed that the capacitance variation as well as output voltage of the acoustic sensor mainly depends on the membrane displacement. Therefore, to improve the sensitivity of the sensor, we have to design the sensor which will provide high membrane displacement.
2.1. Equations Governing the Membrane Displacement The equation governing the vibration of the thin circular membrane of thickness , radius , and density under constant radial force per unit length ( ) acting on its edge, driven by uniform harmonic incident acoustic pressure over the membrane surface, loaded by the pressure field ( ), also known as reaction pressure at the membrane surface, can be expressed as [9,10,16,17]:
(
)
Tm Δ r + K 2 ξ (r ) = p i − p (r ),
0 < r < Rm
(10)
Here, ξ (r ) being the vertical membrane displacement, ∆ (equals to ∇ ) represents the Laplace operator, and
defines the wavenumber of the free flexural vibration of the membrane,
K2 =
ω 2 ρ ms Tm
=
ω2 c
2
; c=
Tm
ρ ms
and ρ ms = t m ρ m
(11)
Sensors 2015, 15
8950
where, denotes the speed of sound in the membrane, being the surface density or mass per unit area of the membrane and is the angular frequency. The membrane is supported on a rigid circular frame at its periphery = (Dirichlet boundary condition), therefore
ξ ( Rm ) = 0
(12)
The reaction pressure ( ), loading the diaphragm, is due to the underlying air layer squeezed in the air gap and in the annular cavity under the membrane, where
r ∈ (0, Re ) p (r ) p(r ) = g pc = const r ∈ (Re , Rm )
(13)
Here, p g (r ) and p c (r ) represent the pressure in the air gap and the pressure in the cavity volume which is assumed to be quasi-uniform, respectively, and represents the effective radius and is equal to the radii of the backplate electrode ( ). The incident acoustic signal (with the time factor given by e jωt ) triggers the membrane displacement ξ (r ) , which is assumed to be small and harmonic ( ξ (r )e jωt ). The membrane displacement gives rise to the motion of the air in the domain below the circular membrane, composed of the air gap and annular cavity. It is assumed that the pressure variation in air gap and cavity region are constant throughout the thickness of the fluid film; it depends only on the tangent coordinate . As the pressure variation does not depend on the -coordinate, the -component of the particle velocity ( ) can be neglected. On the other hand, the temperature variation ( ), depends on both coordinates and , which is approximately proportional to the pressure variation outside the boundary layers. The temperature variation vanishes at the interfaces between the fluid layer and the membrane = 0, and between the fluid layer and the backing electrode z = − hg . Thus the boundary conditions associated with the system are,
v r ( g ,c ) (r ,0) = v r ( g ,c ) (r ,−h g ,c ) = 0 and τ g ,c (r ,0) = τ g ,c (r ,−h g ,c ) = 0
(14)
The solution of the mean displacement of the circular membrane over the backplate electrode driven by the constant incident pressure due to the sound field can be expressed as follows [9,10]:
ξ
Se
=
1 Se
ξ (r )dS e = Se
2
π Re R m
ξn K n
J 1 ( K n Re ) n J 1 ( K n Rm )
(15)
2.2. Pressure Sensitivity The sensitivity level ( ) of the acoustic sensor for the given polarization voltage , represents the relation between the input pressure and the output voltage, and can be expressed as follows:
V0 ξ V Se L = 20 log out = 20 log p p h i g i
(16)
2.3. Resonance Frequency The selectivity of the acoustic resonant sensor depends on its natural frequency or resonance frequency. At resonance frequency, all parts of the membrane vibrate sinusoidally with the same
Sensors 2015, 15
8951
frequency and with a fixed phase relation, which provides maximum displacement of membrane and is known as normal mode of vibration. Resonance frequencies of the membrane in vacuum are solely determined by its physical dimensions and mechanical constants: namely, Young’s modulus, density of the membrane materials, size of membrane, and boundary conditions. As the maximum membrane displacement occurs at resonance frequency, it leads to the maximum sensitivity for the capacitive acoustic sensor. The natural frequencies of the pre-tensioned circular vibrating membrane in vacuum is given by [18,19],
f ij = The values
k ij
Tm
2πRm
tm ρm
=
k ij
Tm
2πRm
ρ ms
(17)
are derived from the roots of the Bessel functions of the first kind. The natural
frequencies of vibration and mode shapes are identified by two integers ( , ) that characterize the mode shape. The index = 1, 2, 3, . .. corresponds to the number of circumferential lines (with = .) on the membrane that have zero displacement, while = 0, 1, 2, … corresponds to the number of diametral lines (with = .) that have zero displacement. The values for the first six modes are listed in Table 1. Table 1. Values of
derived from the roots of the Bessel functions of the first kind for
first six modes. Mode Number 1 2 3 4 5 6
Factor k10 = 2.4048 k11 = 3.8317 k11 = 3.8317 k12 = 5.1356 k12 = 5.1356 k20 = 5.5201
However, in the case of a capacitive acoustic resonator, the membrane is usually loaded with an air cavity rather than vibrating in free space [20]. The presence of the cavity generally detunes the membrane resonance [21]. The shifts of first resonance frequency of the system towards the higher frequency than that of the membrane in vacuum occurs due to viscous damping and acoustic stiffness of the cavity.
2.4. Quality Factor The quality factor (
), which is related to the energy loss of the vibrating diaphragm [22], is
characterized by a resonator’s bandwidth relative to its center frequency. Generally, in frequency domain, -factor is expressed as,
Qf =
f r ωr = Δf Δω
(18)
where, is the resonance frequency, ∆ is the half-power bandwidth (i.e., the bandwidth over which =2 is the the power of the vibration is greater than half the power at the resonance frequency), angular resonance frequency and ∆ the angular half power bandwidth.
Sensors 2015, 15 High
8952
value represents low damping, which indicate low rate of energy loss relative to the stored
energy of the resonator [23,24]. -factor is inversely proportional to the damping coefficient of the oscillating system and define as [23], Q f = 2π
mω r K W = = γ γω r ΔW
(19)
where is the total energy stored in the resonator, ∆ is the sum of the energy loss per cycle, is the spring constant of the resonator, is the coefficient of the damping force, and is the mass of the oscillator. Thus, in the case of the acoustic resonator, higher -factor represents high selectivity. The -factor of the system can be improved by enhancing the total stored energy, while reducing the energy loss per cycle. 3. Numerical Simulation
3.1. Finite Element Model (FEM) The capacitive acoustic sensor works by transforming the mechanical deformation of the thin membrane (diaphragm), induced by an external incident pressure, into an AC voltage signal. Numerical simulation is performed using finite element method (FEM) not only to understand but also to quantify the effect of different input parameters on the membrane displacement, capacitance variation, -factor etc. The finite element simulation of the acoustic sensor is a moving boundary problem, in which the computational air domain within the sensor changes continuously, because of membrane vibration under harmonic acoustic wave. Three-dimensional (3D) FEM model is developed using half-slice of the air domain (symmetrical part), as illustrated in Figure 2, to reduce the computational time.
Figure 2. Schematic diagram of top view of the proposed acoustic sensor after removing the diaphragm.
Sensors 2015, 15
8953
Figure 3 illustrates the half-slice of the 3D air domain with finite element mesh, which was solved considering the periodicity and symmetry of the boundary value. The custom mesh is used in such a way that it resolves the acoustic boundary layer for the frequency range of 0 Hz to 250 kHz without mesh regeneration. The physical parameters of the air and the membrane materials are given in Table 2.
Figure 3. Half-slice of air domain (symmetrical part) of the acoustic sensor with finite element mesh. Table 2. List of parameters of the thermoviscous fluid (air) and material properties of the membrane. Parameter Bulk viscosity (μ ) Gas constant ( ) Density of Membrane ( ) Young’s modulus of membrane ( ) Poisson’s ratio of membrane ( )
Value 10 × 10−6 281.4 1390 4 × 10⁹ 0.38
Unit Pa·s J/(kg·K) kg/m3 Pa -
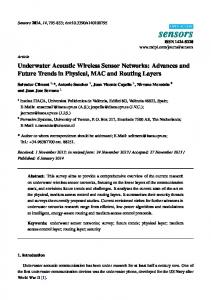
Figure 4. Measured displacement field of the membrane of the acoustic sensor at first resonance frequency ( = 16,737 Hz) for = 5 mm, = 0.75 mm, ℎ = 3000 µm, ℎg = 30 µm, = 500 N/m and = 8 µm.
Sensors 2015, 15
8954
The resulting finite element model with fully coupled thermoacoustic, electrostatic, moving mesh and membrane physics interface was solved using the linear-perturbation solver, PARDISO, in the frequency domain. Solution of the numerical simulation provides the membrane displacement with respect to frequencies. Figure 4 presents the membrane displacement at first resonance frequency ( ). COMSOL Multiphysics software (version 4.4) is used to perform 3D numerical simulation. All the numerical works have been executed on a workstation, DELL PRECISION T7600, having 32 Gigabytes RAM and 16 cores (two 3.1 GHz eight-core Intel Xeon E5-2687W processors). The validation of the numerical model is checked by comparing the maximum membrane displacement of the numerical analysis with that of the theoretical analysis as presented in Equation (15). The results show proximate similarity as depicted in Figure 5. A little shift of the resonance frequency and a slightly smaller magnitude of the membrane displacement are obtained in the FEM results. They are caused by the presence of the interconnection channel to electrically connect the bottom electrode with the outside and venting hole in the geometry as it is in the real device; whereas for simplicity the effect of the interconnecting channel and venting hole are not considered in the theoretical analysis.
Figure 5. Comparison of the membrane displacement of theoretical and numerical analysis of the acoustic transducer (for = 5 mm, = 0.75 mm, ℎ = 3000 µm, ℎ g = 30 µm, = 500 N/m and = 8 µm).
3.2. Selection of Parameters and Responses Based on the theoretical analysis and the device structure, several parameters, such as membrane radius ( ), bottom electrode radius ( ), cavity height (ℎ ), air gap (ℎg), membrane tension ( ), membrane thickness ( ), materials properties (e.g., Young’s modulus, density of the materials and Poisson ratio), and the venting hole geometry, are involved with device performance. During this study, geometry of the venting hole was kept unchanged and the polyethylene terephthalate (PET) thin film was used as a membrane material, whose properties are listed in Table 2. Thus venting-hole geometry and material properties were omitted from the further analysis. The static capacitance of the system is generally determined by the effective surface area of the electrodes and air gap, whereas the quality factor depends on the damping loss mechanism that is related
Sensors 2015, 15
8955
to the device geometry. On the other hand, the sensitivity of the acoustic sensor, such as capacitance variation, is basically driven by the membrane displacement. Therefore, the first step of this work is identification of major input parameters that strongly influence the membrane displacement and quality factor. In this regard, the classic one-variable-at-a-time method is used, where the effect of individual parameter on the membrane displacement at first resonance frequency was studied for a fixed set of other parameters at some nominal value using numerical simulation. The process is repeated for each of the parameters involved in the study until all the parameters have been studied.
Figure 6. Effect of individual input parameter on the membrane displacement (other = 5 mm, = 0.75 mm, ℎ = 3000 µm, ℎg = 30 µm, parameters kept at constant value: = 500 N/m and = 8 µm). It has been observed that the increase of the membrane displacement and quality factor, and shift of the resonance frequency are observed for the increasing membrane radius, as shown in Figure 6A. On the other hand, the increase of the bottom electrode radius leads to reduction of membrane displacement and quality factor (Figure 6B). Figure 6C illustrates the effect of cavity height on the membrane displacement. Large cavity height helps to reduce the air damping in the cavity and thus helps to increase
Sensors 2015, 15
8956
the membrane displacement and quality factor. Similarly, increase in air gap provides higher membrane displacement and quality factor (Figure 6D); however, the increase in air gap leads to the lower static capacitance. In addition, as shown in Figure 6E, higher membrane tension reduces the membrane displacement, and also shifts the resonance at a higher frequency. Thickness of the membrane also affects the membrane displacement and the resonance frequency (Figure 6F). Based on the initial tests, it has been observed that all six input parameters, namely , , ℎ , ℎ g, and , have some influence on the membrane displacement and -factor, and therefore on the output responses. Moreover, to achieve better selectivity, the sensitivity at other natural frequencies than the first resonance frequency has to be reduced. Therefore, in order to study and eventually to optimize the capacitive acoustic resonator to fulfill the requirements, several output responses, specifically static capacitance ( ), membrane displacement at first resonance (|˂ξSe˃|fr1), quality factor ( ), capacitance variation ( ∆ ), and membrane displacement at second resonance (|˂ξSe˃|fr2) were studied for each experiment. However, the one-variable-at-a-time approach cannot predict the interaction between the factors. In addition, this approach is not applicable for multiple response problems, and does not permit the construction of a model for the system [25]. Therefore, the study of the influence of all the input parameters and their interactions, and the optimization of the system requires methodical experimental strategies based on DOE. A good experimental strategy will provide the necessary information to estimate effects of factors and to develop empirical models for each system outputs and to optimize the multiple responses simultaneously to fulfill the objectives. 4. Experimental Design DOE provides a systematic way to study the effects of the input variables of a system or process, also known as factors, on outputs or responses. It is an effective tool for maximizing the amount of information gained from a study while minimizing the number of tests to be performed. In practice, DOE is applicable to both physical processes and numerical simulation models [26,27]; however, unlike physical measurement, numerical experimentation is not subject to noise or uncertainty [28,29]. Compared to other experimental strategies, namely one-variable-at-a-time and sequential simplex, RSM is intended to predict the response with a good quality all over the experimental domain. RSM approach has four basic steps: the data collection according to an experimental design, an empirical model (e.g., polynomial), calculation by least squares regression for each of the responses, generation of response surface contour plots or maps that are examined to the region of the desired response, and finally, the experimental verification of the predicted optimum [25]. DOE coupled with RSM can achieve rapid process development for minimal cost. The selection of appropriate experiments is very important to build a reliable response surface model and therefore on its precise prediction [30]. According to the postulated model, there are different optimal design of experiments with a guarantee of good prediction in the domain of interest. One of the best known for a second-order model is the class of central composite design (CCD), consisting of a two-level complete or fractional factorial design, an “axial” design, and center points [30]. A series of FEM analyses of an acoustic sensor based on DOE have been performed to investigate the possibility of determining the optimal set of parameters to fabricate a sensor with optimum sensitivity
Sensors 2015, 15
8957
and selectivity. The optimization is carried out to maximize the membrane displacement at first resonance frequency of the system, while minimizing the membrane displacement at other frequencies. The feasible domain is defined by the six factors, namely , , ℎ , ℎg, , and . The ranges of the six factors used in the numerical experiments are presented in Table 3; these values were selected based on the process capabilities of our equipment to fabricate devices. Table 3. List of experimental variables (factors) and their ranges. Factors Membrane Radius ( ) Bottom Electrode Radius ( ) Cavity Height (ℎ ) Air gap (ℎg) Membrane Tension ( ) Film Thickness ( )
Code
Range 4–10 mm 0.25–3 mm 1000–4000 μm 3–80 μm 100–3000 N/m 8–25 μm
The variation domains of the six factors define a hypercube in six dimensions, and a second-order model was postulated to represent the evolution of the responses in this domain and optimize the acoustic resonant sensor. To estimate the coefficients of the model, a CCD was built with some additional points corresponding to a space-filling design to cover the entire domain. A total of 62 experiments were employed and listed in Table 4. These experiments were performed using numerical simulation, and for each experimental run, , |˂ξSe˃|fr1, , ∆ and |˂ξSe˃|fr2 were collected for further analysis and empirical model building. During this study, “nemrodW” statistical software [31] is used to develop experimental strategies and search for optimal settings. Table 4. DOE Table for acoustic sensor study. N°Exp
Rm
Rb
hc
hg
Tm
tm
mm
mm
µm
µm
N/m
µm
1
4
0.25
1000
3
3000
8
2
10
0.25
1000
3
100
3
4
3
1000
3
4
10
3
1000
5
4
0.25
6
10
7
4
8
N°Exp
Rm
Rb
hc
hg
Tm
tm
mm
mm
µm
µm
N/m
µm
32
10
3
4000
80
100
25
8
33
10
0.25
1000
3
3000
25
100
8
34
4
3
1000
3
3000
25
3
3000
8
35
4
0.25
4000
3
3000
25
4000
3
100
8
36
10
3
4000
3
3000
25
0.25
4000
3
3000
8
37
4
0.25
1000
80
3000
25
3
4000
3
3000
8
38
10
3
1000
80
3000
25
10
3
4000
3
100
8
39
10
0.25
4000
80
3000
25
9
4
0.25
1000
80
100
8
40
4
3
4000
80
3000
25
10
10
0.25
1000
80
3000
8
41
10
1.625
2500
41.5
1550
16.5
11
4
3
1000
80
3000
8
42
7
0.25
2500
41.5
1550
16.5
12
10
3
1000
80
100
8
43
7
1.625
1000
41.5
1550
16.5
13
4
0.25
4000
80
3000
8
44
7
1.625
2500
3
1550
16.5
14
10
0.25
4000
80
100
8
45
7
1.625
2500
41.5
100
16.5
15
4
3
4000
80
100
8
46
7
1.625
2500
41.5
3000
16.5
Sensors 2015, 15
8958 Table 4. Cont.
N°Exp
Rm
Rb
hc
hg
Tm
tm
N°Exp
Rm
Rb
hc
hg
Tm
tm
16
10
3
4000
80
3000
8
47
5.9
1.322
2266
36.9
1407
15.8
17
4
1.625
2500
41.5
1550
8
48
8.1
1.322
2266
36.9
1407
15.8
18
10
1.625
2500
41.5
1550
8
49
7
2.231
2266
36.9
1407
15.8
19
7
0.25
2500
41.5
1550
8
50
7
1.625
3202
36.9
1407
15.8
20
7
3
2500
41.5
1550
8
51
7
1.625
2500
60.1
1407
15.8
21
7
1.625
1000
41.5
1550
8
52
7
1.625
2500
41.5
2265
15.8
22
7
1.625
4000
41.5
1550
8
53
7
1.625
2500
41.5
1550
20.8
23
7
1.625
2500
3
1550
8
54
4
0.5
1000
80
100
8
24
7
1.625
2500
80
1550
8
55
4
0.5
4000
80
3000
8
25
4
0.25
1000
3
100
25
56
10
0.5
4000
80
100
8
26
10
3
1000
3
100
25
57
7
0.5
2500
41.5
1550
8
27
10
0.25
4000
3
100
25
58
7
0.5
2500
80
1550
8
28
4
3
4000
3
100
25
59
4
0.5
4000
80
100
25
29
10
0.25
1000
80
100
25
60
4
0.5
1000
80
3000
25
30
4
3
1000
80
100
25
61
10
0.5
4000
80
3000
25
31
4
0.25
4000
80
100
25
62
7
0.5
2500
60.1
1407
15.8
5. Result and Discussion
5.1. Empirical Model Building and Analysis To perform data analysis, the experimental data are first transformed into logarithmic scale to get symmetric distribution. The coefficients of the models are then estimated using common regression analysis techniques [27,32] to solve indicates the matrix of factors and × × = × , where factor interactions, vector is the experimental results for one response in logarithmic scale, and vector is the unknown coefficients. Generally, is estimated by resolving the linear system of equations, and ) , where “ ” and “−1” represent the transpose and inverse matrix, can be expressed as = ( respectively. Once the coefficients are computed, the equation of the empirical model for each response is entirely defined. For simplicity only the most significant terms of the empirical models are mentioned in the Equations (20) to (24) below, although each second order polynomial response equation consists of 28 terms. = 0.29743 + 0.09489 + 0.43464 |〈
〉|
+ 0.61423
− 0.71485
− 0.04947
− 0.09846
− 0.08399
= 1.28557 + 0.22517 − 0.24669
− 0.87877
+ 0.11454
+ 0.51751
+ 0.25368 − 0.46702
+ 0.95558 − 0.29140
+ 0.14770
+ 0.18454
− 0.06673
− 0.19040
+ 0.09034
+ 0.11223
− 0.06130
+ 0.06152
+ 0.13720
(20)
(21)
Sensors 2015, 15
8959
= 1.16077 − 0.45781 − 0.31853
+ 0.09958
+ 0.24556
+ 0.30512
− 0.16106
− 0.19291
+ 0.12421
+ 0.17754
∆
+ 0.09090
− 0.19310
+ 0.15244 + 0.16241
+ 0.26101
− 0.24636
+ 0.64695
+ 0.15244
+ 0.11822
〉|
+ 0.09150
= 0.43405 + 0.24954 − 0.76316 + 0.14111
+ 0.11199 − 0.61280
+ 0.45812
(22)
+ 0.36619
− 0.44159
(23)
+ 0.19087
+ 0.14269 + 0.44395
− 0.11145
− 0.15529
+ 0.75406
− 0.61056
+ 0.19565
= −0.11475 + 0.24282 − 0.20920
|〈
+ 0.12209
− 0.40514
(24)
+ 0.21407
− 0.24556
− 0.24635
where YC0, Y|˂ξse˃|fr1, YQf, Y∆C and Y|˂ξse˃|fr2 represent the empirical models of the responses for |˂ξSe˃|fr1, , ∆ and |˂ξSe˃|fr2, respectively, and , , , , , and are the coded values of , ℎ , hg,
and
, respectively.
Table 5. Analysis of variance (ANOVA) table of estimated models. Degrees of Freedom 27 30 57
Mean Square 1.5634 0.0003
Regression
99.2762
27
3.6769
Residuals
1.0094
31
0.0326
100.2856
58
Y|˂ξSe˃|fr2 = Log(|˂ξSe˃|fr2)
Y∆C = Log(∆C)
YQf = Log(Qf)
Y|˂ξSe˃|fr1 = Log(|˂ξSe˃|fr1)
Source of Variation
YC0 = Log(C0)
Regression Residuals Total R-Squared (R2) Adj. R-Squared (Ra2)
Sum of Squares 42.2128 0.0076 42.2204 1 1
Model
Total 2
R-Squared (R )
Ratio
Sig.
6205.1558