Chemical Composition and Physical Properties of Manganese Minerals . 11. Table 2.6. ...... with six MoSi2 heating elements. Two H2SO4 filled ..... Kirk-Othmer, âEncyclopedia of Chemical Technologyâ, 3rd Edition, Volume. 14, pp.824-843, ...
OPTIMIZATION OF CONDITIONS TO PRODUCE MANGANESE AND IRON CARBIDES FROM DENİZLİ-TAVAS MANGANESE ORE BY SOLID STATE REDUCTION
A THESIS SUBMITTED TO THE GRADUATE SCHOOL OF NATURAL AND APPLIED SCIENCES OF MIDDLE EAST TECHNICAL UNIVERSITY
BY
CEM AKIL
IN PARTIAL FULFILLMENT OF THE REQUIREMENTS FOR THE DEGREE OF MASTER OF SCIENCE IN METALLURGICAL AND MATERIALS ENGINEERING
JANUARY 2007
Approval of the Graduate School of Natural and Applied Science
Prof. Dr. Canan ÖZGEN Director I certify that this thesis satisfies all the requirements as a thesis for the degree of Master of Science.
Prof. Dr. Tayfur ÖZTÜRK Head of Department This is to certify that we have read this thesis and that in our opinion it is fully adequate, in scope and quality, as a thesis for the degree of Master of Science.
Prof. Dr. Ahmet GEVECİ Supervisor Examining Committee Members Prof. Dr. Naci SEVİNÇ
(METU, METE)
Prof. Dr. Ahmet GEVECİ
(METU, METE)
Prof. Dr. İshak KARAKAYA
(METU, METE)
Prof. Dr. Yavuz TOPKAYA
(METU, METE)
Prof. Dr. Ümit ATALAY
(METU, MINE)
I hereby declare that all information in this document has been obtained and presented in accordance with academic rules and ethical conduct. I also declare that, as required by these rules and conduct, I have fully cited and referenced all material and results that are not original to this work.
Name, Last name : Cem AKIL Signature
iii
:
ABSTRACT
OPTIMIZATION OF CONDITIONS TO PRODUCE MANGANESE AND IRON CARBIDES FROM DENİZLİ-TAVAS MANGANESE ORE BY SOLID STATE REDUCTION
Akıl, Cem M.S., in Department of Metallurgical and Materials Engineering Supervisor: Prof. Dr. Ahmet GEVECİ January 2006, 66 pages
Main purpose of this study was to find the optimum conditions to produce a charge material for ferromanganese production or steelmaking with high content of iron and manganese carbides from Denizli-Tavas manganese ore by carbothermic reduction and investigate the effects of temperature, time, amount of active carbon addition and CaO addition on this reduction. The ore was calcined and then mixed with active carbon and CaO. Experiments were performed in a horizontal tube furnace that can be heated up to 1700 ºC with MoSi2 heating elements. After each experiment weight loss data were obtained and converted to percentage reduction. X-Ray, SEM-EDS and chemical analyses were done in order to determine whether or not carbide phases have been obtained, and calculate the composition of the product.
iv
Considering the experimental results, the optimum conditions found for reduction of Denizli-Tavas manganese ore were 1250 °C, 4 hours, 100% of stoichiometric amount of active carbon and 5% CaO addition. Under the optimum conditions 83.85% reduction of calcined ore was obtained.
Keywords: Solid state reduction, manganese carbide, iron carbide.
v
ÖZ
DENİZLİ-TAVAS MANGANEZ CEVHERİNDEN KATI HAL İNDİRGEME YÖNTEMİ İLE MANGANEZ VE DEMİR KARBÜR ÜRETİMİ İŞLEMİNİN OPTİMİZASYONU
Akıl, Cem Yüksek Lisans, Metalurji ve Malzeme Mühendisliği Bölümü Tez Yöneticisi: Prof. Dr. Ahmet GEVECİ Ocak 2006, 66 sayfa
Bu
çalışmanın
temel
amacı
Denizli-Tavas
manganez
cevherinden
karbotermik indirgeme ile ferromanganez veya çelik üretiminde kullanılabilecek yüksek miktarda manganez ve demir karbür içeren bir şarj malzemesi üretiminde en uygun koşulların belirlenmesi ve bu amaca yönelik olarak sıcaklık, zaman, karbon ilavesi
ve
eklenen
CaO
miktarının
bu
indirgeme
üzerindeki
etkilerinin
araştırılmasıdır. Cevher kalsine edilmiş ve ardından aktif karbon ve CaO ile karıştırılmıştır. Deneyler MoSi2 ısıtma elemanlarıyla 1700 ºC sıcaklığa kadar ısıtılabilen yatay bir tüp fırınında gerçekleştirilmiştir. Her deney için ağırlık kaybı bulunmuş ve yüzde indirgenmeye çevrilmiştir. X-Ray, SEM-EDS ve kimyasal analiz yöntemleri karbür fazlarının elde edilip edilmediğini anlamak ve ürünün kompozisyonunu hesaplamak amacıyla uygulanmıştır.
vi
Deneysel sonuçlara göre Denizli-Tavas manganez cevherinin indirgenmesi için en uygun koşullar; 1250 ºC, 4 saat, stokiyometrik miktarda aktif karbon ve %5 CaO ilavesi şeklinde belirlenmiştir. En uygun koşullarda, kalsine edilmiş cevherde %83,85 indirgenme elde edilmiştir. Anahtar Kelimeler: Katı hal indirgeme, mangan karbür, demir karbür.
vii
To My Parents; Yavuz and Hülya Akıl
viii
ACKNOWLEDGEMENTS
I express my sincere appreciation to Prof. Ahmet Geveci who has always assisted and guided me in my research, and spend his valuable time on solving problems that I have faced during my experiments. Thanks go also to Hamdiye Eskiyazıcı for chemical analyses, İsa Hasar for technical support, Necmi Avcı for X-Ray analyses and Cengiz Tan for SEM-EDS analyses. I would like to thank my roommates; Nezih, İlhan and Cumali for their amazing friendship during my METU days. Gratefully thanks to my dear brothers Serkan Yılmaz and Emre Ustaoğlu for encouraging and cheering me up in every single moment throughout these two years. Thanks also go to Şükran Şen and Sibel Yılmaz for their support. And finally special thanks go to my mother, my dad and my sister for their endless patience, encouragement and love.
ix
TABLE OF CONTENTS
PLAGIARISM ............................................................................................................. iii ABSTRACT................................................................................................................. iv ÖZ
......................................................................................................................... vi
ACKNOWLEDGEMENTS ......................................................................................... ix TABLE OF CONTENTS.............................................................................................. x LIST OF TABLES ...................................................................................................... xii LIST OF FIGURES ................................................................................................... xiv CHAPTER 1. INTRODUCTION................................................................................................ 1 2. LITERATURE REVIEW.................................................................................... 3 2.1. HISTORY OF MANGANESE ................................................................................. 3 2.2. PROPERTIES AND USAGE OF MANGANESE......................................................... 4 2.3. MANGANESE ORE ............................................................................................. 6 2.3.1. Manganese Minerals ................................................................................ 9 2.3.2. Manganese Ore Beds ............................................................................. 11 2.3.3. Manganese in Turkey............................................................................. 12 2.4. FERROMANGANESE ......................................................................................... 13 2.4.1. Types of Ferromanganese ...................................................................... 13 2.4.2. Production of Ferromanganese .............................................................. 15 2.5. THERMODYNAMICS OF REDUCTION OF MANGANESE OXIDES ......................... 20 2.5.1. Reduction of Higher Manganese Oxides ............................................... 20 2.5.2. Reduction of Manganous Oxide ............................................................ 24 2.6. PREVIOUS STUDIES ON DENIZLI-TAVAS MANGANESE ORES ........................... 29 3. EXPERIMENTAL ............................................................................................ 31 3.1. MATERIALS USED IN EXPERIMENTS ............................................................... 31
x
3.1.1. Denizli-Tavas Manganese Ore .............................................................. 31 3.1.1.1. Preparation of Ore……………………………………………….31 3.1.1.2. Mineralogy of Ore……………………………………………… 32 3.1.1.3. Calcination of Ore……………………………………………… 33 3.1.2. Active Carbon........................................................................................34 3.1.3. Calcium Oxide.......................................................................................34 3.1.4. Crucibles................................................................................................35 3.2. EXPERIMENTAL SETUP & PROCEDURE………………………………………. 35 3.1.4. Calibration............................................................................................37 3.1.4. Experimental Procedure.......................................................................39 4. RESULTS AND DISCUSSION........................................................................42 4.1. EXPERIMENTAL RESULTS ……………………………………………………42 4.2. EFFECT OF TEMPERATURE …………………………………………………...43 4.3. EFFECT OF DURATION ……………………………………………………….46 4.4. EFFECT OF AMOUNT OF ACTIVE CARBON …………………………………...48 4.5. EFFECT OF CAO% ADDITION ……….……………………………………….51 5. CONCLUSIONS................................................................................................54 REFERENCES..........................................................................................................56 APPENDICES A: SAMPLE ACTIVE CARBON REQUIREMENT CALCULATION ................ 60 B: SAMPLE CALCULATION OF COMPOSITION AND CARBIDES FROM SEM ANALYSIS....................................................................................................
62
C: SAMPLE REDUCTION PERCENTAGE CALCULATION............................. 64
xi
LIST OF TABLES
TABLES
Table 2.1. Properties of Manganese.............................................................................. 4 Table 2.2. Manganese Ore Wet Production by Grade (2003-2004) ............................. 7 Table 2.3. Mn Ore Production in the World (1986-1990) ............................................ 8 Table 2.4. World Manganese Reserves......................................................................... 8 Table 2.5. Chemical Composition and Physical Properties of Manganese Minerals . 11 Table 2.6. Production from Denizli-Tavas Manganese Ore Bed ................................ 13 Table 2.7. ASTM Standards of Ferromanganese ........................................................ 15 Table 2.8. Ferromanganese World Production by Country ........................................ 16 Table 2.9. Ferromanganese Consumption in Turkish Steel Industry.......................... 17 Table 3.1. Screen Analysis of the Denizli-Tavas Manganese Ore.............................. 32 Table 3.2. Chemical Composition of Denizli-Tavas Manganese Ore ....................... 33 Table 3.3. Experimental Variables.............................................................................. 40 Table 4.1. Results of the Experiments ........................................................................ 43 Table 4.2. Composition of the Products in Temperature Experiments ....................... 44 Table 4.3. Amount of Carbides in Temperature Experiments .................................... 45 Table 4.4. Composition of the Products in Duration Experiments ............................. 47 Table 4.5. Amount of Carbides in Duration Experiments .......................................... 47 Table 4.6. Composition of the Products in Amount of Active Carbon Experiments . 50 Table 4.7. Amount of Carbides in Amount of Active Carbon Experiments............... 50 Table 4.8. Composition of the Products in CaO% Addition Experiments ................. 52 Table 4.9. Amount of Carbides in CaO% Addition Experiments............................... 53 xii
LIST OF FIGURES
FIGURES
Figure 2.1. Free Energy Change as a Function of Temperature for Reduction Reactions of Mn2O3 and Mn3O4 .................................................................................. 22 Figure 2.2. Stability Relations of the phases Mn2O3 and Mn3O4 as a function of O2 pressure and temperature ............................................................................................ 23 Figure 2.3. Stability Relations of the phases Mn3O4 and MnO as a function of O2 pressure and temperature............................................................................................. 23 Figure 2.4. Plots of log PCO/ PCO2 against temperature for equations (20) and (21) 25 Figure 2.5. Binary Mn-C Phase Diagram ................................................................... 26 Figure 2.6. Free Energy Changes for the Reduction of MnO with C or Fe3C as a Function of Temperature............................................................................................. 27 Figure 2.7. Oxygen Potential Temperature Diagram for The Mn-O-C system .......... 28 Figure 3.1. X-Ray Diffraction Analysis of Calcined Ore ........................................... 34 Figure 3.2. Schematic View of the Tube Furnace....................................................... 36 Figure 3.3. Temperature Profile of the Tube Furnace................................................. 37 Figure 3.4. Calibration Line of Set Temperature versus Actual Temperature............ 38 Figure 3.5. Calibration Chart for Flowmeter .............................................................. 38 Figure 3.6. Flowchart of the Experimental Procedure ................................................ 41 Figure 4.1. % Reduction versus Temperature Graph (100% stoichiometric amount of carbon, 5% CaO addition, 2 hours)............................................................................. 44 Figure 4.2. XRD Diagram of the product before leach and after leach (1200 °C, 100% stoichiometric amount of carbon, 5% CaO addition, 2 hours) ......................... 45
xiii
Figure 4.3. % Reduction versus Duration Graph (100% stoichiometric amount of carbon, 5% CaO addition, 1250 ºC)............................................................................ 46 Figure 4.4. XRD Diagram of the product before leach and after leach (1250 °C, 100% stoichiometric amount of carbon, 5% CaO addition, 4 hours) ......................... 48 Figure 4.5. % Reduction versus Amount of Carbon Graph (5% CaO addition, 1250 ºC, 4 hours).................................................................................................................. 49 Figure 4.6. XRD Diagram of the product before leach and after leach (1250 °C, 150% stoichiometric amount of carbon, 5% CaO addition, 4 hours) ......................... 51 Figure 4.7. % Reduction versus CaO% Addition Graph (100% stoichiometric amount of carbon, 1250 ºC, 4 hours) ....................................................................................... 52 Figure 4.8. XRD Diagram of the product before leach and after leach (1250 °C, 100% stoichiometric amount of carbon, 10% CaO addition, 4 hours) ....................... 53
xiv
CHAPTER 1
INTRODUCTION
Manganese is used as an alloying element for its beneficial properties such as strength, hardenability, toughness and workability of ferrous products and it is also essential to iron and steel production by virtue of its sulphur-fixing, deoxidizing, and alloying properties. Most of the manganese used in iron and steel industry are in the form of ferromanganese and silicomanganese. The addition of manganese can be in the form of its ore during the ironmaking or as ferromanganese alloy in the steelmaking stage. Ferromanganese demand of Turkish iron and steel industry is increasing continuously with respect to the growth in the steel production. Since there is no ferromanganese production plant in Turkey all this demand is supplied by importing. On the other hand studies [1] have shown that Turkish manganese ore reserves are around 4.6 million tons and the largest manganese ore beds which contain approximately 4 million tons of these reserves are located in the Denizli-Tavas region. This is a carbonate type ore body with a 30-31% manganese tenor which is relatively low. The studies which were conducted with Denizli-Tavas manganese ore in this department showed that it could be used in production of ferromanganese but the product was not very close to standard high carbon ferromanganese and should be subjected to some pre-treatment operations.
1
In this work optimization of conditions in the production of manganese-iron carbides from Denizli-Tavas manganese ore by solid state carbothermic reduction in argon atmosphere was investigated. The ore was calcined and then mixed with active carbon and CaO. Experiments was performed in a horizontal tube furnace at temperatures ranging from 1150 to 1250 °C and for periods varying between 2 to 6 hours to understand the effects of the parameters; temperature, time, carbon percentage and CaO percentage. After each experiment weight loss data was obtained and converted to percentage reduction. XRD and SEM analysis was done in order to determine whether or not carbide phases have been obtained.
2
CHAPTER 2
LITERATURE REVIEW
2.1. History of Manganese Manganese is an element which has numerous applications in industry. Roughly 95% of all manganese units are used in iron and steel production nowadays and the remaining parts are used for the production of dry cell batteries and for certain chemical aims. The first utilization of it can be traced back to ancient times. Spartans used the presence of manganese in the iron ore to make their steel weapons superior to their opponents. Ancient Egyptians and Romans used it to control the color of glass and to glaze the surface of pottery in brown and this had been the main use for manganese until the 18th century [1]. In 1774 Scheele, a Swedish chemist, recognized manganese as an element and one of his collaborators J.G. Gahn isolated it in the same year. J.F. John obtained an impure metal by reducing the carbonate at a high temperature with charcoal, mixed with a small amount of oil in 1807 and after that Prieger in Germany produced a ferromanganese containing 80% manganese in a crucible in 1826 [1]. Right after J.M. Heath demonstrated that manganese improved the malleability of the ferrous product, Robert Mushet suggested adding manganese in the form of ‘Speigeleisen’ (20% manganese iron-alloy) to Bessemer steel process. Sir Henry Bessemer was experiencing difficulty with an excess of residual oxygen and sulphur in steel and this procedure made the Bessemer process possible, and thus 3
paved the way for the modern steel industry. Later, in 1866, Sir William Siemens patented the use of ferromanganese in steelmaking so as to control the levels of phosphorus and sulphur. Since then, manganese has been necessary for the commercial production of almost all steels. Today manganese is generally used in iron and steel industry in the form of ferromanganese or silicomanganese [2]. 2.2. Properties and Usage of Manganese Manganese, 7th group element of the periodic table, is the twelfth most abundant element in the earth’s crust. The most common isotopes of manganese are 51
Mn, 52 Mn, 54 Mn, 55 Mn, and 56 Mn. But only 55 Mn is stable in nature. Its valances
in nature are +2, +3, +4, and +7. Thus for the formation of manganese in oxide form in mines, a high oxidation potential is required [3]. Some physicochemical properties of manganese (for α form) are listed in Table 2.1. Table 2.1 Properties of Manganese Atomic number Atomic weight Density (@ 293 K) Atomic volume Group Discovered Melting point Boiling point
25 54.9380 7.43 g/cm3 1.39 cm3/mol Trans. Met. 1774 1517 K (1244 ºC) 2423 K (2150 ºC)
Appearance & Characteristics Color Characteristics
gray-white hard, brittle
Chemically pure manganese is obtained by reducing of manganese oxides with alkaline metals or with calcium and magnesium. In addition there is an electrolytic method of producing pure manganese. When manganese oxides are reduced by hybrids of alkaline-earth metals, it is possible to obtain metal manganese containing 99.999% Mn [4]. 4
Manganese has a wide range of usage areas in metallurgy such as a desulphurizer, a mild deoxidant, a pearlite refiner, a ferrite toughener, for hardenability and in Hadfield steels. One of the two most well known functions of the manganese is as a desulphurizer. Sulphur is one of the most troublesome elements in steel. During steel production iron forms an alloy with sulphur, which has a very low melting point. So material tends to crack in high temperature applications, such as hot rolling, due to fluid segregation. This situation is known as ‘hot shortness’ in literature. With the addition of manganese to steel in prefence to iron sulphide, manganese sulphide, which has a higher melting point than iron sulphide, is formed and hinder that situation. But desulphurization processes reduce the need for manganese in this respect. The other well known function of manganese is as a deoxidizer. It is used principally in combination with silicon, for deoxidation of steel. Some 30% of the manganese is still used for these two main properties today. The other 70% of manganese is used purely as an alloying element for steels. It lowers the temperature at which austenite transforms into ferrite, thus avoiding cementite precipitation at ferrite grain boundaries, and by refining the resulting pearlitic structures and gives rise to ferrite formation. Therefore, it increases the hardenability of steel and gives higher strength and better toughness. Steels containing 10-14 percent manganese are known as ‘Hadfield Steels’ and are extremely hard and tough. Manganese improves the response of steel to quenching by its effect on the transformation temperature. Manganese is also a weak carbide former. Both properties are advantageous in heat treated steels specified by mechanical engineers. Another important property of manganese, like nickel, is its ability to stabilize austenite in steel. It is not as powerful as nickel to achieve this effect but it has an advantage of being much less expensive. Manganese also increases the work hardening rate, thus improves mechanical properties [5]. Manganese compounds have other important applications in industry such as deoxidizer in copper alloys, depolarizing agent in dry cell batteries and alloying 5
element for aluminum to increase its corrosion resistance. For the future manganese and its alloys are expected to be used in a variety of applications such as low cost shape memory alloys, low cost stainless steels, manganese stainless steels and highspeed transportation [6]. 2.3. Manganese Ore Manganese occurs widely in crystalline rocks, from which it is dissolved and deposited as the oxide, hydroxide, or the carbonate. Nevertheless it is only rarely found in concentrations high enough to form a manganese ore deposit. Among some 300 minerals containing manganese, only a dozen are of mining significance. Current estimates of world manganese reserves including low grade ore, reach several billion tons. But if only high grade ores (defined as having more than 44% Mn content) are considered then reserves are in the range of 680 million tons of ore, essentially situated in the Western World, with Australia, Brazil, Gabon and South Africa, supplying over 90% of the international market. Ghana and India, both large suppliers of the Western World in the past, are now exporting only limited quantities of low or medium grade ore. The ore mined in Mexico is mostly for internal usage, but some part is exported [7]. The CIS (Commonwealth of Independent States), which as the USSR (Union of Soviet Socialist Republics) was the largest supplier of manganese ore at the beginning of the century, is now left with low grade ore reserves which have to be upgraded for commercial use. Only a limited amount of these reserves is exported, in quantities that are likely to decrease. Manganese ore deposits are widely distributed in China, but there is no high grade ore, nor are important reserves and mines generally situated far from the end-user industries: in consequence China imports high grade ores to blend with native material. Land-based resources are large but irregularly distributed; those of the United States are of very low grade and have potentially high extraction costs. South Africa
6
accounts for about 80% of the world’s identified resources, and Ukraine accounts for about 10%. See Tables 2.2, 2.3 and 2.4 for the reserves and production. Manganese ore is classified according to its content of manganese. An ore with manganese content over 35% is a manganese ore, an ore with manganese content of 10-35% range is a manganese-iron ore, and an ore with manganese content of 5% is an iron-manganese ore depending on its iron content. Manganese ore is also classified as metallurgical, battery and chemical quality ores. Metallurgical ore is used in ferromanganese or special manganese alloy production or as chemicals. Battery ores are natural or artificial. They are manganese oxide with various purities. Chemical quality manganese ores are classified as group A or group B depending on their manganese, iron and silica contents [8]. Table 2.2 Manganese Ore Production by Grade (2003-2004) [7] 2004 2004 *units in 000 metric 2003 Q1 Q2 tons Total GRADE with ≥ 44% Mn content Total Europe 2.5 2.5 4.0 Africa & 4376.0 1253.4 1376.8 Middle East Americas 1678.7 493.1 587.3 Asia and Oceania 2448.4 896.6 868.1 TOTAL 8505.6 2618.6 2836.2 GRADE with > 30% and < 44% Mn content Total Europe 2925.1 705.0 725.0 Africa & 1559.8 355.0 435.7 Middle East Americas 898.8 84.6 91.0 Asia and Oceania 2149.0 567.0 567.0 TOTAL 7532.8 1711.6 1818.6 GRADE with ≤ 30% Mn content Total Europe 592.2 150.0 160.0 Africa & 1155.6 348.4 304.9 Middle East Americas 363.8 93.7 121/8 Asia and Oceania 7350.0 2450.0 2500.0 TOTAL 9464.7 3402.2 3086.7 TOTAL (ALL GRADES) 25503.0 7372.3 7741.5
7
2004 Q3
2004 Q4
2004 Total
4.0 1466.6
4.0 1517.7
15.5 5614.5
526.0 952.8 2924.4
543.9 833.2 2897.8
2150.3 3296.7 11277.0
725.0 341.7
735.0 338.2
2890.0 1470.6
209.7 615.0 1891.4
441.0 693.0 2207.2
826.2 2442.0 7628.8
165.0 332.3
165.0 304.1
640.0 1289.7
105.1 2550.0 3102.4
112.9 2550.0 3132.0
435.5 10000.0 12363.2
7318.1
8237.1
31269.0
Table 2.3 Mn Ore Production in the World (2000-2004) [15]
Countries
*units in 000 metric tons 2000 2001
2002
2003
2004
Australia
1614
2069
2187
2555
3381
Brazil Gabon India S. Africa China Other TOTAL
1925 1743 1550 3635 3500
1970 1791 1600 3266 4300
2529 1856 1700 3322 4500
2544 2000 1650 3501 4600
2732 2500 1700 4207 4500
5633 19600
5904 20900
6106 22200
7250 24100
7280 26300
Table 2.4 World Manganese Reserves [16] Countries Africa South Africa Gabon Ghana Morocco Asia China Georgia India Europe Ukraine Others Middle & South America Brazil Mexico Oceania Australia WORLD TOTAL
Reserve (Million Tons)
% in Total
370 45 1 1
54.2 6.6 0.1 0.1
40 7 24
5.9 1.0 3.5
135 5
19.8 0.7
21 4
3.1 0.6
30 683
4.4 100.0
*Table includes data available through 1998-1999
8
2.3.1. Manganese Minerals Major ores of manganese are generally with manganese contents above 35%. Today in nature more than 300 kinds of minerals are known. Most of these are in the form of oxides, carbonates and silicates. Oxides are pyrolusite, psilomane, manganite and hausmannite. Manganese carbonate mineral is rhodochrosite. Rhodenite is manganese silicate. Alabandite is a sulphide mineral of manganese which rarely exists with oxide manganese minerals. In Table 2.5, the chemical compositions and physical properties of most common manganese minerals can be found. Pyrolusite (MnO2); contains 60-63% manganese and sometimes contains various amounts of chemically bound water. It is a black opaque material, which forms large deposits associated with other manganese-bearing minerals; it corresponds to anhydrous manganese dioxide among manganese-bearing ores. Pyrolusite is extensively used for the manufacture of spiegeleisen (20% manganese iron-alloy), of ferro-manganese and of various alloys such as manganese-bronze. Psilomelane (4MnO2.(Mn,Ba,K)O.nH2O); is also known as black hematite and consists of hydrous manganese oxide with variable amounts of barium and potassium. Generalized formula may be represented as Ba(Mn2+)(Mn4+)8O16(OH)4 or as (Ba,H2O)2Mn5O10. It is sometimes considered to be a hydrous manganese manganate, but of doubtful composition. The amount of manganese present corresponds to 70-80% of manganous oxide with 10-15% of available oxygen. The mineral is amorphous and occurs as botryoidal and stalactitic masses with a smooth shining surface and submetallic lustre. It contains different amounts of chemical water. It is a hard, black and amorphous mineral. Manganite (Mn2O3(H2O)); contains 62.4% Mn and 10.3% water. It is steel grey in color and has metallic brightness.
9
Hausmannite (Mn3O4); contains 72.1% Mn. It is a brownish black opaque mineral. Rhodochrosite (MnCO3); it is the most famous carbonate mineral of manganese. Its pure crystal contains 47.8% Mn. Its color is pink and has glassy brightness. It is usually found together with rhodonite. Rhodochrosite forms a complete solid solution series with iron carbonate (siderite). Calcium, (as well as magnesium and zinc, to a limited extent) frequently substitutes for manganese in the structure, leading to lighter shades of red and pink, depending on the degree of substitution. It is for this reason that the most common color encountered is pink. Braunite (Mn2O3); which contains about 69% Mn and up to 10% SiO2, corresponds by its composition to anhydrous manganese sesquioxide. Bixbyite (Mn2O3.Fe2O3); contains 30-40% Mn. The iron: manganese ratio is quite variable and many specimens have almost no iron. It is a metallic dark black rare mineral sought after by collectors. Jacopsite (MnO.Fe2O3); is a manganese iron oxide mineral. It is a magnetite and spinel. It contains 24% Mn. Rhodonite ((Mn,Fe,Ca)SiO3); is a member of the pyroxene group of minerals which contains 42% Mn. Rhodonite crystals often have a thick tabular habit, but are rare. It has a perfect, prismatic cleavage, almost at right angles. There are also some other minerals of manganese such as Kryptomelane (K2xMn8O16) which contains 45-60% Mn and Wad which is a hydrous mixture of manganese oxides and iron oxides of variable manganese content.
10
Table 2.5 Chemical Composition and Physical Properties of Manganese Minerals [3, 8] Minerals
% Mn
Hausmannite Braunite Alabandite Pyrolusite Manganite Psilomelane Rhodochrosite Rhodonite Bementite
72.1 60-69 63.1 60-63 62.4 45-60 47.8 41.9 31
Density (g/cm3) 4.73-4.86 4.75-4.82 3.95 4.73-4.8 4.2-4.4 3.7-4.7 3.45-3.6 3.4-3.68 3.1
Hardness Mohs’ scale 5-5.6 6 3.5-4 2-2.5 4 5-6 3.5-4 5.5-6.5 6
Color
Crystal System Brownish black Tetragonal Brownish black Tetragonal Iron black Cubic Black Cubic Steel Gray Rhombic Iron black Light-dark pink Hexagonal Light pink Triclinic Light gray -
2.3.2. Manganese Ore Beds The main manganese ore beds are sedimentary manganese ore beds and ocean ore beds. Ocean beds: The oxidation potential is low and the valency value of manganese is +2. Since the valency value of iron is +2 as well, manganese is found together with iron in silicate form. Rhodochrosite and rhodonite are the main minerals of manganese that are found in ocean beds. In ocean beds, there are unquantifiable amount of manganese in the form of polymetallic nodules. Nodules contain on average 25% Mn (their main constituent) and lie in thin layers at a depth of approximately 5,000 meters. Recovery will be difficult and very expensive. During the 1970’s and the early 80’s, these nodules were of great interest because of their nickel and copper content (each constituting approximately 1%). These nodules are now seen as potentially valuable resources for the long-term future [7]. Sedimentary Beds: The formation of these beds occurs by the sedimentation of manganese in acidic or neutral water with appropriate levels and transport of these compounds in the form of manganese bicarbonate, humate, chlorate, sulphate, oxides 11
followed by settlement under appropriate pH levels. These types of beds tend to have high reserves, but tend to have a high iron tenor with some impurities. The main manganese minerals that are found in these beds are pyrolusite, psilomane and rhodochrosite. The major sedimentary beds in the world are Chiatura (Georgia) and Nikipol (Russia) and Groote Island (Australia) [9]. Apart from sedimentary and ocean beds: manganese is found in residual metamorphic manganese beds. In residual beds manganese ore is concentrated by the crumbling of certain elements in rocks, and manganese remaining stable. Manganese ore obtained from these beds can be used for metallurgical and chemical purposes in industry [3]. 2.3.3. Manganese in Turkey There are no global quantities of manganese ore beds in Turkey and also the manganese tenor in present beds is low. MTA Institute has conducted several studies about locating manganese ore reserves. Studies have shown that most of the reserves are ferrogeneous manganese ores with a capacity of 4.6 million tons (proved + probable). The main manganese reserves in Turkey are; Denizli-Tavas, HekimhanDeveci which contains mainly manganiferrous iron ore used by integrated steel plants and İstanbul-Çatalca which has a Mn tenor of 31%, with a capacity of 230.000 tons. A new bed at Balıkesir-Mezitler is hoped to be in full operation in the near future. Among these beds Denizli-Tavas region has the largest manganese ore beds with a proven reserve of 4.000.000 tons and production from this bed is roughly 20.000 tons per year. This is a carbonate type ore body with a relatively low content of manganese (30-31% Mn). Ore production from this bed is shown in Table 2.6. There have been many studies conducted by different organizations and institutes to use this considerable ore body in Turkish iron and steel industry. Gravity and magnetic separation, calcination, leaching, solid state carbothermic reduction
12
and smelting of ferromanganese and silicomanganese were some of the studies performed related to the Denizli-Tavas manganese ores [10, 16]. Table 2.6 Production from Denizli-Tavas Manganese Ore Bed [16] Year 1991 1992 1993 1994 1995 1996 1997 1998
Erdemir (Ton) 17837 11870 19935 27103 34499 0 20766 42100
Isdemir (Ton) 0 2780 2562 2142 0 0 0 0
Kardemir (Ton) 0 2309 6325 2788 0 0 0 0
Total Production (Ton) 17837 16959 28824 32034 34499 0 20766 42100
*Source: TDÇİ Genel Müdürlüğü, Ham Etd. Prj.Dai.Bşk. (1998)
2.4. Ferromanganese Ferromanganese is defined by Schottman as an alloy of iron that contains a sufficient amount of manganese to be useful as an agent for addition into molten metals usually steel [11]. 2.4.1. Types of Ferromanganese There are different standards for ferromanganese classification like DIS, AFNOR NF, JIS, ASTM, GOST and DIN. According to the specification given in the ASTM standards [12], ferromanganese can be designated as three main groups in ten grades as shown in Table 2.7. Another classification is also given for types of ferromanganese as below [13];
13
1. Low-Carbon Ferromanganese: It is used for steels with critical carbon content. In this type, carbon content is ranging from 0.07 to 0.75 %. Low carbon ferromanganese is suitable for use in the production of 18-8 Cr-Ni stainless steels in which a carbon-content well below 0.10 % is required. 2. Medium-Carbon Ferromanganese: This alloy contains 80-85 % Mn, 1.25-1.50 % C and 1.50 % Si (max.). It is commonly used in making low carbon manganese steels. It is also used in the production of Hadfield manganese steel, when large amounts of return scrap are being melted. 3. Low-Fe Ferromanganese: It is used for several purposes in the Ni, Al, and Cu industries where high Mn and low Fe are required and where low-carbon content of pure manganese metal is not necessary. It contains 85-90 % Mn, 2 % Fe, 3 % Si, and 7 % C. 4. MS (Machining Screw) Ferromanganese: It contains 80-85 % Mn, 0.35 % Si, and 1.25-1.50% C. This low-silicon alloy is developed to add during production of free machining screw steels. 5. DQ (Drawing Quality) Ferromanganese: It contains 86 % Mn, 0.45 % C, 0.40 % Si, and 0.17 % P. This is refined manganese product which is used as additive to steels for drawing quality steel sheets where both low-silicon and low-carbon contents are desirable. This alloy is also used as addition agent for stainless and constructional alloy steels. 6. Exothermic Ferromanganese: Several grades of Fe-Mn briquettes are sold, containing constituents that cause an exothermic reaction when added to a steel bath, e.g. barium salts. This special material is used for ladle additions of Mn to prevent chilling of the ladle contents.
14
Table 2.7 ASTM Standards of Ferromanganese [12]
Grade Mn % C max. % Si max. % P max. % S max. % N %
Standard Ferromanganese
Medium Carbon Ferromanganese
Nitrided Medium Carbon Ferro manganese
A
B
C
A
B
C
D
78.0 – 82.0
76.0 – 78.0
74.0 – 76.0
80.0 – 85.0
80.0 – 85.0
80.0 – 85.0
80.0 – 85.0
75.0 – 80.0
7.5
7.5
7.5
1.5
1.5
1.5
1.5
1.5
1.2
1.2
1.2
1.5
1.0
0.70
0.35
1.5
0.35
0.35
0.35
0.30
0.30
0.30
0.30
0.05 0 -
0.05 0 -
0.05 0 -
0.02 0 -
0.02 0 -
0.02 0 -
0.02 0 -
Low Carbon Ferro manganese A B 85.0 – 90.0 0.75 0.5 0.1 2.0
80.0 – 85.0 0.75
0.30
0.20
0.30
0.020
0.02 0 -
0.02 0 -
4 % min.
5.0 – 7.0
2.4.2. Production of Ferromanganese Most of the manganese ore in the world is used by steel industry mainly as high carbon ferromanganese. The countries such as China, Australia, South Africa, and Russia are not only major manganese ore owners but also the main producers of ferromanganese. There are other ferromanganese producing countries which do not possess rich manganese ore beds but have well-established steel industries like U.S.A., Japan, and Germany or have low energy costs like France, Norway and Italy. Ferromanganese world production by countries is given in Table 2.8. Since there is no ferromanganese plant in Turkey today, all ferromanganese supply for the Turkish steel industry depends on importation. Quantities of ferromanganese consumption of steel industry in Turkey are given in Table 2.9.
15
Table 2.8 Ferromanganese World Production by Country [15]
* Table includes data available through July 22, 2005. 16
Table 2.9 Ferromanganese Consumption in Turkish Steel Industry [16] TOTAL
Kardemir
İsdemir
Erdemir
1992
4139
7935
9523
21597
1993
5460
5810
9021
20291
1994
4053
6127
7592
17772
1995
3701
3516
7480
14697
1996
2507
6783
12803
22093
1997
1498
7025
12250
20773
1998
1240
6541
12596
20377
1999
1244
7679
11934
20857
23842
51416
83199
158457
TOTAL (Ton)
(Ton)
Today there are two main methods in the production of ferromanganese; Blast Furnace Production This method is very similar to pig iron production in blast furnace but there are several differences between them. Structurally only difference is the shaft height is lower in the ferromanganese blast furnace. The main difference in process is that the iron oxides are reduced in the shaft of the furnace whereas manganous oxides are reduced in the bosh and hearth regions at higher temperatures. This means that ferromanganese production in blast furnace needs more fuel consumption than pig iron production [17]. In pig iron production most of the iron oxides are reduced by CO in accordance with reactions;
17
3Fe2O3 + CO = 2Fe3O4 + CO2
(1)
Fe3O4 + CO = 3FeO + CO2
(2)
FeO + CO = Fe + CO2
(3)
In ferromanganese production, Mn3O4 and MnO are reduced with the participation of solid C by reactions; Mn3O4 + 4C = 3Mn + 4C
(4)
MnO + C = Mn + CO
(5)
Thus as indicated above more coke is required in ferromanganese production and the CO2 content of the blast furnace gas is reduced [18]. In ferromanganese blast furnaces small slag volume, basic slag and high blast temperature is needed for high manganese recovery. Limestone or dolomite is added to combine with silica and free the manganous oxides for reduction [13]. Also if an oxygen enriched blast is used in process, production characteristics of ferromanganese can be significantly improved. When a blast including O2 up to 30-35% is used coke consumption per ton of manganese is reduced from 1.9-2.1 tons to 1.4-1.6 tons. Thus furnace productivity will rise. Spiegeleisen (15-30% Mn, 0.45-0.50% C and max 1% Si, rest Fe) which is a special type of ferromanganese can be produced in blast furnaces. For this production low Mn-losses modified Fe-Mn methods, low SiO2 charges, slow blowing and regulation of slag basicity should be ensured.
Electric Furnace Production Two processes are employed in production of ferromanganese in electric furnace; high manganese slag process and low manganese slag process.
18
In high manganese slag process the charge is smelted with little or no flux. The slag produced generally contains approximately 25% Mn and this is used as the main raw material for the production of silico-ferromanganese. In low manganese slag process the charge containing the ore is smelted with the fluxes. In this process slags contain 8 to 12% manganese and are discarded. Manganese recovery in this process is lower than the rich slag process due to loss of a considerable amount of manganese. Smelting of the charge is continued with the addition of carbon in the form of coal, coke or wood chips. Also in low manganese slag process, furnaces should be closed in order to prevent atmospheric pollution with high electrical and metallurgical efficiencies. For this aim and to utilize the reduction gas for plant heating, an efficient gas cleaning system is necessary to remove fume and dust from the furnace gases. If overheating is not prevented, significant amounts of volatilization losses can take place due to high vapor pressure. To avoid abnormally high concentration of heat in the smelting zones, electrodes with large diameters are necessary because current densities of the electrodes should be low compared with other ferroalloy furnaces [13]. MnO2 dissociates into manganese oxide above 400 °C while charge descends inside the furnace. Liberated oxygen combines with C to form CO [11]. 2C + O2 = 2CO
(6)
Hence the overall reaction can be stated as MnO2 + C = MnO + CO
(7)
Further reduction of the manganous oxide in electric furnace takes place at temperatures above 1400 °C and at the hearth zone of the furnace which is between 1600 and 1800 °C. Thus reduction gives metallic manganese and manganese carbide as products.
19
MnO + C = Mn + CO
(5)
6MnO + 8C = 2Mn3C + 6CO
(8)
Also with favorable furnace conditions it is possible for higher manganous oxides to be reduced to their lower oxides with CO. 2MnO2 +CO =Mn2O3 + CO2
(9)
3Mn2O3 + CO = 2Mn3O4 + CO2
(10)
Mn3O4+ CO = 3MnO + CO2
(11)
Where the overall exothermic reaction can be stated as; MnO2 + CO = MnO + CO2
(12)
However, this reaction does not take place appreciably in ferromanganese production.
2.5. Thermodynamics of Reduction of Manganese Oxides 2.5.1. Reduction of Higher Manganese Oxides Mn2O3, Mn3O4, MnO2 and MnO are known oxide forms of manganese in nature. MnO2 is transform into lower oxide phases under suitable condition of temperatures and oxygen partial pressures by below equations,
2MnO2 = Mn2O3 + 1/2O2
(13)
1
3Mn2O3 = 2Mn3O4 + /2O2
(14)
Mn3O4 = 3MnO + 1/2O2
(15)
20
Since the oxide phases transform from one into another due to the temperature and partial pressure of oxygen the Mn-O system has a resemblance to Fe-O system. Hahn and Muan [19] have studied the Mn2O3 → Mn3O4 → MnO system widely. According to their research the reaction (14) occurs between 845 °C to 1029 °C and the reaction (15) occurs between 1248 °C and 1562 °C. Other researchers studied on this system such as Coughlin [20], Dressel and Kenworthy [21] found different dissociation temperatures for the oxides since it depends on the oxygen partial pressure of the system. All these studies show that it is difficult to achieve stability in the Mn-O system. According to all these researches [20-23] the gaseous reduction of higher manganese oxides starts with the dissociation of MnO2 into manganic oxide above 400 °C and continues with the reduction of the oxides Mn2O3 and Mn3O4 in the MnC-O system with the support of reducing agents such as carbon and carbon monoxide with respect to the reactions below;
3 Mn2O3 + C = 2Mn3O4 + CO
(16)
∆G°, kJ/mol = -0.25 – 0.17T
(25-1100 °C)
3 Mn2O3 + CO = 2Mn3O4 + CO2
(17)
∆G°, kJ/mol = -170.71 – 0.004T
(25-1100 °C)
Mn3O4 + C = 3MnO + CO
(18)
∆G°, kJ/mol = 110.96 – 0.21T
(25-1244 °C)
∆G°, kJ/mol = 84.35 – 0.20T
(1244-1700 °C)
Mn3O4 + CO = 3MnO + CO2
(19)
°
∆G , kJ/mol = 110.96 – 0.21T
(25-1244 °C)
∆G°, kJ/mol = 84.35 – 0.20T
(1244-1700 °C)
21
Standard free energy changes for these reactions are given in Figure 2.1. It can be deduced from this figure that Mn2O3 and Mn3O4 can be reduced by carbon above 700 °C. Hahn and Muan also have constructed the equilibrium data between Mn3O4 and Mn2O3 at 1 atm pressure in air and in an atmosphere of intermediate O2 partial pressure which is given in Figure 2.2. Another curve corresponding to this one which has been plotted for the equilibrium between Mn3O4 and MnO is given in Figure 2.3.
Figure 2.1 Free Energy Change as a Function of Temperature for Reduction Reactions of Mn2O3 and Mn3O4 [1-) 3Mn2O3 + 3C = 2Mn2O3 + 3CO, 2-) 3Mn2O3 + CO = 2Mn3O4 + CO2, 3-) Mn3O4 + C = 3MnO + CO, 4-) Mn3O4 + CO = 3MnO + CO2] [24]
22
Figure 2.2 Stability Relations of the phases Mn2O3 and Mn3O4 as a function of O2 pressure and temperature [19]. (Dashed curve data is taken from Coughlin [20])
Figure 2.3 Stability Relations of the phases Mn3O4 and MnO as a function of O2 pressure and temperature [19]. (Dashed curve data is taken from Coughlin [20])
23
Assuming that there is an analogy between the activities of MnO and Mn3O4, the equilibrium constant, K, for reaction (19) could be shown as PCO2/ PCO and calculated values of K for this equation are 3.87x10¹² at 25 °C and 1.40x10⁴ at 1244 °C. The calculated equilibrium values of PCO/ PCO2 for same equation between 11001350 °C are in the order of 10-5 and this variation means that reduction of Mn3O4 by CO is possible in an atmosphere that contain very low concentrations of CO. The possibility of the reduction of MnO2 to MnO at a temperature below 500 °C in a CO atmosphere is proved by Pentz [25] but the product is unstable after cooling and can reoxidize when exposed to air. Pentz and Yagihashi [26] et al have shown that in order to reduce MnO2 to stable MnO when cooled, the reducing temperature has to be above 700 °C. 2.5.2. Reduction of Manganous Oxide MnO is a stable oxide. After the reduction of high manganese oxides to MnO, very high pressures of CO is required to continue the reduction reactions with CO. The reduction of MnO can be presented with the below given reactions; MnO + CO = Mn + CO2
(20)
∆G°, kJ/mol = 102.29 – 0.01T
(25-1227 °C)
∆G°, kJ/mol = 116.73 – 0.01T
(1227-1777 °C)
CO2 + C = 2CO
(21)
In Figure 2.4, variations of the equilibrium constants of reactions (20) and (21) with temperature are given. A change in the slope of line 1 at approximately around 1200-1300 °C is due to a phase change of manganese. It can be deduced from this figure that at temperatures above roughly 1420 °C and at PCO/ PCO2 ratios greater than 6600 (by assuming that the activities of Mn and MnO of the reaction (20) are equals to unity), MnO can be reduced by CO in the presence of carbon. However, even small amounts of CO2 may inhibit the reaction.
24
Several researchers such as Bouchard and Fruchart [27], Benz, Elliot and Chipman [28] and Tanaka [29] have studied the thermodynamics and phase equilibria of manganese carbides and indicated that the possible manganese carbides are Mn23C6, Mn15C4, Mn3C, Mn5C2, and Mn7C3. The binary Mn-C phase diagram is given in Figure 2.5. According to Grimsley et al [29] the reduction of MnO by CO is thermodynamically impossible in the range of 25 °C to 2000 °C. Nevertheless, reduction takes place preferentially by solid carbon or iron carbides with respect to below equations;
Figure 2.4 Plots of log (PCO/ PCO2) against temperature for equations (20) and (21) (Line 1: CO2 + C = 2CO, Line 2: MnO + CO = Mn + CO2) (For the Line 2, the total pressure PCO + PCO2 = 1 atm.) [24]
25
Figure 2.5 Binary Mn-C Phase Diagram [35]
MnO + 10/7C = 1/7Mn7C3 + CO
(22)
∆G°, kJ/mol = 284.22 – 0.18T
(717-1087 °C)
∆G°, kJ/mol = 282.01 – 0.18T
(1087-1137 °C)
∆G°, kJ/mol = 280.22 – 0.18T
(1137-1244 °C)
∆G°, kJ/mol = 280.35 – 0.18T
(1244-1700 °C)
MnO + 10/7Fe3C = 1/7Mn7C3 + 30/7Fe + CO
(23)
∆G°, kJ/mol = 246.09 – 0.15T
(717-840 °C)
∆G°, kJ/mol = 269.42 – 0.17T
(840-1087 °C)
∆G°, kJ/mol = 267.21 – 0.17T
(1087-1137 °C) 26
The standard free energy changes for reduction of MnO with carbon or Fe3C are almost identical in the temperature range 800 °C to 1300 °C and most likely product is Mn7C3.
Figure 2.6 Free Energy Changes for the Reduction of MnO with C or Fe3C as a Function of Temperature [1-) MnO + 10/7C = 1/7Mn7C3 + CO, 2-) MnO + 10/7Fe3C = 1/7Mn7C3 + 30/7Fe + CO, 3-) MnO + 4/3Fe3C = 1/3Mn3C + 4Fe + CO, 4-) MnO + C = Mn + CO, 5-) MnO + Fe3C = Mn + Fe + CO]
The Pourbaix diagram which has been constructed by Downing [30] for the Mn-O-C system is given in Figure 2.7. It shows the stability regions of manganese oxides at specified temperatures and oxygen partial pressures. The gaseous phase is composed of CO, CO2 and manganese vapour, and the total pressure at any point on this figure is the sum of the partial pressures of the above gas constituents. Lines of constant total pressure are given in the figure for values of 1, 10-2, 10-4, 10-6 atm.
27
It can be seen from the diagram that in the presence of carbon the higher oxides of manganese, Mn2O3 and Mn3O4, are unstable at all temperatures and for all total pressure and they are reduced to MnO. The reduction sequence of MnO by carbon at 1 atm. total pressure is shown by the curve AB. The reduction of MnO starts at about 1267 °C to form Mn7C3 and this reacts with excess MnO to form liquid manganese metal at about 1727 °C.
Figure 2.7 Oxygen Potential Temperature Diagram for The Mn-O-C system [30]
28
2.6. Previous Studies on Denizli-Tavas Manganese Ores Emeksiz [32] studied the production of high carbon ferromanganese from Denizli-Tavas manganese ore. In his study a high-grade manganese ore (41%) was first calcined and then smelted with coke, lime, scrap iron and fluorspar in graphite crucibles at 1600 °C. Investigated smelting experimental parameters were time, lime addition, fluorspar addition and coke/ore weight ratio. Two hours duration time and coke/ore weight ratio, lesser than 0.2, were found to be the optimum. The experimental results showed that Denizli-Tavas manganese ore may be used in the production of high carbon ferromanganese. İmer [14] also studied the same process from the same ore with a lower Mn grade (31%Mn) and produced a ferromanganese product which had a manganese content very close to the standard ferromanganese defined by ASTM [12]. The smelting of silicomanganese from Denizli-Tavas manganese ore was investigated by Keskinkılıç [31] in his thesis study. Mixtures of Denizli-Tavas calcined manganese ore; active carbon, calcium oxide and quartz were smelted in graphite crucibles with an electronically controlled muffle furnace. Experiments were done at 1600, 1650, 1700 °C and for 1, 1.5 and 3 hours. It was indicated in this work that as the temperature of the system was increased, the reduction extents of both MnO and SiO2 were found to increase and 1.5 hour smelting time and 1700 °C was determined to be the optimum conditions for production. Also the highest recoveries were obtained when the charge basicity was 0.58 and active carbon/ore wt. ratio value was 0.219. Kalfaoğlu [10] investigated the solid state reduction behavior of DenizliTavas manganese ore to produce ferromanganese, by using pure carbon as graphite. Weight loss data was collected with respect to time as the reactions took place in the furnace. Experiments were done at 1100, 1150, 1200, 1250, 1300 °C and constant amount of carbon and calcined manganese ore were used for each experiment. Reactions were allowed to take place in an argon atmosphere inside the furnace, in order to prevent oxidation. From experimental results it was seen that approximately
29
60% reduction of the manganese ore took place at and below 1200 °C. At and above 1250 °C it was observed that this reduction efficiency increased to approximately 90% and it can be deduced from his study that it is possible to produce Fe-Mn alloy from the Denizli-Tavas manganese ore by solid state reduction with carbon. It can be seen from these studies that this ore could be used in the production of ferromanganese but since it has medium manganese content, some pre-treatment methods should be applied.
30
CHAPTER 3
EXPERIMENTAL
3.1. Materials used in Experiments The main materials used in the experiments were Denizli-Tavas manganese ore, active carbon and CaO. These were obtained from different sources and prepared carefully for the experiments as explained below. 3.1.1. Denizli-Tavas Manganese Ore 3.1.1.1. Preparation of Ore Manganese ore was obtained from Ereğli Iron and Steel Works of Turkey, which owned the mining rights of Denizli-Tavas region manganese ores in the form of pebbles and big pieces. The big pieces were put into a jaw crusher to be reduced to - 8 mm size. The output of the jaw crusher was put into the roll crusher and product was received at -2 mm size. The product size was then reduced to -1 mm by using a disc grinder and the experiments were conducted with this size. Afterwards, the products were separated out and put together like the form of a cone. The heap of ground ore was split into four quarters by means of coning and quartering. The heaps in the opposite quarters were mixed together. This process was repeated several times in order to achieve a good distribution. Screen analysis of this ore is given in Table 3.1. 31
Table 3.1 Screen Analysis of the Denizli-Tavas Manganese Ore
Size Range (µm)
Weight % Oversize
+630
1.22
-630 +315
15.15
-315 +147
52.52
-147 +74
10.47
-74 +38
15.4
-38
5.24
3.1.1.2 Mineralogy of the Ore Mineralogical analysis of the ore was done and given in the studies of Keçeli [33] and Yılmaz [34]. According to those analyses it was seen that: 1. Rhodochrosite (MnCO3) was found to be the most abundant ore mineral in the ore either free or locked in calcite. Its percentage was between 20-25%. 2. The second ore mineral was manganite (Mn2O3.xH2O) which has a dark grey color. This mineral was also encountered as fine, light grey-white-colored and amorphous manganese hydroxide, disseminated extensively in gangue minerals. Its percentage was in the range 15-20 wt. %. 3. The other important ore mineral was light grey-colored psilomelane (nearly MnO2 but there might be some K, Ba, Pb, Fe, Cu, and Zn in its structure). It appeared to be in carbonated or siliceous gangue, together with pyrolusite. It was about 10-15 wt. % of the ore.
32
4. Pyrolusite (MnO2) which has a white color was also present in ore together with Psilomelane. It also showed a colloform aggregate, with these two minerals forming kidney shaped concentric layers. Its percentage was in the range 5-6 wt. %. 5. There were also some ore minerals as bixbyite ((Mn,Fe)2O3), hausmannite (Mn3O4) and braunite (3(Mn,Fe)2O3.MnSiO3). The total of these was about 3 wt. %. 6. Furthermore, there were jacobsite ((Mn,Fe)3O4), hematite (Fe2O3), lepidochrosite (FeO(OH)), goethite (HFeO2), limonite (FeO(OH).nH2O), pyrite (FeS2), rutile (TiO2) and marcasite (FeS2) in small amounts. 3.1.1.3 Calcination of the Ore 250 grams of Denizli-Tavas manganese ore was calcined at 1000 °C for 2 hours in a muffle furnace. The aim of calcination of this ore was to increase its manganese content. The sample was mixed by a rake 3 times in 1 hour calcination time to have uniform oxidation. The sample weight was 210 gr. after calcination and corresponding mass loss was determined as %16. The chemical composition of both uncalcined and calcined ore samples are given in Table 3.2. Table 3.2 Chemical Composition of Uncalcined and Calcined Denizli-Tavas Manganese Ore Elements
Uncalcined (wt. %)
Calcined (wt. %)
Mn
31.06
39.69
Fe
4.26
5.45
SiO2
13.54
17.30
CaO
7.45
13.41
MgO
0.86
1.10
Al2O3
2.46
3.14
33
X-Ray diffraction analysis of the calcined manganese ore was conducted at the Department of Metallurgical and Materials Engineering. Results can be seen in Figure 3.1.
Figure 3.1 X-Ray Diffraction Analysis of Calcined Ore (■ Mn2O3,
SiO2,
□ (Mn,Fe)2SiO4)
3.1.2. Active Carbon Chemically pure active carbon was used in the experiments in very fine powder form as a reducing agent. 3.1.3. Calcium Oxide Commercially available CaO in powder form with a 99.9% grade was used in all of the experiments of this study.
34
3.1.4. Crucibles Recrystallised alumina crucibles of Haldenwanger make, which were 3 cm in height and 1.5 cm in diameter, were used in order to put the mixture of active carbon and manganese ore into the furnace.
3.2. Experimental Setup & Procedure Experiments were performed in a tube furnace, made in England by the company Lenton, which was designed to work at temperatures up to 1800 °C with the working tube made of 99.80% recrystallised alumina. The furnace was heated with six MoSi2 heating elements. Two H2SO4 filled glass gas bubblers were placed in the path of argon gas flow, one before entrance and the other at the exit of furnace tube. These glass bubblers were used to ensure that the gas was flowing and to establish that the furnace was gas tight. A flowmeter was placed just after the first bubbler and before gas entrance to furnace tube. A glass tube filled with CuSO4 was also placed before the first bubbler and after the argon tube to absorb the water. A schematic view of the experimental setup is given in Figure 3.2.
35
36
3.2.1. Calibrations Calibration of furnace temperatures was done at controller set temperatures of 1400 ºC, 1500 ºC and 1600 ºC by using a Pt / Pt 10 % Rh thermocouple inserted into the furnace tube and taking measurements at 28 points in the hot zone of the furnace. The graphs of these temperature measurements versus length of central hot
Degree (°C)
zone of furnace, in cm, are given in Figure 3.3.
1600 1550 1500 1450 1400 1350 1300 1250 1200 1150 1100 0
5
10
15
20
25
30
Distance (cm) Set Temps:
1400 °C
1500 °C
1600 °C
Figure 3.3 Temperature Profile of the Tube Furnace According to these calibration tests; the interval between 15th and 18th centimeter from the left end of the furnace where the highest actual temperatures were obtained, was chosen and the crucibles were placed in this interval in all of the experiments. Also using the results of above measurements, the calibration line of set temperatures versus actual average temperatures in the hot zone, shown in Figure 3.4, was drawn.
37
T (Set) °C
1650 1600 1550 1500 1450 1400 1350 1300 1250 1200 1150 1100 1250
1300
1350
1400
1450
1500
1550
1600
T (actual) °C
Figure 3.4 Calibration Line of Set Temperature versus Actual Temperature The next calibration was done for the rotameter type flowmeter which was originally calibrated for air. So, it was recalibrated for argon. Soap film technique in which time taken to cover a certain volume is measured (cc/sec or ml/sec), was utilized and after taking several measurements the graph given in Figure 3.5 was
Actual Flowrate (cc/min)
drawn.
70 60 50 40 30 20 10 0 0
10
20
30
40
Flowmeter Scale (cc/min)
Figure 3.5 Calibration Chart for Flowmeter
38
50
60
3.2.2. Experimental Procedure Firstly, the stoichiometric carbon requirement calculations were made according to reactions (24) and (25) given below; 7Mn2O3 + 27C = 2Mn7C3 + 21CO
(24)
3Fe2O3 + 11C = 2Fe3C + 9CO
(25)
Total weight of calcined ore and carbon was arranged to 50 grams. These calculations which were given in Appendix A showed that the charge must consist of 43.27 grams of ore and 6.73 grams of active carbon. Calcium oxide was added as flux and binder in amount of 5% of the ore. This mixture was used as it is in temperature and duration optimization experiments. But calcium oxide and active carbon amounts were changed in other experiments in order to determine the optimum conditions. All the charge was mixed with the addition of alcohol was ground in a ceramic mortar and after all the alcohol, was vaporized off was put into the alumina crucibles. Experiments were conducted by placing three alumina crucibles into the predetermined hot zone inside the tube furnace. Different temperatures, durations, active carbon amounts and calcium oxide percentages were tested in order to find the optimum conditions for carbothermic reduction of Denizli-Tavas manganese ore. At the end of a run, the furnace was turned off and crucibles were allowed to cool to room temperature in the furnace. Three crucibles were then weighed and weight loss determined. Using the weight loss data, % reduction values were calculated. Then, charge materials in the crucibles were combined together and representative samples were taken from each batch for X-Ray, SEM-EDS and chemical analysis. The optimum conditions were decided considering chemical weight loss, SEM-EDS and X-Ray analyses. Experiments were done using the combinations of the parameters given in Table 3.3.
39
For each experimental variable, an experiment was chosen as sample and leached with H2SO4 on a hot plate under conditions of 1.5 M sulphuric acid concentration, 60 °C, 30 minutes duration and 1/10 solid to liquid ratio. The aim of leaching was to eliminate MnO phases in the sample and to see the extent of carbide formation more clearly. XRD graphs of these leaching experiments are given in Results and Discussion section. Leaching conditions were taken from the study of Yılmaz [34]. Table 3.3 Experimental Variables
Variable
Test Range
Temperature (°C)
1150 – 1200 – 1250
Duration (h)
2–4–5–6
Carbon, % of Stoichiometric C
100 - 150 – 200
CaO, % (of calcined ore)
2.5 - 5 - 7.5 - 10
A flowsheet of the experimental procedure is given in Figure 3.6.
40
Denizli-Tavas Manganese Ore
Calcination (2 hour, 1000 °C, in a muffle furnace)
SEM Analysis
X-Ray Analysis
Preparation of the Mixture
Active Carbon
CaO
Placement of mixture into the alumina crucibles
Carbothermic reduction in a horizontal tube furnace
Weighing of the product and calculation of %Reduction
SEM Analysis
Calculation of Composition and Carbides
X-Ray Analysis
Leaching of the oxides with H2SO4
X-Ray Analysis (Solid Residue)
Figure 3.6 Flowchart of the Experimental Procedure
41
CHAPTER 4
RESULTS AND DISCUSSION
4.1. Experimental Results In this thesis work, as mentioned before the effects of temperature, duration, amounts of active carbon and CaO additions on the reduction of oxides and carbide formation was studied. Experiments were conducted at 1150 °C, 1200 °C and 1250 °C for periods of 2, 4 and 6 hours with addition of 2.5%, 5%, 7.5%, and 10% CaO and 100%, 150%, 200% of the stoichiometric amount of active carbon under argon atmosphere. Reduction percentage, defined as the weight loss of ore during the reduction with carbon, after a certain period of time at a given temperature, was expressed as the percentage of the total weight loss for complete reduction of the ore. The weight loss was converted to percentage reduction, R% using the formula; Mass of Oxygen Removed R% = ———————————— Mass of Removable Oxygen
x 100
(Eq.1)
Mass of oxygen removed was calculated from mass of CO removed which was assumed to be equal to weight loss and mass of removable oxygen was taken as the oxygen present in the reducible oxides in the system. Fe oxides and Mn oxides were considered to be the reducible oxides and all other oxides were classified as nonreducible in the calculation of R%. Reduction percentage values of all the experiments can be seen in Table 4.1. 42
Table 4.1 Results of the Experiments Exp.
Temperature (°C)
Duration (h)
CaO (%)
Stoich. Carbon (%)
Reduction (%)
1
1150
2
5
100
47.10
2
1200
2
5
100
56.42
3
1250
2
5
100
70.31
4
1250
4
5
100
83.85
5
1250
5
5
100
85.75
6
1250
6
5
100
87.72
7
1250
4
5
150
68.54
8
1250
4
5
200
70.88
9
1250
4
2.5
100
64.78
10
1250
4
7.5
100
65.37
11
1250
4
10
100
69.61
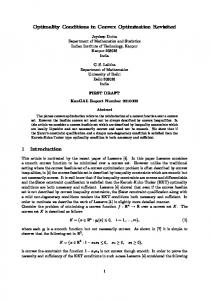
4.2. Effect of Temperature The reduction process was done while changing the temperature at constant time, 100% of the stoichiometric amount of carbon and CaO addition which is 5% of the ore under argon atmosphere. Temperatures studied were 1150 °C, 1200 °C, and 1250 °C. Duration in these experiments was kept constant at 2 hours. Percentage reduction values calculated with respect to the temperatures in these tests are 47.1, 56.42, and 70.31, respectively. It can be seen from these results that % reduction increases with increasing temperature. Results of these 3 experiments are given in Figure 4.1.
43
80 70 %Reduction
60 50 40 30 20 10 0 1100
1150
1200
1250
1300
Temperature °C
Figure 4.1 % Reduction versus Temperature Graph (100% stoichiometric amount of carbon, 5% CaO addition, 2 hours) The reason for relatively low reduction can be explained by the fact that certain reduction reactions or mechanisms do not occur below a certain temperature. Also the results indicate that complete reduction was not obtained in the experiments in 2 hours and maximum reduction percentage that was obtained was 70.31% at 1250 °C. Since earlier trials in this work showed that temperatures above 1250 °C caused partial melting in the mixture and sticking into the walls of alumina crucibles higher temperatures were not used and 1250 °C was taken as the optimum. The composition of products obtained from experiments to determine the effect of temperature is given in Table 4.2; these are obtained by SEM-EDS analyses. Table 4.2 Composition of the Products in Temperature Experiments Composition of the Product (wt. %) %Reduction
Temp.(°C)
Mn
Fe
Ca
Al
Si
Mg
K
C and O
1150
38.48
11.97
9.78
2.14
9.7
0.7
0.97
26.27
23.83
1200
42.84
9.68
8.36
2.74
9.06
0.78
1.09
25.45
22.33
1250
46.62
9.22
6.79
2.92
8.23
1.51
0.87
23.83
23.48
44
Table 4.3 gives the amount of carbides in temperature-effect experiments, as calculated from SEM-EDS analyses. Table 4.3 Amount of Carbides in Temperature Experiments Temp. (°C)
Mn7C3 (wt. %)
Fe3C (wt. %)
1150
19.82
13.06
1200
26.43
14.17
1250
35.84
10.06
It can be seen from Table 4.2 and Table 4.3 that manganese content of product and the amount of Mn7C3 is increasing with increase in temperature. As an example, the experiment which was conducted at 1200 °C was chosen for leaching of manganese oxides. XRD diagrams of the product before leaching and after leaching are given in Figure 4.2 for comparison. All MnO phases were removed but CaSO4 phases were also observed after leaching. However, the peaks of Mn7C3 and Fe3C can be seen more clearly after leaching.
CaSO4
Mn7C3
Ca2SiO4
Fe3C
MnO
Figure 4.2 XRD Diagram of the product before leach and after leach (1200 °C, 100% stoichiometric amount of carbon, 5% CaO addition, 2 hours) 45
4.3. Effect of Duration In order to determine the effect of duration, three experiments were conducted at 1250 °C for 4, 5 and 6 hours by using 100% of the stoichiometric amount of active carbon and CaO addition which was 5% of the ore. The variation of reduction % with time is given in Figure 4.3.
%Reduction
100 90 80 70 60 50 40 30 20 10 0 0
1
2
3
4
5
6
7
Duration, hr
Figure 4.3 % Reduction versus Duration Graph (100% stoichiometric amount of carbon, 5% CaO addition, 1250 ºC)
It can be seen from Table 4.1 reduction percentage values calculated increased from about 70% to about 88% as duration of reduction increased from 2 to 6 hours. In the reaction system iron oxides and manganese oxides were all reducible by active carbon. The reduction extent of oxides depended very much on duration. As mentioned in previous studies [14, 32], among these oxides, iron oxide was the least stable one and it was almost fully reduced in a time less than one hour. On the other hand, reduction of MnO was not completed even at the end of three hours but as reduction proceded, reduction extent of manganese oxides increased. Also according to the study of Kalfaoğlu [10], increase in the duration gave better reduction percentage values and results of this study were in accordance with it. 46
The composition of the products in duration experiments is shown in Table 4.4 while amount of carbides are shown in Table 4.5, as determined by SEM-EDS analyses. Table 4.4 Composition of the Products in Duration Experiments Composition of the Product (wt. %) %Reduction
Time (h)
Mn
Fe
Ca
Al
Si
Mg
K
C and O
2
46.62
9.22
6.79
2.92
8.23
1.51
0.87
23.83
70.31
4
52.98
5.62
7.10
2.10
8.60
0.82
0.44
22.33
83.85
5
47.17
7.62
7.88
2.66
9.07
1.59
0.54
23.48
85.75
6
50.66
6.31
6.37
2.50
9.58
1.18
0.31
23.10
87.72
Table 4.5 Amount of Carbides in Duration Experiments Time (h)
Mn7C3 (wt. %)
Fe3C (wt. %)
2
35.84
10.06
4
48.58
6.13
5
44.23
8.68
6
48.59
6.31
According to these results, reduction percentages, manganese contents and Mn7C3 amounts of these three experiments were close to each other. Four hour reduction time was found to be advantageous and chosen as the optimum time for the experiments. The experiment done for 4 hours was chosen for leaching of Mn-oxides. XRD diagrams of the product before leaching and after leaching are given in Figure 4.4 for comparison. All MnO phases were removed but CaSO4 phases were observed after leaching as before. Also the peaks of Mn7C3 and Fe3C can be seen more clearly after leaching. 47
CaSO4
Mn7C3
Ca2SiO4
Fe3C
MnO
Figure 4.4 XRD Diagram of the product before leach and after leach (1250 °C, 100% stoichiometric amount of carbon, 5% CaO addition, 4 hours)
4.4. Effect of Amount of Active Carbon Experiments were also done with 150% and 200% of the stoichiometric amount of carbon calculated for reactions (24) and (25) in order to determine its effect on % reduction while keeping the temperature at 1250 °C for 4 hours; the experiment with 100% of the stoichiometric amount of carbon was already done. As shown in Figure 4.5 reduction percentage decreases from 83.85 to 68.54 when amount of carbon increases from 100% to 150% and then slightly increases to 70.88 when the amount increases to 200%. So it was clear that it was not necessary to use excess carbon.
48
100
%Reduction
80 60 40 20 0 0
50
100
150
200
250
%St. Carbon
Figure 4.5 % Reduction versus Stoichiometric Amount of Carbon Graph (5% CaO addition, 1250 ºC, 4 hours) Emeksiz [32] stated in his work that excess coke used in a smelting experiment for which coke/ore weight ratio was 0.3 was observed at the end of experiment to form a layer above the slag. This coke layer was also found to contain significant quantities of metal and slag beads, which have not been able to settle down into the slag and metal phases lying below. This resulted in a decrease in the weight of the metal formed causing a decrease in the manganese recovery. With respect to this situation when excess of stoichiometric amount of active carbon was used in reduction of Denizli-Tavas manganese ore, a carbon layer might have formed inside the product which decreased the reduction percentage. The composition of the products for the active carbon experiments is shown in Table 4.6, and amount of carbides in these products in Table 4.7.
49
Table 4.6 Composition of the Products in Amount of Active Carbon Experiments
Composition of the Product (wt. %) %Reduction
Stc.C (%)
Mn
Fe
Ca
Al
Si
Mg
K
C and O
100
52.98
5.62
7.10
2.10
8.60
0.82
0.44
22.33
83.85
150
42.99
6.02
9.03
2.60
10.54
1.42
1.04
26.36
68.54
200
42.11
7.59
8.68
3.05
10.11
1.30
1.30
25.90
70.88
Table 4.7 Amount of Carbides in Amount of Active Carbon Experiments Stc. C (%)
Mn7C3 (wt. %)
Fe3C (wt. %)
100
48.58
6.13
150
32.22
6.56
200
32.64
8.28
It can be seen from the results that Mn7C3 amount obtained in excess stoichiometric amounts of active carbon was lower than the amount which was obtained at 100% stoichiometric amount of carbon similar to reduction percentage values as mentioned above. The experiment which was done with 150% of stoichiometric amount of carbon was chosen for leaching of manganese oxides as an example. XRD diagrams of the product before leaching and after leaching are given in Figure 4.6 for comparison. No MnO phases were detected but CaSO4 phases were observed after leaching. Also the peaks of Mn7C3 and Fe3C can be seen more clearly after leaching.
50
CaSO4
Mn7C3
Ca2SiO4
Fe3C
MnO
Figure 4.6 XRD Diagram of the product before leach and after leach (1250 °C, 150% stoichiometric amount of carbon, 5% CaO addition, 4 hours)
4.4. Effect of CaO% Addition To understand the effect of the CaO amount in the charge, three tests were made with 2.5 %, 7.5 % and 10 % CaO addition by using 100% of the stoichiometric amount of active carbon at 1250 °C; the experiment with 5% CaO addition was already done. The results are shown graphically in Figure 4.7. Reduction percentage increased from about 64.8% to about 84% when the amount of CaO addition increased from 2.5% to 5%. However, when CaO addition increased further to 7.5%, reduction percentage decreased to 65.4% but then increased slightly to 69.6% at 10% CaO addition. It can be deduced from the results that the optimum value for CaO addition is 5% and the amounts higher or lower than this give low reduction percentages. The reason for this may be that CaO may help as binder up to 5% in the charge but, it may hinder carbide formation above that value.
51
90 80 %Reduction
70 60 50 40 30 20 10 0 0
2.5
5
7.5
10
12.5
15
%CaO
Figure 4.7 % Reduction versus CaO% Addition Graph (100% stoichiometric amount of carbon, 1250 ºC, 4 hours) In Table 4.8 the composition of the products in CaO% addition experiments, is given; the amounts of carbides from SEM-EDS analyses are given in Table 4.9.
Table 4.8 Composition of the Products in CaO% Addition Experiments
Composition of the Product (wt. %) %Reduction
CaO%
Mn
Fe
Ca
Al
Si
Mg
K
C and O
2.5
45.10
7.47
6.85
2.72
10.14
1.20
0.79
25.73
64.78
5
52.98
5.62
7.10
2.10
8.60
0.82
0.44
22.33
83.85
7.5
50.85
6.76
7.55
2.02
7.95
0.60
0.93
23.34
65.37
10
51.47
6.13
7.49
2.29
7.79
1.22
0.34
23.27
69.61
52
Table 4.9 Amount of Carbides in CaO% Addition Experiments CaO%
Mn7C3 (wt. %)
Fe3C (wt. %)
2.5
31.95
8.15
5
48.58
6.13
7.5
36.35
7.38
10
39.18
6.69
It can be seen from the above results, like reduction percentage values that the highest Mn7C3 amount was detected at 5% CaO addition. The experiment which was done with 10% CaO addition was chosen for leaching of manganese oxides as an example. XRD diagrams of the product before leaching and after leaching are given in Figure 4.8 for comparison. Like the other three variables MnO phases were not detected but CaSO4 phases were observed after leaching. Also the peaks of Mn7C3 and Fe3C can be seen more clearly after leaching.
CaSO4
Mn7C3
Ca2SiO4
Fe3C
MnO
Figure 4.8 XRD Diagram of the product before leach and after leach (1250 °C, 100% stoichiometric amount of carbon, 10% CaO addition, 4 hours)
53
CHAPTER 5
CONCLUSIONS
In this research work the optimization of conditions to produce iron and manganese carbides from Denizli-Tavas manganese ore was studied. The following conclusions were drawn considering the experimental results: 1. To obtain a high reduction percentage, temperature should be as high as possible to a point at which partial melting of the charge starts to occur. Utilizing 1250 ºC as the reduction temperature was found advantageous since it ensures a high reduction percentage, and keeps the charge completely at solid state. 2. From the energy consumption and high reduction percentage points of view four hour reduction time was found advantageous since further increment in duration does not provide a significant change in reduction percentage. 3. In order to have satisfactory reduction percentage, it was not necessary to utilize active carbon in excess of the stoichiometric amount. Amounts higher than 100% of the stoichiometric amount of active carbon decreased the reduction percentage values. 4. Presence of calcium oxide in the charge was found to be beneficial for the reduction and helps as a binder up to 5 wt. %, but it prevented carbide formation and decreased the reduction percentage above that value.
54
Since the manganese content of the ore product increased under the optimum conditions, the product obtained in this study can be used for ferromanganese production and as an additive to ladle for high carbon steelmaking. In order to separate the carbide phases from oxides, especially from SiO2 containing phases, and so increase the Mn-content of the product further, Heavy Media Separation which is a physical concentration technique relying on the differences in densities of carbides and oxides can be suggested as a future work.
55
REFERENCES
1. Elyutin V.P., Pavlov Y.A., Levin B.E. and Alekseev E.M., “Production of Ferroalloys”, Electrometallurgy, Israel Program for Scientific Translations Ltd., pp. 96-157, 1961. 2. Simons E.N., “Guide to Uncommon Metals”, Great Britain, Garden City Press Ltd., pp. 120-108, 1967. 3. Matricardi L.R., and Downing J.H., “Manganese and Manganese Alloys”, Kirk-Othmer, “Encyclopedia of Chemical Technology”, 3rd Edition, Volume 14, pp.824-843, 1981. 4. Akarca Ş.S., “Beneficiation of Denizli-Tavas Region Manganese Ores”, Master of Science Thesis in Metallurgical Engineering Department, Middle East Technical University, Ankara, August 2000. 5. International Manganese Institute, http://www.manganese.org/applications.php, January 2007. 6. “Booklet on Manganese ore and Ferromanganese”, Türkiye Demir-Çelik İşletmeleri Publication, 1992. 7. International Manganese Institute, http://www.manganese.org/reserves.php, January 2007. 8. Kirk-Othmer, “Encyclopedia of Chemical Technology”, 1st Edition, Volume 8, pp. 718-727, 1952.
56
9. De Huff L.G., and Thomas S.J., “Manganese”, “Mineral Facts and Problems”, Washington, U.S. Dept. of Interior, Bureau of Mines, pp. 549562, 1980. 10. Kalfaoğlu F. “Solid State Carbothermic Reduction of Denizli-Tavas Manganese Ore”, Master of Science Thesis in Metallurgical Engineering Department, Middle East Technical University, Ankara, September 1997. 11. Schottman F.J., “Ferroalloys”, “Mineral Facts and Problems”, Washington, U.S. Dept. of Interior, Bureau of Mines, pp. 293-301, 1980. 12. American Society for Testing and Materials (ASTM), “Annual Book of ASTM Standards”, Volume 01.02, “Ferrous Castings; Ferroalloys”, pp. 5961, 1993. 13. Middle East Technical University, METE 516 Production of Ferroalloys Lecture Notes, 1998 14. İmer S.T., “Smelting of High Carbon Ferromanganese from Denizli-Tavas Manganese Ore”, Master Of Science Thesis in Metallurgical Engineering Department, Middle East Technical University, Ankara, September 1997 15. U.S. Geological Survey, http://minerals.usgs.gov/minerals/pubs/commodity/manganese/, January 2007. 16. Manganez Özel İhtisas Komisyon Raporu, VIII. Beş Yıllık Kalkınma Planı, Devlet Planlama Teşkilatı, Ankara, 2001 17. Stepleton, J.M. et al, “Ferromanganese Production with Oxygen Enrichment”, J. Metals, pp. 45-48, 1961.
57
18. Hooper, R.T., “The Production of Ferromanganese”, J.Metals, pp. 88-92, 1968. 19. Hahn, Jr, W.C. and Muan, A., “Studies in the System MnO”, American Journal of Science, Vol. 258, pp. 66-78, 1960. 20. Coughlin, J.P., “Heats and Energies of the Formation of Inorganic Oxides”, Contributions to the Data on Theoretical Metallurgy XII, U.S.B.M. Bulletin No.542, 1959. 21. Dressel W.M., and Kenworthy H., “Thermal Behavior of Manganese Minerals in Controlled Atmospheres”, U.S.B.M Rep., no 576, p.35, 1961. 22. Tereyama, K. and Masao, I., “Study on Thermal Decomposition of MnO2 and Mn2O3 by Thermal Analysis”, Trans. Japan Inst. Metals, Volume 24, No. 11, pp. 754-758, 1983. 23. Kor, G. J. W., “Thermal Decomposition of Mn2O3 and the Reduction of Mn3O4 by C and CO”, Metallurgical Transactions B., Volume 9B, pp.307311 1978. 24. Akdoğan, G., “Kinetics and Mechanism of the Solid State Carbothermic Reduction of Wessel type Ferromanganese Ore”, PhD Thesis, University of Witwatersrand, Johannesburg, 1992. 25. Pentz, R.D., “An Investigation on the Beneficiation of Low Grade Manganese Ore with Special Reference to its Reducibility”, Master Of Science Thesis, Potchefstroom University for Christian Higher Education, 1970.
58
26. Yagihashi et al., “Properties and Reduction of Manganese Ores, Manganese Ore Reduction with CO gas or CO gas or CO-CO2 Gas Mixtures”, Tetsu To Hagane, Volume 49, No.8, pp.1059-1065, 1963.
27. Buchaud, J.P. and Fruchart, R., “Magnetic Properties of the System Mn-C”, Bull.Soc.Chim, Volume 7, No.275, pp.1579-1583, France, 1964. 28. Tanaka et al., “Thermodynamic Study of the Manganese –Carbon System by EMF Measurements”, Nippon Kenzoku Gakkaishi, Volume 37, No.5, pp.658-570, 1973. 29. Grimsley, W. D., See, J.B., King, R. P., “The Mechanism and Rate of Reduction of Mamatwan Manganese Ore Fines by Carbon”, J. South African Inst. Of Min. and Metallurgy, Volume 78, pp. 51-62, 1977 30. Rankin W.J. and Van Deventer J.S.J, “The Kinetics of Reduction of Manganous Oxide by Graphite”, J. South African Inst. of Min. and Metallurgy, pp. 239-247, 1980. 31. Keskinkılıç
E.,
“Smelting
of
Silicomanganese
from
Denizli-Tavas
Manganese Ore”, Master of Science Thesis in Metallurgical Engineering Department, Middle East Technical University, Ankara, August 2001. 32. Emeksiz F., “Smelting of High Carbon Ferromanganese from Denizli-Tavas Manganese Ore”, Master of Science Thesis in Metallurgical Engineering Department, Middle East Technical University, Ankara, September 1991. 33. Keçeli H., “Calcination of the Turkish Manganese Ore from Denizli-Tavas Region”, Fizykochemiczne Problemy Metalurgii, Volume 32, pp.203-313, 1998.
59
34. Yılmaz M., “Direct Leaching of Denizli-Tavas Manganese Ore with Sulphuric Acid”, Master of Science Thesis in Metallurgical and Materials Engineering Department, Middle East Technical University, Ankara, September 1998. 35. Huang, W., Metall. Trans. Vol 21A, pp.2115-2123, 1990.
60
APPENDIX A
EXAMPLE OF ACTIVE CARBON REQUIREMENT CALCULATION
According to the chemical analysis of Denizli-Tavas calcined manganese ore, 100 gr of ore contains, 39.69 g Mn, 5.45 g Fe, 17.30 g SiO2, 13.41 g CaO, 1.10 g MgO, 4.22 g Al2O3 In the present charge calculation, Mn in the ore was assumed to be in the form of Mn2O3. Similarly, Fe in the ore was taken as Fe2O3. Manganese oxides, iron oxides were all reduced by active carbon. In this run, the necessary amount of active carbon was calculated considering 100% stoichiometric reduction of all manganese oxides and iron oxides as follows: 7Mn2O3 + 27C = 2Mn7C3 + 21CO
(24)
3Fe2O3 + 11C = 2Fe3C + 9CO
(25)
Amount of Mn2O3 present in 50 g of calcined ore: W (Mn2O3) = 19.845*((2*55)+(3*16))/(2*55) = 28.504 g.
61
Amount of Fe2O3 present in 50 g of calcined ore: W (Fe2O3) = 5.20*((2*56)+(3*16))/(2*56) = 3.892 g. Number of moles of Mn2O3; n (Mn2O3) = 28.504/((2*55)+(3*16)) = 0.192 moles Number of moles of Fe2O3; n (Fe2O3) = 3.892/((2*56)+(3*16)) = 0.024 moles All calculations were done based on the CO content and according to reaction (24), reduction of 1 mole of Mn2O3 necessitates 3 moles of active carbon and 3 moles of active carbon is necessary for reduction of 1 mole of Fe2O3 as seen from reaction (25). Therefore, total active carbon necessary for these reactions was calculated below: Number of moles of active carbon; n (C) = (3*0.192) + (3*0.024) = 0.648 mole Amount of active carbon = 0.648*12 = 7.776 g. Therefore, stoichiometric reduction of 50 g of calcined ore requires 7.776 g of active carbon.
62
APPENDIX B
EXAMPLE OF CALCULATION OF COMPOSITON AND CARBIDES FROM SEM ANALYSIS
Mass of elements and compounds (g/mole): Al = 27
Al2O3 = 102
Mn = 55
Mn7C3 = 433
Fe = 56
Fe3C = 180
Mg = 24.3
MgO = 40.3
Si = 28
SiO2 = 60
Ca = 40
CaO = 56
K = 39
K2O = 94
O = 16 C = 12 For an example calculation of composition and carbides of the sample of 10th experiment is given below. SEM analysis of the sample; Element
Weight Concentration %
Mg
0.78
Al
2.64
Si
10.37
K
1.21
Ca
9.85
Mn Fe
66.34 8.82 63
Compounds were found by using this analysis according to below calculations; MgO = 0.78*(40/24) = 1.30 Al2O3 = 2.64*(102/54) = 4.99 SiO2 = 10.37*(60/28) = 22.22 K2O = 1.21*(94/78) = 1.46 CaO = 9.85*(56/40) = 13.79 With respect to the reduction percentage results, 65.37% of the manganese is assumed to be in the form of Mn7C3 and 34.63% of the manganese is assumed to be in the form of MnO. Also iron is assumed to be in the form of Fe3C. Mn7C3 = 66.34*(0.6537)*(433/385) = 47.42 MnO = 66.34*(0.3463)*(71/55) = 29.66 Fe3C = 8.82*(180/165) = 9.62 Sum of these weight percentages of compounds were corrected to 100 by using a correction factor (130.46/100) and the weight percentages of elements were recalculated from results;
Compound
Wt.(%)
Wt.(%) Corrected
MgO
1.30
1.00
Al2O3
4.99
3.82
SiO2
22.22
17.03
K2O
1.46
1.12
CaO
13.79
10.57
MnO
29.66
22.73
Mn7C3
47.42
36.35
Fe3C
9.62
7.38
Total
130.46
100.00
64
Element
Wt.(%)
Mg
0.60
Al
2.02
Si
7.95
K
0.93
Ca
7.55
Mn
50.85
Fe
6.76
O and C
23.34
APPENDIX C
EXAMPLE OF REDUCTION PERCENTAGE CALCULATION
Reduction percentage calculation of 4th experiment was given below as an example; Total weight of the sample before reduction was found 10.2 grams before reduction experiment. According to composition of the ore after calcination which was given in Table 3.2, Mn and Fe amounts were calculated and converted into moles; W (Mn) = 10.2*(57.02/100) = 5.816 g. n (Mn) = 5.81/158 = 0.036 moles W (Fe) = 10.2*(7.79/100) = 0.794 g. n (Mn) = 0.794/160 = 0.005 moles According to reactions (1) and (3) which were given in Appendix A, total amount of CO was calculated as below; n (CO) = (3*0.036) + (3*0.005) = 0.1253 moles W (CO) = 0.1253*(12+16) = 3.509 g. Therefore mass of removable oxygen was calculated as; Mass of Removable Oxygen = 3.509*(16/28) = 2,005 g.
65
Weight loss is assumed to be equal to mass of CO removed. So mass of oxygen removed was calculated as; Mass of CO removed = Weight loss = 2.943 g. Mass of Oxygen Removed = 2.94*(16/28) = 1.6817 g. Therefore reduction % for this experiment was found as; R % = (1.6817/2.005)*100 = 83.85
66