Interdiscip Sci Comput Life Sci (2013) 5: 45–52 DOI: 10.1007/s12539-013-0156-y
Optimization of Gaussian Kernel Function in Support Vector Machine Aided QSAR Studies of C-Aryl Glucoside SGLT2 Inhibitors Rebekah K. PRASOONA1,2 , A. JYOTI1,2 , Yadav MUKESH3∗ , Sharma NISHANT3 , Nayarisseri S. ANURAJ1,4 , Joshi SHOBHA5 1
2
(Department of Genetics, Osmania University, Hyderabad, India) (Institute of Genetics & Hospital for Genetic Diseases, Osmania University, Begumpet 500016, Hyderabad, India) 3 (Department of Pharmaceutical Chemistry, Softvision College, Indore 452010, Madhya Pradesh, India) 4 (Bioinformatics Research Laboratory, Eminent Biosciences, Indore 452010, Madhya Pradesh, India) 5 (Government Degree College, Depalpur, Indore 453001, Madhya Pradesh, India)
Received 8 March 2012 / Revised 17 April 2012 / Accepted 4 June 2012
Abstract: The present investigations include utility of latest statistical algorithm Support Vector Machine (SVM) to identify non-linear structure activity relationship between IC50 values and structures of C-aryl glucoside SGLT2 inhibitors. Training dataset consisted of forty molecules and the remaining six molecules were chosen for test set validation. SVM under Gaussian Kernel Function yielded non-linear QSAR models. Forward selection algorithm was applied after pruning and redundancy check on molecular descriptors. Internal validations of QSAR models have been achieved using R2CV (LOO), PRESS, SDEP and Y-Scrambling. SVM aided non-linear models are more efficient when optimization of Gaussian Kernel Function was introduced. Non-linear QSAR studies further identified atomic van der Waals volumes, atomic masses, sum of geometrical distances between O..S and degree of unsaturation as molecular descriptors and crucial structural requirements to model IC50 of C-aryl glucoside derivatives. Key words: QSAR, Support Vector Machine (SVM), Gaussian Kernel Function, non-linear QSAR, C-aryl glucoside, SGLT2 inhibitors.
1 Introduction Diabetes, a disease on high concerns to human health has claimed 285 million people in 2010. Estimation states that its present status from 6.4% of world population may scale up to 7.8% by 2030 (International Diabetes Federation, 2009). Diabetes has been leading to early age disease and deaths. Between two forms of diabetes, type I (5-10%) is autoimmune and treated by external insulin supply while type II (90-95%) is state of glucose accumulation leading to pathophysiology (Dwarakanathan, 2006). In diabetes type II, glucose transporter proteins supply glucose to fuel up tissues, membranes, muscles and organs (Brown, 2000; Wright et al., 2007; Kloeckener-Gruissem, 2008). This facilitative glucose carriage covering cellular domain is conducted by GLUT transporter family of proteins. Sodium-glucose transport proteins (SGLTs), encoded by SLC5 gene are found responsible in glucose transport in the intestine and kidney. ∗
Corresponding author. E-mail:
[email protected]
S1 segment of proximal convoluted tubule is primary site for reabsorption (90%) of glucose in mammalian kidney (Berry, 1991). Among SGLTs, SGLT2 transporters are in key role at S1 segment (Rector, 1983; Moe, 2000). SGLT2 helps with translocation of attached sodium and glucose with it across apical cell membrane. This secondary active-transport works on electrochemical gradient and thus makes SGLT2 transporter protein an attractive therapeutic target in typeII diabetes (Bakris, 2009; Gerich, 2001). Administration of phlorizin, a natural product obtained from root bark of apple tree in 19th century causes glucosuria. This evidence led medicinal society to conclude that removal of extra glucose from a diabetic patient thorough kidney in urine is achievable (Rossetti et al., 1987; Ehrenkranz et al., 2005). Among C-aryl glucosides, a molecule named dapagliflozin was identified as potent SGLT2 inhibitor in the treatment of diabetes type II (Junwon et al., 2010). Derivatives of this class have confirmed enhanced chemical stability and biological responses resulted from glucosidic bond (Fig. 1). Quantitative Structure Activity Relationship
46
Interdiscip Sci Comput Life Sci (2013) 5: 45–52 Cl HO
OEt
O
HO
OH
mization of SVM algorithm in forward selection wrapper. Table 1
OH
Fig. 1
Dapagliflozin
(QSAR) is a tool that implies mathematics and statistics to identify and predict the biological response of compounds in class as a function of their structure. Generally structural properties are expressed in numerical magnitudes as molecular descriptors derived from chemical structures. Last three decades have been evolutionary in QSAR in development of methodologies and statistical approaches in regression like Support Vector Machine (SVM), Neural Network (NN), Partial Least Square (PLS), Regression trees and ensembles etc. (Axel et al., 2008). Multiple linear regression is the most simple and significant approach used in QSAR so far. This technique helped to identify linear relationship among molecular structures and their biological responses. Often, structure activity relationship can be non-linear, which cannot be identified using MLR analysis (Tetyana et al., 2003). Recent developments and work reported confer SVM as an accurate, robust and fast statistical tool (Pavlidis, 2004; Norinder, 2003). Efficiency of SVM in identifying non-linear QSAR has been appreciable and acceptable. Furthermore, development of kernel functions like Gaussian and polynomial made SVM even more applicable and an alternative tool in QSAR studies. SVM developed by Vapnik for classification was further optimized and applied to achieve regression in exploring non-linear QSAR models (Cortes and Vapnik, 1995). The present work includes optimization of Gaussian Kernel Function through regulation of permissible values of epsilon value, cost value and sigma values. Optimization of Gaussian Kernel Function was investigated in order to reveal the impact of variation in default parameters on statistical fitness of QSAR models. The computational tool which has been extensively used in the present investigation is Sarchitect Designer 2.5.0 (Strand Life Science). Sarchitect, a sophisticated tool with simple user interface, provides latest machine learning techniques like MLR, SVM, ANN, PLS etc. for regression and classification. Its heuristic accuracy, robustness and simple interface makes it a tool of choice to achieve QSAR models.
Structural details of C-aryl glucoside SGLT2 inhibitors, original IC50 and log IC50 used in present investigations. Structures with (*) are included in test set validation. IC50
log IC50
(nM)
(nM)
6.25
0.7959
6910
3.8395
1420
3.1523
H
1230
3.0899
5
Cl
542
2.7340
6
Cl
103
2.0128
7
Cl
24.9
1.3962
(8*)
Cl
45.3
1.6561
9
Cl
53.0
1.7243
10
Cl
2390
3.3784
11
Cl
214
2.3304
12
Cl
379
2.5786
13
Cl
353
2.5478
(14*)
Cl
122
2.0864
Molecule
R1
R2
1
H
H
(2*)
H
3
H
4
CH3
N
CH3
CH3
N
N
Cl
CH3
CH3
CH3
2 Methodology We have achieved SVM optimization for present dataset (Table 1) as results obtained from MLR could not be improved in terms of regression parameters. Description under the following heading explains opti-
CH3
Interdiscip Sci Comput Life Sci (2013) 5: 45–52
47 continue
Molecule
R1
15
Cl
16
Cl
IC50
log IC50
(nM)
(nM)
CH3
146
CH3
10.9
R2
O
S
continue Molecule
R1
2.1644
30
Cl
1.0374
31
Cl
R2
(nM)
7.03
0.8470
O
17.7
1.2480
106
2.0253
58.3
1.7657
10.6
1.0253
249
2.3962
257
2.4099
119
2.0755
3280
3.5159
14.4
1.1584
3.51
0.5453
762
2.8820
712
2.8525
18.2
1.2601
O
Cl
F
155
2.1903
32
Cl
F F 18
log IC50
O
F 17
IC50 (nM)
H3C F
Cl
759
2.8802
33
Cl
34
Cl
35
Cl
(36*)
Cl
CH3
O
F 19
Cl
445
2.6484
20
Cl
16.6
1.2201
21
Cl
126
2.1004
Cl
O
O
N
O
CH3 N 22
30.3
Cl
1.4814 (37*)
Cl
N
CH3 (23*)
N
Cl
CH3 638
2.8048
N 24
Cl
CH3
97.4
Cl
Cl
(39*)
Cl
40
Cl
1.9886
CH3 25
38
CH3 N N
36.4
1.5611
81.6
1.9117
S
N
26
Cl
N
S
S N 27
562
Cl
2.7497
(41*)
Cl
CH3 S
N (28*)
4.06
Cl
0.6085
42
Cl
N
Cl
N 29
Cl
N
190
2.2788
(43*)
S Cl
Cl
48
Interdiscip Sci Comput Life Sci (2013) 5: 45–52 continue
Molecule
R1
44
Cl
45
Cl
R2
IC50
log IC50
(nM)
(nM)
44.5
1.6484
21.8
1.3385
72.6
1.8609
S
N S S 46
Cl
N
N
2.1 Optimization of Gaussian Kernel Function The main idea of SVM (Smola and Sch¨ olkopf, 2004; Sch¨ olkopf and Smola, 2002) is to find the “flattest” (i.e. less complex) linear function that approximates the given data with ε precision in a kernel-induced feature space. This is reached using the ε-insensitive loss function, which penalizes errors greater that ε. The trade between the flatness of the estimate and the amount up to which deviations greater than ε are tolerated, is determined by the regularization constant C≥0. This setting is transformed into a constrained optimization problem, in which the Wolfe dual is computed, resulting in a convex programming problem. The solution of this problem is sparse: a subset of the resulting Lagrange multipliers will be nonzero (Kuhn and Tucker, 1951; Pavlidis, 2004) and the associated samples will be support vectors (SV). Only these vectors Lagrange multipliers from the SVR and LS-SVM models were explained for the first time in terms of molecular structures, descriptors, biological activity and principal components. 2.2 Default parameters Gaussian Kernel Function has been applied in forward selection wrapper with epsilon value 0.1 (the prediction error acceptable by the user, i.e. the acceptable difference between the target value for regression and the predicted value), cost value 100 (increasing this parameter will reduce the training error but at the cost of generalization achieved by the regression model) and sigma value (the default value is set to 1.0). Typically, there is an optimum value of sigma such that going below this value decreases both misclassification (training error) and generalization and going above this value increases misclassification. Models obtained using Gaussian Kernel Function identified non-linear relationship between activity and descriptors. 2.3 Optimization of parameters Optimization of Gaussian Kernel Function was achieved by the following variation when introduced in
deciding parameters epsilon, cost value and sigma values. Sigma values are held as default constant i.e. 1.0. Lowering this parameter may lead to misclassification and further selection of non-significant descriptors, which can produce good statistical models but structure-activity relationship models can be nonrelevant in bio-chemical aspects. Instead of all risk probability we lowered its value to less than 1.0 i.e. 0.9, 0.8 and 0.7. This risk is attributed to the fact that results of MLR have been nearly 0.8 in terms of R2 . Results discussed below were obtained after optimizing sigma values to 0.9 from 1.0. Epsilon values, by default are 0.1, which is a prediction error acceptance by user, can be optimized to increase from 0.1 (> 0.1), in present investigations we optimized the limits of epsilon above 0.1 to 0.9. This decision can be supported by the assumption that to get a more significant QSAR models standard error limit can be permitted. Alteration of epsilon to 0.5 produced present outcome of SVM non-linear models included in study. Cost value - The cost or penalty associated with sample error. If the error is less than the epsilon value, the cost incurred is zero, else if the error is more than epsilon then the cost associated with the error is Cost∗(error-epsilon). The default value is 100. Increasing this parameter will reduce the training error but at the cost of generalization achieved by the regression model. We have taken risk of generalization by increasing cost value above 100 (> 100) i.e. 110, 120..., 200. This optimization approach recorded fall in statistical outcomes. Hereby we decided to hold it constant i.e. 100.
3 Results and discussions Stepwise multiple regression analysis facilitated by forward selection algorithm of SARCHITECT Designer 2.5.0 (developed by Strands Life Science Pvt. Ltd.) produced QSAR models with acceptable statistical parameters including R2 , R2 A, S.E. and F-stat values (Table 2). 3.1 SVM aided non-linear QSAR SVM, a statistically fast, robust and accurate method (Vapnik, 1999; Furey et al., 2000) was also employed for the supervised learning of datasets generally used for establishing the non-linear relationship of variables with activity. Descriptors selected for forward selection were collected. Their redundancy check was performed, statistical parameters obtained in forwards selection of optimized SVM, contributing to model fitness are shown in Table 2. The five models including different descriptors from various classes were employed. DISPm: Geometrical descriptor: d COMMA2 value / weighted by atomic
Interdiscip Sci Comput Life Sci (2013) 5: 45–52 Table 2
49
Support Vector Machine analysis and their statistical parameters including R2 , R2 A and standard errors. Max Absolute Error
Mean Absolute Error
Train Metric
Train Metric
Model
R2
One-descriptor model
0.1877
1.5211
0.5361
0.3337
two-descriptor model
0.5787
1.2938
0.3534
0.4899
three-descriptor model
0.6840
0.9673
0.2940
0.5871
four-descriptor model
0.7718
0.9354
0.2412
0.6413
five-descriptor model
0.8480
0.8985
0.1914
0.6682
4.0
3.5
3.0
Predicted LogIC50
Predicted LogIC50
3.5
4.0
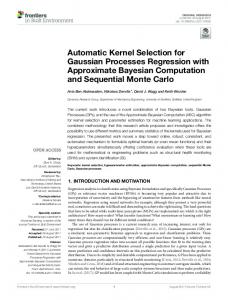
y = 0.767x + 0.498 R2 = 0.788
2.5 2.0 1.5 1.0 0.5
2.5 2.0 1.5 1.0 0.5
0 0
(b) 1
2 3 Observed LogIC50
0 0
4
1
2 3 Observed LogIC50
4
1.0 (a)
1.0 (b)
0.5
0.5
Correlation
Correlation
Graphical Correlation of Observed (Log IC50 ) Vs. Predicted (Log IC50 ) for training set (36 molecules) using SVM aided non-linear MODEL -4 (a) and MODEL-5 (b).
0
0
−1.5
Fig. 3
y = 0.872x + 0.246 R2 = 0.877
3.0
(a)
Fig. 2
(R2CV N-Fold)
−1.0
−0.5 0 R-Square
0.5
1.0
−1.5
−1.0
−0.5 0 R-Square
0.5
1.0
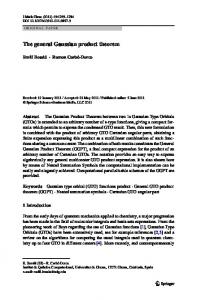
Graphical representation of Y-scrambling as internal validation parameter using SVM aided non-linear MODEL-4 (a) and MODEL-5 (b).
masses (svm) c5AB, R4v+, G (O..S) Geometrical descriptor denotes sum of geometrical distances between O..S and Du belongs to a class of WHIM descriptors and D total accessibility index / unweighted to find the relationship with IC50 of the dataset compounds. SVM aided non-linear models are found to be more efficient with the statistical fitness and prediction data. 3.2 Model validation Non-linear QSAR models (tetra and pentavariable) are manifested to obtain predicted binding affinity and
further correlated with observed binding affinity. Correlations of observed and predicted binding affinities have been reported in Table 3 along with its graphical correlation view in Fig. 2. Method of N-folded R2 cv is introduced as internal cross validation parameter for univariable to hexavariable models. Calculations suggest that R2 cv is stable and there is no sharp fall in R2 cv values when correlated with original values of R2 . This assessment is shown in Table 2. Y-scrambling guards against the possibility of hav-
50
Interdiscip Sci Comput Life Sci (2013) 5: 45–52
Table 3
Molecules
Correlation of observed (Log IC50 ) values and predicted (Log IC50 ) values using SVM aided nonlinear QSAR MODEL-4 and MODEL-5. Log IC50 (nM)
Model 4
Model 5
Predicted Log
Residual Log
Predicted Log
Residual Log
IC50 (nM)
IC50 (nM)
IC50 (nM)
IC50 (nM)
1
0.7960
0.7699
0.0261
0.7958
0.0002
(2*)
3.8390
3.1973
0.6417
3.8526
−0.0136
3
3.1520
3.1554
−0.0034
3.1557
−0.0037
4
3.0900
3.0868
0.0032
3.0867
0.0033
5
2.7340
2.3800
0.3540
2.4117
0.3223
6
2.0130
2.1447
−0.1317
1.8024
0.2106
7
1.3960
2.0586
−0.6626
1.5943
−0.1983
(8*)
1.6560
2.0554
−0.3994
1.9538
−0.2978
9
1.7240
2.0666
−0.3426
1.7239
0.0001
10
3.3780
3.3813
−0.0033
3.3814
−0.0034
11
2.3300
2.4277
−0.0977
2.4762
−0.1462
12
2.5790
2.4722
0.1068
2.5494
0.0296
13
2.5480
2.4045
0.1435
2.5514
−0.0034
(14*)
2.0860
2.8865
−0.8005
3.3005
−1.2145
15
2.1640
1.5840
0.5800
2.1642
−0.0002
16
1.0370
1.0336
0.0034
1.0360
0.0010
17
2.1900
2.1895
0.0005
2.1920
−0.0020
18
2.8800
2.6888
0.1912
2.8771
0.0029
19
2.6480
2.6466
0.0014
2.5931
0.0549
20
1.2200
1.7924
−0.5724
1.7012
−0.4812
21
2.1000
1.8622
0.2378
1.9843
0.1157
22
1.4810
1.7342
−0.2532
1.7393
−0.2583
(23*)
2.8050
2.0583
0.7467
1.8041
1.0009
24
1.9890
1.9752
0.0138
1.9863
0.0027
25
1.5610
2.2015
−0.6405
2.1337
−0.5727
26
1.9120
1.9152
−0.0032
1.7998
0.1122
27
2.7500
1.9264
0.8236
1.8709
0.8791 −1.1893
(28*)
0.6090
1.7052
−1.0962
1.7983
29
2.2790
1.7013
0.5777
1.6782
0.6008
30
0.8470
1.1050
−0.2580
1.1911
−0.3441
31
1.2480
1.2098
0.0382
1.1820
0.0660
32
2.0250
2.0279
−0.0029
2.0255
−0.0005
33
1.7660
1.3825
0.3835
1.3234
0.4426
34
1.0250
1.8643
−0.8393
1.4336
−0.4086
35
2.3960
2.3933
0.0027
2.3929
0.0031
(36*)
2.4100
1.0894
1.3206
1.1967
1.2133
(37*)
2.0760
2.1253
−0.0493
1.9741
0.1019
38
3.5160
3.5155
0.0005
3.5156
0.0004
(39*)
1.1580
0.5541
0.6039
−0.4462
1.6042
40
0.5450
1.1965
−0.6515
0.5477
−0.0027
(41*)
2.8820
1.6503
1.2317
2.0009
0.8811
42
2.8520
2.8548
−0.0028
2.8547
−0.0027
(43*)
1.2600
0.7254
0.5346
0.9510
0.3090
44
1.6480
1.6310
0.0170
1.6446
0.0034
45
1.3380
1.3342
0.0038
1.3347
0.0033
46
1.8610
1.8644
−0.0034
1.8576
0.0034
(*) Compounds are included in external test set.
Interdiscip Sci Comput Life Sci (2013) 5: 45–52
51 4.5
3.5
4.0 3.5
3.0 Predicted LogIC50
Predicted LogIC50
3.0 2.5 2.0 1.5
2.5 2.0 1.5 1.0 0.5
1.0
0 0.5
−0.5
(a) 0 0
Fig. 4
2 4 Observed LogIC50
6
−1.0 0
(b) 1
2 3 Observed LogIC50
4
5
Graphical Correlation of Observed (Log IC50 ) Vs. Predicted (Log IC50 ) for test set (10 molecules) using SVM aided non-linear MODEL-4 and MODEL-5.
ing learned chance models, where descriptors happen to be correlated to the endpoint for the particular dataset by statistical chance. Models are fitted for randomly reordered activity value and compared with the model obtained for actual activity. Further, absence of any by chance modeling events is confirmed by 100 iterations and correlation of R2 values as given in Fig. 3. Set of 10 molecules, kept aside for test set validation were further submitted to activity prediction using SVM aided non-linear models (tetravariable and pentavariables). Results are availed in Table 3 and graphical correlation in Fig. 4. Overall SVM models reveal to be efficient in predictive powers.
4 Conclusion Results and discussion show utility of SVM to identify non-linear relationship, which for a long time QSAR community has deprived. Significantly the superiority of SVM can be easily distinguished in present investigations. SVM has suggested that there could be non-linear structure relationship when linear approaches fail to identify it. Gaussian Kernel Function was optimized through insensitive loss function parameters. Autocorrelated atomic van der Waals volumes, autocorrelated atomic polarazibility, aromatic index and rotatable bond fractions are identified as structural properties which are linearly (MLR) related to IC50 values of SGLT2 inhibitors. Non-linear QSAR studies identified R maximal autocorrelation of lag 4 / weighted by atomic van der Waals volumes, d COMMA2 value / weighted by atomic masses, number of fragments Cyc5[AB] with label C on atom 1, sum of geometrical distances between O..S and degree of unsaturation as molecular descriptors.
References [1] Aksyonova, T.I., Volkovich, V.V., Tetko, I.V. 2003. Robust polynomial neural networks in quantativestructure activity relationship studies. Syst Anal Model Simul 43, 1331-1339. [2] Bakris, G.L., Fonseca, V., Sharma, K., Wright, E. 2009. Renal sodium-glucose transport: Role in diabetes mellitus and potential clinical implications. Kidney Int 75, 1272-1277. [3] Berry, C.A., Rector, F.C. Jr. 1991. Renal transport of glucose, amino acids, sodium, chloride, and water. In: Brenner, B.M., Rector, F.C. Jr. (Eds.) The Kidney, 4th Edition, W.B. Saunders, Philadelphia, 245-282. [4] Brown, G.K. 2000.Glucose transporters: Structure, function and consequences of glucose deficiency. J Inherit Metab Dis 23, 237-246. [5] Cortes, C., Vapnik, V. 1995. Support-vector networks. Mach Learn 20, 273-297. [6] Dwarakanathan, A. 2006. Diabetes update. J Insur Med 38, 20-30. [7] Ehrenkranz, J.R., Lewis, N.G., Kahn, C.R., Roth, J. 2005. Phlorizin: A review. Diabetes Metab Res Rev 21, 31-38. [8] Furey, T., Cristianini, N., Duffy, N., Bednarski, D., Schummer, M., Haussler, D. 2000. Support vector machine classification and validation of cancer tissue samples using microarray expression data. Bioinformatics 16, 906-914. [9] Gerich, J.E., Woerle, H.J., Meyer, C., Stumvoll, M. 2001. Renal gluconeogenesis. Diabetes Care 24, 382391. [10] International Diabetes Federation. 2009. Diabetes Atlas, 4th Edition, Montreal, Canada. [11] Kloeckener-Gruissem, B., Vandekerckhove, K., Nurnberg, G., Neidhardt, J., Zeitz, C., Nurnberg, P., Schipper, I., Berger, W. 2008. Mutation of solute carrier
52
Interdiscip Sci Comput Life Sci (2013) 5: 45–52 SLC16A12 associates with a syndrome combining juvenile cataract with microcornea and renal glucosuria. Am J Hum Genet 82, 772-779.
[12] Kuhn, H.W., Tucker, A.W. 1951. Nonlinear programming. In: Neyman, J. (Ed.) Proceedings of the Second Berkeley Symposium on Mathematical Statistics and Probability, Berkeley, CA, University of California Press, Los Angeles , 481-492. [13] Lee, J., Lee, S.H., Seo, H.J., Son, E.J., Lee, S.H., Jung, M.E., Lee, M., Han, H.K., Kim, J., Kang, J., Lee, J. 2010. Novel C-aryl glucoside SGLT2 inhibitors as potential antidiabetic agents. 1,3,4Thiadiazolylmethylphenyl glucoside congeners. Bioor & Med Chem 18, 2178-2194. [14] Norinder, U. 2003. Support vector machine models in drug design: Application to drug transport processes and QSAR using simplex optimizations and variable selection. Neurocomputing 55, 337-346. [15] Pavlidis, P., Wapinski, I., Noble, W.S. 2004. Support vector machine classification on the web. Bioinformatics 20, 586-587. [16] Rector, F.C. Jr. 1983. Sodium, bicarbonate, and chloride absorption by the proximal tubule. Am J Physiol 244, F461-F471.
[17] Rossetti, L., Shulman, G.I., Zawalich, W., DeFronzo, R.A. 1987. Effect of chronic hyperglycemia on in vivo insulin secretion in partially pancreatectomized rats. J Clin Invest 80, 1037-1044. [18] Sch¨ olkopf, B., Smola, A.J. 2002. Learning with Kernels: Support Vector Machines, Regularization, Optimization and Beyond, MIT Press, Cambridge, MA, 185-208. [19] Smola, A.J., Sch¨ olkopf, B. 2004. A tutorial on support vector regression. Statistics and computing. Stat Comput 14, 199-222. [20] Soto, A.J., Cecchini, R.L., Vazquez, G.E., Ponzoni, I. 2008. An evolutionary approach for feature selection applied to ADMET prediction. Amer J Artif Intell 37, 55-63. [21] Vapnik, V. 1999. The Nature of Statistical Learning Theory, Verlag Springer, New York. [22] Wright, E.M., Hirayama, B.A., Loo, D.F. 2007. Active sugar transport in health and disease. J Intern Med 261, 32-43.