Optimization of GEANT4 settings for Proton Pencil Beam Scanning simulations using GATE L. Grevillot1,2,3,6 , T. Frisson1,2,3 , N. Zahra1,3,4 , D. Bertrand6 , F. Stichelbaut6 , N. Freud1,5 and D. Sarrut1,2,3 E-mail:
[email protected] 1 Universit´e de Lyon, F-69622 Lyon, France. 2 Creatis, CNRS UMR 5220, F-69622, Villeurbanne, France. 3 L´eon B´erard Cancer Centre, F-69373 Lyon cedex 08, France. 4 IPNL, CNRS UMR 5822, F-69622, Villeurbanne, France. 5 CNDRI, INSA-Lyon, F-69621, Villeurbanne Cedex, France 6 IBA, B-1348, Louvain-la-Neuve, Belgium.
GEANT4 settings for proton-therapy applications 1 2 3 4 5 6 7 8 9 10 11 12 13 14 15 16 17 18 19 20 21 22 23 24 25 26 27 28 29
30
31 32 33 34 35 36 37 38 39 40 41 42 43 44
2
Abstract. Purpose: This study investigated the different GEANT4 settings for protontherapy applications in view of Treatment Planning System (TPS) comparisons. The GEANT4.9.2 release was used through the GATE platform. We focused on the Pencil Beam Scanning (PBS) delivery technique, which allows for Intensity Modulated Proton-Therapy (IMPT) applications. Methods: The most relevant options and parameters (range cut, step size, database binning) that influence the dose deposition were investigated, in order to settle a robust, accurate and efficient simulation environment. In this perspective, simulations of depth-dose profiles and transverse profiles at different depths and energies between 100 MeV and 230 MeV have been assessed against reference measurements in water and PMMA. These measurements were performed in Essen in Germany, using the IBA dedicated Pencil Beam Scanning system, with integral Bragg-peak chambers and radiochromic films. GEANT4 simulations were also compared to the PHITS.2.14 and MCNPX.2.5.0 Monte Carlo (MC) codes. Results: Depth-dose simulations reached 0.3 mm range accuracy, with a dose agreement around 1% over a set of 5 different energies. The transverse profiles simulated using the different MC codes showed discrepancies, with up to 15% beam widening difference between GEANT4 and MCNPX in water. A 8% difference between the GEANT4 multiple scattering (MS) and single scattering (SS) algorithms was observed. The simulations showed the inability of reproducing accurately the measured transverse dose spreading with depth in PMMA, corroborating the fact that GEANT4 underestimates the lateral dose spreading. Conclusion: A reference physics-list and an optimized parameters-list have been proposed. Satisfactory agreement against depth-dose profiles measurements was obtained. The simulation of transverse profiles using different MC codes showed inconsistencies. This point is crucial for PBS delivery simulations and suggests that the GEANT4 MS algorithm should be revised. GATE was found to be a very convenient interface to perform this GEANT4-based study.
1. Introduction The main asset of ions over photons is their inverse depth-dose profiles, allowing higher doses to tumors, while better sparing healthy tissues. The most attractive and advanced technique in hadron therapy consists in irradiating patients with small pencil beams of a few millimeters in diameter. The pencil beams are scanned transversally in the patient using two scanning magnets. Several iso-energy layers are then used to cover the whole tumor volume. An active beam delivery system has been used since 1997 at the Paul Scherrer Institute (PSI) in Switzerland for proton therapy and at the Gesellschaft f¨ ur Schwerionenforschung (GSI) in Germany for carbon-ion therapy [1]. When computing dose distributions with passive beam techniques, one critical point is the Bragg peak range uncertainty. For active beam delivery, the lateral spreading of each single pencil beam also needs to be correctly accounted for. In this setting, MC simulations have become increasingly important for evaluating treatment plans and dose distributions in patients. The dose accuracy reached with analytical algorithms implemented in TPS is limited, for instance near heterogeneities and MC simulation
GEANT4 settings for proton-therapy applications
3
61
can be considered as a powerful Quality Assurance (QA) tool. It has been extensively used at the Massachusetts General Hospital in Boston for TPS comparisons, mostly for passive irradiation techniques, using the GEANT4 toolkit [2]. From a research standpoint, MC simulation allows also for a better understanding of the dose deposition mechanisms in the patient and opens many research areas. In this study, we used GEANT4 version 9.2 through the GATE application[3]. This study was conducted in order to analyze the physics implemented in GEANT4 and to select the appropriate settings for patient dose calculation, with an ultimate objective of treatment planning benchmarking. This work dedicated to proton-therapy applications builds upon a previous study oriented toward carbon ion simulations using older GEANT4 releases [4]. Firstly, a short review of the relevant physics models and parameters available in GEANT4 is presented in section 2. Secondly, the influence of different settings on dose calculation is investigated in section 3. A reference physics-list and an optimized parameters-list are then proposed. Comparisons with two other MC codes: MCNPX2.5.0 [5] and PHITS2.14 [6] are presented in section 4. Experimental measurements in water and PMMA are described and compared to GEANT4 simulations in sections 5 and 6.
62
2. Simulation settings
63
2.1. Pencil beam model
45 46 47 48 49 50 51 52 53 54 55 56 57 58 59 60
75
In this study, a simple pencil beam model was used in order to reproduce the nozzle output beam based on reference measurements. The energetic spectrum was assumed Gaussian and adjusted over depth-dose measurements, as presented in section 6.1. The 2D probability density function (PDF) of protons was considered normal (Gaussian distibution) and adjusted over transverse profile measurements performed at the isocenter (section 6.2). By convention, Cartesian coordinates were used, with z the beam direction, x and y the lateral position. In this paper, the expression “spot size” will refer to the PDF parameters σx and σy : the standard deviation in the x and y directions at the isocenter. The role of the beam divergence on the lateral dose spreading in water was estimated negligible compared to the effect of multiple Coulomb scattering. This assumption has been checked by simulating a realistic beam divergence of σ = 3 mrad. Thus, the intrinsic beam divergence was neglected.
76
2.2. Physics-list selection
64 65 66 67 68 69 70 71 72 73 74
77 78 79 80 81 82
For medical physics applications the electromagnetic (EM) standard package with the option 3 (Opt3) parameters-list is recommended by the GEANT4 Electromagnetic Standard working group [7]. Opt3 refers to options/processes which are described in the next sections and proposes reference parameters to reach a high level of accuracy. Our physics-list is mainly based on a reference paper dedicated to protontherapy applications [8], using the standard package for EM interactions and a recently
GEANT4 settings for proton-therapy applications
4
94
implemented process (G4UHadronElasticProcess) combined with the G4HadronElastic model for elastic hadronic (HAD) interactions. Details about available models have been discussed elsewhere [9, 10, 8, 11, 12]. The only difference in our physics-list compared to the one proposed in [8] is the choice of the inelastic HAD model. By comparing the Bertni, binary cascade, precompound and QMD models against depthdose measurements in water, the precompound model was found to best match the measurements. No difference between the different models was observed for the transverse dose profile simulation. Therefore, the precompound model has been selected for the rest of the study. The satisfactory agreement obtained with the precompound model has been pointed out in two recent studies investigating respectively a model of a proton magnetic beam scanning delivery nozzle [13] and the prompt-gamma production during proton irradiation [14].
95
2.3. Multiple scattering (MS) and single scattering (SS)
83 84 85 86 87 88 89 90 91 92 93
96 97 98 99 100 101 102 103 104 105 106 107 108 109 110 111 112 113 114 115 116 117 118 119 120
Charged particles transported through matter are disrupted by the surrounding electromagnetic field, which is produced by the nucleus and orbiting electrons encountered. The simulation of each single interaction (SS algorithm) increases drastically the number of steps and simulation time, but is considered as the reference, since it is based on cross-section measurements. It is shown in section 4 that SS multiplies the simulation time by a factor of 103 . To overcome this issue, condensed algorithms (MS theories) have been developed, so that the global effect of multiple collisions is computed at the end of each step. This global effect encloses the net displacement, energy loss and change of direction [12]. MS algorithms are considered exact if they reproduce the SS behavior. Most of the MC codes implemented the MS theories of Moli`ere, Goudsmit-Saunderson or Lewis [12]. Besides the angular distribution after a step, the advantage of the Lewis theory over the others is the computation of the moment of the spatial distribution as well [12]. The computation of the spatial displacement is not part of those theories and each MC code has to develop its own algorithm. MS theories are subjects of interest and recent investigations on the scattering power, considered as a key quantity for beam transport in matter, may improve the accuracy of the MS algorithms implemented in MC codes [15, 16]. It was shown that the MS algorithm implemented in GEANT4 release 9.1 depends on the step size [16]. Improvements of the scattering power calculation may avoid this dependence in the future and hence, improve the MS accuracy of MC codes. The management of geometrical boundaries is also a complex task, because particles are not allowed to cross a boundary without performing a step. In GEANT4, several stepping algorithms [12], wich are included in the MS model can be selected: ”simple“, ”safety“ and ”distanceToBoundary“, depending on the accuracy required. The MS model implemented in GEANT4 is based on the Lewis theory and is detailed in [12].
GEANT4 settings for proton-therapy applications 121
122 123 124 125 126 127 128 129 130 131 132 133 134 135 136 137 138 139
140
5
2.4. Relationship between simulation parameters The two main parameters in a GEANT4 simulation are the step, which corresponds to the distance to the next interaction and the range cut, which corresponds to the production threshold for secondary particles (gammas, electrons and positrons). The energy loss of ions in matter is governed by the ionization process. Below the range cut threshold, the energy loss occurs continuously along the ion track (at each step), while above the threshold, it is caused by the explicit production of secondary particles (discrete component) [12, 11]. All the particles generated are then tracked until no energy is left. The continuous energy loss of charged particles is calculated by the restricted stopping power equation, defined in GEANT4 as the Bethe-Bloch formula integrated between 0 and the range cut value. Before starting a simulation, GEANT4 initializes tables to describe EM processes: (restricted stopping power), range and inverse range lambda (mean free path), dE dx tables [11]. These tables are pre-calculated according to the simulation parameters defined by the user, in order to save time during the simulation. By default, 84 bins are stored between 100 eV and 100 TeV, corresponding to a resolution of 7 bins/decade for each material, but the binning parameter can be adjusted by the user. In fact, the lambda table should be called cross-section (σ) table, because it stores the cross-sections and indirectly indicates the mean free path (λ) values via equation (1). 1 (1) λ(Z, E) = nat × σ(Z, E)
149
where nat is the number of atoms per unit volume. Range and inverse range tables show the correspondance between range cut and energy. The step length is sampled at each step using the lambda table for EM processes and directly in the database for the HAD processes. Hence, a sufficient number of bins in the different tables is mandatory to accurately describe EM interactions. In the GEANT4 Opt3 parameters-list, 220 bins between 100 eV and 10 TeV, i.e 20 bins/decade, are advised. It is important to note that the range cut threshold influences the values stored in both the lambda and dE dx tables. Consequently, the step lengths sampled, continuous energy loss along the steps and δe− production of charged particles depend on the range cut threshold.
150
2.5. Dealing with the continuous energy loss
141 142 143 144 145 146 147 148
151 152 153 154
155
156 157
The continuous energy loss imposes a limit on the step length, because of the energy dependence of the cross sections. It is assumed in many MC codes that the crosssection is constant during a step, consequently, the continuous energy loss is computed via equation (2). dE (2) dx with dE the restricted stopping power of the charged particle at the beginning of the step. dx In high-gradient cross-section regions, the approximation of constant cross-sections along ContinuousEnergyLoss = Step ×
GEANT4 settings for proton-therapy applications
159 160 161 162 163 164 165 166 167 168
169
the step may lead to inaccurate dose deposit. This point is very significant in hadrontherapy in the Bragg-peak region. The step length can be limited by two user-defined limits: maximum allowed step [17] and stepping function [11]. The maximum allowed step is managed like a process in competition with the other processes and limits the maximum step length according to a user-given value. The stepping function described in equation (3) is a dynamic step limitation which decreases the particle step limit (∆Slim ) in parallel with the particle decreasing range (Figure 1). The stepping function is defined by 2 parameters: “dRoverRange“ and “finalRange“. The “dRoverRange” step ratio. As the particle (αR ) parameter defines the maximum step size allowed as a range travels, the maximum step allowed decreases until the particle range (R) becomes lower than the “finalRange“ (ρR ) parameter. ∆Slim = αR .R + ρR .(1 − αR )(2 −
StepLimiter StepFunction2
ρR ) R
(3)
StepFunction1 Dose
Maximum step size (mm)
100
1
10
0.8
1
0.6
0.1
0.4
0.01
0.2
0.001
Normalized dose (A.U.)
158
6
0 0
100
200
300
400
Depth in water (mm)
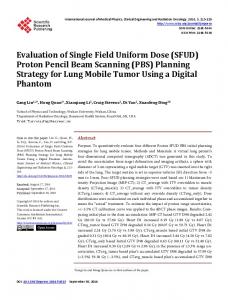
Figure 1. This figure shows the maximum step length allowed for a 230 MeV proton beam in water, with the stepping function and default parameter (αR = 0.2 and ρR = 1 mm) in green (StepFunction2); with the stepping function and αR = 0.01 and ρR = 10 µm in blue (StepFunction1); with a 1 mm maximum allowed step in red (StepLimiter). The left scale corresponds to the step limit and the right scale corresponds to the normalized dose of the proton beam in dark (Dose). 170 171
172
173 174 175 176 177
Instead of limiting the step, one can also integrate the mean cross-section and the mean energy loss along the step, so that equation (2) becomes equation (4): Z step
dE .dx (4) dx This solution enables to sample the exact cross-section and mean energy loss via a MC technique [11]. This function is used when the Eloss ratio is larger than the user-defined E linear loss limit [17], with Eloss and E the particle continuous energy loss and particle kinetic energy. A low threshold can lead to a significant calculation time increase. Differences between GEANT4.9.2 default options and Opt3 are summarized in Table 1. ContinuousEnergyLoss =
GEANT4 settings for proton-therapy applications
Default values e /e Proton GenericIon 1 mm 1 mm 1 mm 0.1 mm 0.2 0.2 0.1 7 7 7 0.01 0.01 0.15 safety minimal minimal GEANT4 Opt3 − + e /e Proton GenericIon 0.1 mm 0.05 mm 0.02 mm 20 20 20 distanceToBoundary −
range cut stepping function - finalRange stepping function - dRoverRange binning (bins/decade) linear loss limit stepping algorithm
stepping function - finalRange binning (bins/decade) stepping algorithm
7
+
Table 1. Summary of the GEANT4.9.2 default and Opt3 parameters.
178
3. Influence of GEANT4 settings on dose computing
185
The first objective of our study was to understand the influence of the different parameters and functions on proton dose simulation, with a focus on the proton range, the simulation time and the dose fluctuations. For all simulations, the geometry was a single volume of water. Proton ranges were defined as the position of 80% of the maximum dose in the distal fall-off region of the Bragg peak. We evaluated the simulation times by comparing the proton source rate (in protons·s−1 ) for different configurations.
186
3.1. Influence of the range cut and maximum allowed step values
179 180 181 182 183 184
187 188 189 190 191 192 193 194 195 196 197 198 199 200
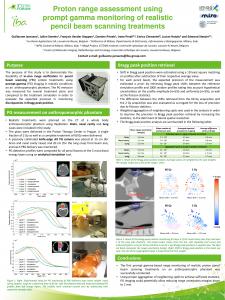
A 230 MeV mono-energetic proton beam was simulated in a 60×60×60 cm3 water tank and the depth-dose profiles were integrated along the z axis with a 1 mm step. For a 230 MeV proton beam, the NIST [18] CSDA range is 329.4 mm, while the GEANT4 ranges vary from 329.4 mm for a 1 µm range cut to 334.9 mm for a 0.1 mm range cut without fixed step limitation. Results are presented in Figure 2. Simulations were performed for different range cut values between 1 µm and 1 mm, using different maximum allowed step values, while other parameters were set to default values. The proton range converges towards the NIST range when the range cut value decreases. This is observed without step limitation, but introducing such a constraint brings more consistency in the convergence. Indeed, since the step size is related to the range cut value, the range convergence observed for decreasing range cut values is in fact indirectly due to step size limitation. The relationship between the two parameters has been checked by varying the maximum allowed step for different range cut values. Not surprisingly, the increased accuracy at very low range cut yields a significant
GEANT4 settings for proton-therapy applications
8
(a)
(b) NoStepLimiter Step 0.1 mm Step 0.001 mm
Proton rate (protons/s)
Range (mm)
NIST(CSDA approximation) NoStepLimiter Step2mm Step1mm Step0.1mm 334 333 332 331 330 329 328 0.001
0.01
0.1
1
Step 1mm Step 0.01 mm
1000.00 100.00 10.00 1.00 0.10 0.001
0.01
0.1
Cut (mm)
Cut (mm)
Figure 2. This figure illustrates the influence of the range cut value on the range of 230 MeV protons in water (a) and simulation time (b) for different maximum allowed step values. Ranges are compared to the NIST reference value and converge to the right range for sufficiently low range cut and step. Low range cut and step values decrease the proton rate drastically.
214
simulation time increase, as also presented in [4] for carbon ions. The simulation time increase was also related to the step size limitation associated with decreasing range cut value. Consequently, both the proton range and the computation time are strongly related to the step size, while the similar effects observed with low range cut values are mainly due to the step shortening effect. Part of the time increase is also due to the electron tracking process, which increases with low range cut values. The influence of the range cut and hence indirectly of the step limitation on dose computing artifacts is presented in Figure 3. No fixed step limitation was used. When the range cut is sufficiently low, fluctuations become negligible. The worst case occurs with a range cut value of 0.1 mm (highest fluctuations and range shift). Ideally, the range cut value should neither affect the proton range, nor the dose fluctuations. In theory, the electron range cut should only define the accuracy of the electronic dose distribution in the medium. The fluctuations observed are due to wrong data sampling, as presented in section 3.2.
215
3.2. Influence of the pre-calculated table binning
201 202 203 204 205 206 207 208 209 210 211 212 213
216 217 218 219 220 221
In a second stage, the influence of the binning parameter on the dose deposition for several simulations initialized between 7 bins/decade and 50 bins/decade was examined. We set the binning energy range between 100 eV and 1 GeV to decrease the total number of bins. The range cut was set to 0.1 mm, without limiting the step, which was the worst case observed previously (section 3.1). Dose calculation errors were evaluated using equation (5): N 1 X |di − drefi | ²= N i=1 drefi
Ã
222
!
(5)
1
GEANT4 settings for proton-therapy applications
9
(a)
(b)
cut 1mm
cut 10µm
cut 0.1mm
dE/dx (MeV/mm/proton)
dE/dx (MeV/mm/proton)
cut 1µm
2
2
1.5
1
0.5
0 0
100
200
Depth in water (mm)
300
1.5
1
0.5
0 0
100
200
Depth in water (mm)
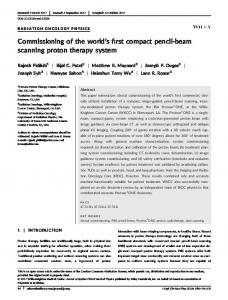
Figure 3. Influence of the range cut threshold and hence of the step size on dose computing of 230 MeV protons in water. When a sufficiently low range cut is used, the proton range becomes stable and the dose fluctuations negligible. Influence of high range cuts is presented in figure (a) and low range cut in figure (b).
223 224 225 226 227 228 229 230 231 232 233 234 235 236 237 238 239 240 241 242 243 244 245 246 247
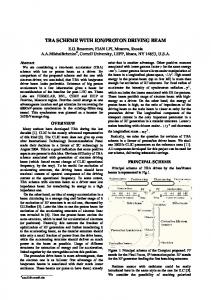
where ² is the mean point-to-point error calculated, i corresponds to a given curve point, N is the number of points in a curve, di is the dose computed and drefi is the dose computed for the reference simulation. Errors were calculated between 0 and the Bragg peak range (²80 ) to discard Bragg peak tail errors. The influence of EM table binning on dose computing is presented in Figure 4 (a) and (b). Fluctuations decreased as the number of bins per decade increased. Based on this result, the 50 bins/decade simulation was considered as the reference. 3×10⁵ protons were simulated, leading to a statistical uncertainty around 0.5% from the water tank entrance up to the Bragg-peak distal fall-off. Above 15 bins/decade, the fluctuations became irrelevant, meaning that the 20 bins/decade resolution recommended by the GEANT4 Electromagnetic Standard working group is sufficient. The number of bins increases slightly the initialization time, but this is negligible even with a large number of materials (the initialization time was respectively 3 and 3.5 minutes with 7 and 20 bins/decade, for 1000 materials). Then, the influence of the previously studied parameters (range cut and step size) was assessed by comparing dose deposits in the reference simulation described above and in the same simulation with a 1 µm range cut (Figure 4 (c)). No significant difference was observed. Finally, we checked the influence of the Opt3 (Figure 4 (d)). Results are summarized in Table 2. If few bins are set, the tables do not accurately describe EM processes. Hence, the interpolated cross-sections are wrong, leading to incorrect step and continuous energy loss sampling. When limiting the step, the dose deposit along the ion track is more frequent, limitting the propagation of inaccurate data sampling to the maximum step size allowed. When a sufficient number of bins is set, the proton range and dose
300
GEANT4 settings for proton-therapy applications
10
(a)
(b) 15 bins/decade
20 bins/decade
2
1.5
1
0.5
0
1.5
1
0.5
0 0
100
200
300
0
Depth in water (mm)
100
200
300
Depth in water (mm)
(c)
(d)
cut 1µm
ref
Opt3
ref
2
dE/dx (MeV/mm/proton)
2
dE/dx (MeV/mm/proton)
50 bins/decade
2
dE/dx (MeV/mm/proton)
dE/dx (MeV/mm/proton)
7 bins/decade 10 bins/decade
1.5
1
0.5
0
1.5
1
0.5
0 0
100
200
300
Depth in water (mm)
0
100
200
Depth in water (mm)
Figure 4. Figure (a) and (b) show the influence of the binning parameters on dose computing with a range cut of 0.1 mm and no step limitation. When a sufficient number of bins is set, the proton range becomes stable and the dose fluctuations negligible. The influence of a 1 µm range cut (c) and GEANT4 Opt3 (d) on a simulation using 50 bins/decade is also presented.
Bins/decade ²80 (%) Range (mm)
7 4.8 331.9
10 1.7 326.6
15 0.7 325.1
20 20 (Opt3) 0.7 0.5 324.8 325.2
50 (range cut 1µm) 0.5 324.7
50 (ref) 325.0
Table 2. Influence of the number of bins used to initialize the pre-calculated EM tables on dose computation and proton range. Above 15 bins/decade, simulations lie within 0.3 mm in range and 0.7% of ²80 errors with the reference. The use of a 1 µm range cut and Opt3 did not affect the simulations.
300
GEANT4 settings for proton-therapy applications
11
255
fluctuations are independent of the range cut and step parameters. Consequently, the range cut parameter can be used at it should, i.e. to define the accuracy of the electronic dose distribution along the ion track. For safety, it makes sense to set the range cut and maximum allowed step equal or lower to the voxel size, around 1 mm for clinical applications. The Opt3 parameters-list did not modify the results, however, the simulation was performed using a simple homogeneous geometry and both the stepping function and stepping algorithm may play a role in heterogeneous and voxelized media like patient CT data.
256
3.3. Efficiency-based parameter selection
248 249 250 251 252 253 254
257 258 259
260 261
As regards the previous investigations and in view of the clinical implementation of dose calculation, simulation efficiencies were compared between the four different simulation settings presented below: (i) 50 bins/decade, range cut and maximum allowed step at 1 mm. (ii) 50 bins/decade, range cut and maximum allowed step at 0.1 mm.
262
(iii) 50 bins/decade, range cut at 1 µm.
263
(iv) 50 bins/decade, range cut and maximum allowed step at 1 mm, Opt3.
264 265 266 267
268
269 270
The simulation efficiency (η) was calculated using equation (6), as defined in [19], taking into account the simulation time (T) and statistical uncertainty (σ). The simulation statistical uncertainty (σ) was defined as the mean dose uncertainty between the entrance and the proton range. 1 (6) η= 2 σ .T Simulations were performed on a single 1.66 GHz CPU. Results are summarized in Table 3. Simulation index i Statistical uncertainty (%) 1.3 Time (s) 1.4×10² Efficiency 4.2×101
ii 1.2 1.2×10³ 5.9
iii 1.2 5.4×10⁴ 1×10⁻¹
iv 1.2 1.5×10² 4.3×101
Table 3. Simulation efficiency for four different settings.
271 272 273 274
Settings (i) and (iv) had a comparable efficiency, while settings (ii) and (iii) were respectively about 7 and 430 times lower. In settings (iv), Opt3 parameters were added to settings (i) and could only increase the simulation accuracy. Hence, settings (iv) were selected as the reference parameters-list, in order to perform robust and fast simulations.
GEANT4 settings for proton-therapy applications 275
12
3.4. Ionization potential of water
288
The proton range depends mainly on the mean ionization potential (I) of the medium. The I value of water is a subject of growing interest and values between 67.2 eV and 85 eV were reported in Table 1 from [20]. A recent study has also evidenced the uncertainty related to the I values of human tissues, stating that this could lead to the use of ”sub-centimeter“ clinical margins [21]. When the ionization potential of a medium is not known, Bragg’s additivity rule is used to compute the I value, by weighting the I values of the different constituents. In GEANT4, the ionization potential is calculated following Bragg’s additivity rule by default for all user-defined media and is 70.9 eV for water, however, the user has the possibility of changing this value. We tested different values of I: 70.9 eV, 75 eV and 80 eV, which moved the proton range respectively to 324.9 mm, 329.2 and 330.8 mm, while the CSDA range given by NIST is 329.4 mm. We then set the ionization potential of water to 75 eV, which is the value recommended by ICRU reports 37 and 49 [22, 23].
289
4. GEANT4 comparison with PHITS and MCNPX
278 279 280 281 282 283 284 285 286 287
290 291 292 293 294 295 296 297 298 299
Simulation time, depth-dose profiles and transverse profiles at 10 cm, 30 cm and 32 cm depth simulated with GEANT4, were compared to PHITS and MCNPX for a 230 MeV proton beam, using a circular Gaussian spot of 3 mm sigma. We also assessed the impact of MS on the lateral dose spreading compared to the SS algorithm implemented in GEANT4. Depth-dose profiles were integrated along the z axis with a 1 mm step and transverse profiles were scored in dosels (dose scoring voxels [24]) of 2×2×1 mm3 , respectively in x, y and z (the beam direction). Default parameters were used for PHITS and MCNPX, using a MS model and the ATIMA cross-section database for PHITS. Transverse profiles were normalized to the maximum dose, in order to better visualize the different dose spreading (Figure 5). (a) MCNPX
(b) PHITS
GEANT4 (MS) GEANT4 (SS)
GEANT4
2
MCNPX PHITS
1
Normalized dose (A.U.)
277
dE/dx (MeV/mm/proton)
276
1.5
1
0.5
0.8 0.6 0.4 0.2 0
0 0
100
200
Depth in water (mm)
300
-20
-10
0
10
Lateral position (mm)
Figure 5. Comparison of depth-dose and transverse profiles at 30 cm depth using GEANT4, MCNPX and PHITS, for a 230 MeV proton beam in water.
20
GEANT4 settings for proton-therapy applications 300 301 302 303 304 305 306 307 308 309 310 311 312 313
13
As regards depth-dose profiles, MCNPX and PHITS are in close agreement. Differences in the plateau and in the Bragg peak regions compared to GEANT4 may be explained by different HAD and EM models. A detailed investigation of these differences is out of the scope of this paper, but it is worthwile to note that the integral energy deposited by a 230 MeV mon-energetic proton beam between 0 and 40 cm is in average 215.5 MeV/proton with GEANT4, 204.7 MeV/proton with PHITS and 205.6 MeV/proton with MCNPX. The integral dose deposited by GEANT4 is 5% higher than PHITS and 4% higher than MCNPX. As regards transverse profiles, the proton beam spreading with depth in GEANT4 is narrower than in MCNPX and PHITS. Dose spreading was also estimated thanks to an analytical formula based on measurements using equation (4) from [25]. The dose spreading simulated with GEANT4 using the MS model was unable to reproduce the SS behavior (8% difference), which gave results close to the PHITS code. Results are presented in Table 4.
σ10cm σ30cm σ32cm
GEANT4 (MS) (mm) 3.1 (mm) 6.2 (mm) 6.9
GEANT4 (SS) 3.2 6.8 7.5
MCNPX 3.1 7.3 8.1
PHITS 3.4 6.8 7.5
Szymanowski 3.2 7.1 7.8
Table 4. Comparison of the transverse profile spreading (σ) at 10 cm, 30 cm and 32 cm depth for a 230 MeV proton beam in water using the GEANT4 MS algorithm, GEANT4 SS algorithm, MCNPX, PHITS and an analytical model (Szymanowski). The uncertainty on the σ values was estimated to 0.15 mm using ROOT. GEANT4 beam spreading is significantely lower than in MCNPX, PHITS and Szymanowski’s model, even if it gets close to PHITS results using the SS algorithm. MCNPX shows the wider beam spreading.
314 315 316 317 318 319 320 321 322 323 324 325 326 327 328
The comparisons between the different MC codes and Szymanowski’s analytical model showed inconsistencies, with up to 15% difference (2.8 mm in FWHM) in the lateral dose spreading simulated with GEANT4 and with MCNPX, at 32 cm depth in water. Using SS instead of MS multiplies the number of steps and the simulation time by three order of magnitude (330 steps per incident proton were recorded using the MS model and more than 700×103 with the SS). The same simulations were performed without the proton MS process and almost no beam spreading was observed, suggesting that proton scattering is mainly due to the MS process, even if HAD collisions may affect the profiles. As the computation of the spatial displacement is not part of the MS theories, each MC code has to develop its own algorithm [12], which may explain part of these discrespancies. Our first conclusion is that the proton MS process used in GEANT4.9.2 should be revised. As regards computation time, MCNPX and PHITS proton rates were respectively estimated to 127 and 29 protons·s−1 on a single 3.06 GHz CPU, using detailed simulation settings. On a comparable machine with a 2.33 GHz CPU, the GATE/GEANT4 proton
GEANT4 settings for proton-therapy applications
14
331
rate was estimated to 263 protons·s−1 using optimized settings. These simulation times have only an indicative purpose, since the simulations were performed on different machines, using different MC parameters.
332
5. Experimental measurements
329 330
333 334 335 336 337
338
339 340 341 342 343 344 345 346
Measurements were performed in Essen in Germany, with the new IBA PBS dedicated nozzle mounted on a rotating gantry. This nozzle allows for delivering circular spots of a few millimeters in diameter at the treatment isocenter. The Water Equivalent Thickness (WET) of the different media within the nozzle were estimated using equation (7). The resulting Nozzle water Equivalent Thickness (NET) was estimated to 1.7 mm. ρm Sm × (7) ρw Sw where the index m stand for medium and w for water. S and ρ are respectively the mass stopping powers (in MeV.cm2 .g−1 ) and densities (in g.cm−3 ). WETm is the medium WET (in cm) and L its thickness (in cm). The Energy Selection System (ESS) is designed to provide one given beam of range RESS and energy EESS at the nozzle entrance. The corresponding range RN oz and energy EN oz at the nozzle output were therefore obtained by subtracting the NET. The RESS and RN oz given correspond to ranges in water. Range to energy conversion was determined with a fit from the NIST PSTAR database [18]. W ETm = L ×
(a)
(b)
Figure 6. Illustration of the measurement set-up of depth-dose profiles in water (a) and transverse profiles in PMMA (b). Figure (a) shows the nozzle (1), the proton beam direction (2) and the water phantom (3), with the reference Bragg-peak chamber (a), the sensitive Bragg-peak chamber (c) and the phantom entrance wall (b). Figure (b) presents the transverse profile set-up of the 98.71 MeV proton beam, with 4 radiochromic films (in blue) inserted between the PMMA slabs (3).
GEANT4 settings for proton-therapy applications 347
348 349 350 351 352 353 354 355
15
5.1. Reference pristine Bragg peak in water Reference pristine Bragg peaks were measured in a 60×60×60 cm3 water phantom R , IBA-Dosimetry) for 5 energies, as presented in Table 5. Two large (Blue Phantom° Bragg peak chambers (PTW type 34070) with a 10.5 cm2 sensitive area were used, so that the proton beams were always fully integrated within the sensitive volume of the chamber (Figure 6 (a)). The first chamber was placed at the phantom entrance and used as a reference chamber to eliminate beam fluctuations. The second chamber was placed in the phantom and moved along the z axis with a 1 mm increment. Measured depth-dose profiles were shifted by 44.1 mm to account for the total set-up. RESS (g/cm2 ) 7.72 13.50 19.50 26.50 32.54
EESS (MeV) 99.95 137.72 169.48 202.51 228.35
RN oz (g/cm2 ) 7.55 13.33 19.33 26.33 32.37
EN oz Measured ranges (MeV) (cm) 98.71 7.78 136.21 13.59 168.63 19.55 201.75 26.44 227.65 32.50
Table 5. Pristine Bragg peak measured for 5 energies. The settings at the nozzle exit (RN oz and EN oz ) were estimated from the nozzle entrance parameters (RESS and EESS ) and then measured in water (Measured ranges). Problems with nozzle calibration at the time of the measurements explain the discrepancies between set ranges and measured ranges.
356
357 358 359 360 361 362 363 364 365 366 367 368 369
5.2. Reference transverse profiles in PMMA R Reference transverse profiles were measured with ISP self-developing EBT Gafchromic° films inserted between uncalibrated PMMA slabs of 1 cm thickness (Figure 6 (b)) and 1.19 g.cm−3 density. The exact positions of the films between the slabs were recorded. Transverse profiles were measured for 3 different energies, with 4 or 5 films inserted between the slabs as summarized in Table 6. The film optical densities (OD) were recorded using a Vidar scanner. For each film, the mean OD of a non-irradiated film, considered as the background, was subtracted before normalization to the maximum OD. Transverse profiles were measured with a grid resolution of 1×1 mm2 , to mimick the simulated matrix of dosels. At the time of the measurements, only a preliminary version of the PBS system was available and the monitor units were not yet available. Therefore, it was not possible to perform a calibration curve between the film OD and doses. These preliminary measurements were used only qualitatively to illustrate the beam widening increase with depth.
GEANT4 settings for proton-therapy applications EN oz (MeV) 98.71 153.01 210.56
RN oz PMMA range 2 (g/cm ) (g/cm2 ) 7.55 7.74 16.33 16.77 28.33 29.13
Pos 1 (mm) 0 0 0
16 Pos 2 (mm) 19 50 88
Pos 3 (mm) 49 99 186
Pos 4 (mm) 59 128 216
Pos 5 (mm) 226
Table 6. Positions of the transverse profiles measured with EBT radiochromic films inserted in a PMMA phantom. Four films were used at the lowest and medium energies and five at the highest energy.
370
6. GEANT4 comparison with measurements
371
6.1. Depth-dose in water
394
The evaluation of depth-dose profile simulations was based on three criteria: the proton range, the peak dose error and the mean point-to-point dose error. Simulated and measured depth-dose profiles were normalized to the integral dose deposited. There was a discrepancy between measured ranges and system ranges, because the nozzle had not been yet properly calibrated at the time of the measurements: the energies were slightly higher than the set values, leading to measured ranges increased by 1.1 to 2.6 mm (Table 5). To further assess the dose deposited, we shifted the measurements to compensate for the range difference with the simulations. Then, we adjusted the energy spread of the incident beams in the simulation for the five energies to match the measurements as closely as possible. The tuning stage of the energy spread was done with an energy step of 0.05-0.1 % of the mean energy. The energy spread was adjusted according to two criteria: the peak dose error and the mean point-to-point dose error (²80 ) calculated using equation (5). Results obtained at the lowest and highest energies are presented in Figure 7. 105 protons were simulated. Lower peak dose errors were associated with lower mean point-to-point dose errors, as presented for EN oz = 168.63 MeV in Figure 8. Simulated ranges lie within 0.3 mm of set ranges. Peak dose errors and mean point-topoint dose erros are around 1 %. Results are summarized in Table 7. The dose statistical uncertainty was around 0.8% in the plateau region, around 0.4% in the Bragg peak region and around 12% in the tail. Consequently, these results were in good agreements with measurements. For absolute dosimetry using plane-parallel chambers, the standard dose uncertainty for clinical proton beams was estimated to 2.3% in [26] .
395
6.2. Transverse dose profiles in PMMA
372 373 374 375 376 377 378 379 380 381 382 383 384 385 386 387 388 389 390 391 392 393
396 397 398
The simulation of the lateral dose spreading with depth of single pencil beams was assessed against measurements at 3 energies (98.71 MeV, 153.01 MeV and 210.56 MeV) using radiochromic films. The beam energy parameters were determined from the
GEANT4 settings for proton-therapy applications
17
(a)
(b) measurement
simulation error
2% 1%
0.6
0% 0.4
-1% -2%
0.2
-3% 0 20
40
60
4%
1
3% 0.8
2% 1%
0.6
0% 0.4
-1% -2%
0.2
-3%
-4% 0
measurement
0
80
-4% 0
100
Depth in water (mm)
200
300
Depth in water (mm)
Figure 7. Comparison between measured and simulated depth-dose profiles in water for the highest and lowest energies, respectively 227.65 MeV (b) and 98.71 MeV (a). The left and right axis correspond respectively to normalized doses and point-to-point errors. This figure shows that the simulations overestimate the dose deposit in the plateau entrance and underestimate the dose deposit in the Bragg peak region. Peak error
Mean dose error
6.0% 5.0% 4.0% 3.0% 2.0% 1.0% 0.0% -1.0% -2.0% -3.0% 0.30%
0.40%
0.50%
0.60%
Energy spread (%) Figure 8. Tuning of the 168.63 MeV proton beam, by adjusting the energy spread of the simulation. The lowest peak error and ²80 error (referred to as ”Mean dose error“ in the figure key) correspond to a sigma energy spread of 0.5% of the mean energy.
RN oz (g/cm2 ) 32.37 26.33 19.33 13.33 7.55
EN oz σE simulation ²80 (MeV) (%) (%) 227.65 0.10 1,1 201.75 0.30 0.9 168.63 0.50 0.8 136.21 0.55 1.2 98.71 0.60 1.2
²peak (%) 1,1 0,4 0.4 -0.8 0.4
RSimu (cm) 32.35 26.33 19.33 13.31 7.52
Table 7. Assessment of depth dose profiles in water, in terms of peak dose error (²peak ), mean point-to-point dose error (²80 ) and range accuracy. The energy spread (σE in %) adjusted in the simulations, increased with decreasing energy within a 0.1-0.6%.
Error (%)
0.8
Error (%)
3%
Normalized dose (A.U.)
4%
1
Error (%)
Normalized dose (A.U.)
simulation error
GEANT4 settings for proton-therapy applications 399 400 401 402 403 404
405
406 407 408 409 410 411 412 413 414 415 416 417 418 419 420 421 422 423 424 425 426 427 428 429 430 431 432 433 434 435 436 437 438 439
18
previous depth-dose profile simulations. The dose response mechanism of radiochromic films is not linear with dose and depends on the particle Linear Energy Transfer (LET) [27, 28]. Radiochromic films show a significant under-response in the Bragg-peak region, because of quenching effects due to high-LET particles [27, 28]. The radiochromic film dose response has been modeled following a logarithmic relation in [27], as shown in equation (8): ODnet (Def f ) = log(a0 .Def f + 1)
(8)
with a0 the film response parameter, ODnet (Def f ) the net optical density after irradiation with an effective dose Def f , which depends on the particle LET and dose deposit D. For low LET, Def f ' D. As the LET increases, Def f becomes lower than D, illustrating the film under-response. The particle LET increases as its remaining range decreases with penetration in water. Hence, for depth-dose profile measurements, the film response dependence on LET has to be accounted for. Since our measurements were transverse to the beam direction, the LET lateral variations were neglected in first approximation for relative dosimetry in a given film: we assumed a homogeneous transverse LET spectrum at a given depth. Further simulations showed that the mean proton energy was slightly higher in the centre of the profiles compared to the sides, with increasing depth in PMMA, while being the same at the phantom entrance. This suggests a possible underestimation of the measured FWHM with depth, due to the transversal LET distributions. However, it has been stated in [29], that radiographic films and diodes, which are detectors also sensitive to the energy spectrum of the protons, can be safely used to measure distributions perpendicular to the proton beam direction. We compared the film OD FWHM (FWHMOD ) increase to the simulated transverse dose profile FWHM (FWHMsimu ) increase with depth. A Gaussian fit on the radiochromic film OD measured at the beam entrance was performed using the ROOT software [30] for the 3 energies. The spot FWHM in the x and y directions were then used as input parameters in the simulations, so that FWHMsimu =FWHMOD at the phantom entrance. The measured spot widths (sigma in OD) were between 3 and 6 mm depending on the energy. The uncertainty of radiochromic film measurements was estimated to 5% for MD-55-2 films in [31]. The FWHM uncertainty on the fitted measurements was estimated to 0.1 mm using ROOT. Assuming FWHMdose the true dose FWHM, it follows from the logarithmic relationship between OD and dose (equation (8)), that for a fixed FWHMdose , the FWHMOD decreases as the dose decreases(Figure 9 (b)). Hence, the true dose spreading increase with depth should be even higher than the ”OD spreading“ increase with depth, because the dose at the beam axis decreases with depth (contrary to the integral dose), as illustrated in Figure 9 (a). Results obtained using GEANT4 for x profiles with EN oz = 210.56 MeV at 3 different depths are presented in Figure 10. Similar results were obtained for the 2 simu ratio at different depths for x and y profiles for the 3 other energies. The FFWWHM HMOD
GEANT4 settings for proton-therapy applications
19
(a)
(b)
20
1.6
15
1.4
10
1.2
5
1
0
0.8
-5
0.6
-10
0.4
-15
0.2
-20 0
0
50
100
150
200 250 Depth in PMMA (mm)
FWHM_OD (a=1) FWHM_Dose
FWHM_OD (a=0.1)
4.4 4.2
FWHM (mm)
Y lateral position (mm)
Lateral dose spreading with depth
4 3.8 3.6 3.4 3.2 3 2.8 0
1
2
3
4
5
6
7
8
9
Dose (Gy)
Figure 9. (a) Simulated dose spreading with depth in PMMA of a 211 MeV proton beam, with a circular spot of 3 mm sigma. While the integral depth dose increases continuously with depth, the depth dose at the beam axis decreases with depth with a factor around 2 between the entrance and the Bragg peak and increases again within the last 2 cm. (b) Illustration of the FWHMOD increase with increasing dose, compared to a constant FWHMdose of 3 mm, with a maximum dose varying between 1 Gy and 8 Gy, for 2 different film parameters: a = 1 and a = 0.1, using equation (8).
(a)
(b)
Phantom entrance
measurement
1 0.8 0.6 0.4 0.2 0
226 mm depth in PMMA
simulation
measurement
Normalized dose (A.U.)
simulation
Normalized dose (A.U.)
Normalized dose (A.U.)
measurement
(c)
186 mm depth in PMMA 1 0.8 0.6 0.4 0.2 0
-2
-1
0
Lateral position (mm)
1
2
simulation
1 0.8 0.6 0.4 0.2 0
-2
-1
0
Lateral position (mm)
1
2
-2
-1
0
1
Lateral position (mm)
Figure 10. Comparison between simulated transverse dose profiles and measured transverse OD profiles in PMMA, for a 210.56 MeV proton beam at three depths: 0 mm, 186 mm and 226 mm. It shows that the beam spreading with depth is not sufficiently accounted for in the simulation.
440 441 442 443 444 445 446 447
energies are presented in Figure 11 and illustrates the lack of dose spreading with depth of the GEANT4 MC code compared to measurements. It is important to notice, that the previous discussions about the film LET and dose response dependences suggested that the qualitative measurements presented, also under-estimate the true lateral dose spreading with depth. This study corroborates the fact that the MS model implemented in GEANT4.9.2 release underestimates the lateral dose spreading with depth, even though further comparisons with quantitative measurements are required to fix the dose spreading accuracy achievable by MC simulation.
2
GEANT4 settings for proton-therapy applications
20
(Simulation/Measurement)
FWHM ratio (%)
210.6 MeV X 153 MeV X 98.7 MeV X
210.6 MeV Y 153 MeV Y 98.7 MeV Y
100% 95% 90% 85% 80% 75% 0
50
100
150
200
250
Depth in PMMA (mm)
Figure 11. This figure illustrates the lack of lateral dose spreading with depth compared to measurements in PMMA, using the GEANT4 MS model. Comparisons are shown at 3 energies (210.56 MeV, 153.01 MeV, 98.71 MeV) in 2 lateral directions (x and y).
448
449 450 451 452 453 454 455 456 457 458 459 460 461 462 463 464 465 466 467 468 469 470 471
7. Conclusion This study applied to proton PBS simulations aimed at better understanding the settings of the GEANT4.9.2 MC code. Two major simulation parameters are the maximum step size and the range cut, which should be defined in accordance with the voxel size. Another key parameter is the binning of the EM tables, which needs to be set high enough (> 15 bins/decade) to ensure accurate interactions, independently of the range cut and maximum allowed step values. An optimized parameters-list has been proposed in order to perform robust and efficient simulations, that are competitive in terms of simulation time with other MC codes like MCNPX and PHITS. A reference physicslist for proton-therapy has been presented, using the EM standard package combined with the precompound model for inelastic HAD collisions. The ionization potential of water was set to 75 eV, in accordance with ICRU reports 37 and 49. Depthdose profile simulations were in satisfactory agreement with reference measurements performed in water, with 0.3 mm range accuracy. Peak errors were less than 1.1% and mean point-to-point errors (²80 ) were around 1%. Inconsistencies were pointed out for transverse profile simulations using different MC codes, with up to 15% of dose spreading difference between GEANT4 and MCNPX at 32 cm depth in water. Transverse dose profile simulation issues using GEANT4 were attributed to the MS algorithm, which was not able to reproduce the SS dose spreading with depth. Further comparisons against measurements in PMMA corroborated these results, showing that the lateral dose spreading with depth is not sufficiently accounted for in the simulation. The MS algorithm accuracy is currently the limiting factor for PBS simulations, since the dose spreading of each single beam is very important for patient dose calculation. Improvements of the MS algorithm are expected with the new GEANT4.9.3 release,
GEANT4 settings for proton-therapy applications
21
475
which is being evaluated. Investigations using quantitative measurements are necessary to fully estimate the lateral dose spreading accuracy achievable by MC simulation. Further studies investigating the effects of patient heterogeneities, using a MC pencil beam model of the new IBA PBS dedicated system and TPS comparisons will follow.
476
Acknowledgments
472 473 474
477 478 479 480 481
This work was conducted in a collaboration between the IBA company and the Creatis laboratory. The research leading to these results has received funding from the [European Community’s] Seventh Framework Programme [FP7/2007-2013] under grant agreement n◦ 215840-2. We also acknowledge the GEANT4 collaboration, especially Vladimir Ivantchenko for fruitful discussions.
482 483 484 485 486 487 488 489 490 491 492 493 494 495 496 497 498 499 500 501 502 503 504 505 506 507 508 509 510 511 512 513 514 515 516 517 518
[1] U. Amaldi and G. Kraft. Radiotherapy with beams of carbon ions. Rep. Prog. Phys., 68:1861– 1882, 2005. [2] H. Paganetti, H. Jiang, K. Parodi, R. Slopsema, and M. Engelsman. Clinical implementation of full monte carlo dose calculation in proton beam therapy. Phys Med Biol, 53(17):4825–4853, Sep 2008. [3] S. Jan et al. Gate: a simulation toolkit for pet and spect. Phys Med Biol, 49(19):4543–4561, Oct 2004. [4] N. Zahra, T. Frisson, L. Grevillot, P. Lautesse, and David Sarrut. Influence of Geant4 parameters on dose distribution and computation time for carbon ion therapy simulation. Physica Medica (2010), doi:10.1016/j.emp.2009.12.001. [5] D. B. Pelowitz et al. MCNPXTM User’s Manual. LA-CP-05-0369 (2005). [6] K. Niita et al. PHITS – a Particle and Heavy Ion Transport Code System. Radiat. Meas. 41, 1080 (2006). [7] Geant4 Electromagnetic Standard Working Group. http://www.geant4.org/geant4/collaboration/ working groups/electromagnetic/physlist.shtml. [8] C. Zacharatou Jarlskog and H. Paganetti. Physics Settings for Using the Geant4 Toolkit in Proton Therapy. IEEE, 55(3):1018–1024, June 2008. [9] J.P. Wellisch. Geant4 hadronic physics status and validation for large HEP detectors. Computing in High Energy and Nuclear Physics, La Jolla, California, March 24-28, March 2003. [10] L Sihver, D Matthi¨ a, T koi, and D Mancusi. Dose calculations at high altitudes and in deep space with GEANT4 using BIC and JQMD models for nucleus–nucleus reactions. New Journal of Physics, June 2008. [11] J. Apostolakis, M. Asai, A.G. Bogdanov, H. Burkhardt, G. Cosmo, S. Elles, G. Folger, V.M. Grichine, P. Gumplinger, A. Heikkinen, I. Hrivnacova, V.N. Ivantchenko, J. Jacquemier, T. Koi, R.P. Kokoulin, M. Kossov, H. Kurashige, I. McLaren, O. Link, M. Maire, W. Pokorski, T. Sasaki, N. Starkov, L. Urban, and D.H. Wright. Geometry and physics of the geant4 toolkit for high and medium energy applications. Radiation Physics and Chemistry, 78(10):859 – 873, 2009. Workshop on Use of Monte Carlo Techniques for Design and Analysis of Radiation Detectors. [12] Geant4. Physics Reference Manual for Geant4. CERN. [13] S. W. Peterson, J. Polf, M. Bues, G. Ciangaru, L. Archambault, S. Beddar, and A. Smith. Experimental validation of a Monte Carlo proton therapy nozzle model incorporating magnetically steered protons. Phys Med Biol, 54(10):3217–3229, May 2009. [14] J. C. Polf, S. Peterson, M. McCleskey, B. T. Roeder, A. Spiridon, S. Beddar, and L. Trache. Measurement and calculation of characteristic prompt gamma ray spectra emitted during proton irradiation. Phys Med Biol, 54(22):N519–N527, Nov 2009. [15] N. Kanematsu. Alternative scattering power for gaussian beam model of heavy charged particles.
GEANT4 settings for proton-therapy applications 519 520 521
[16]
522 523
[17]
524 525
[18]
526 527
[19]
528 529 530 531
[20]
532 533 534
[21]
535 536 537
[22] [23]
538 539
[24]
540 541
[25]
542 543 544
[26]
545 546 547
[27]
548 549 550 551
[28]
552 553 554
[29]
555 556
[30]
557 558 559
[31]
22
Nuclear Instruments and Methods in Physics Research Section B: Beam Interactions with Materials and Atoms, 266(23):5056 – 5062, 2008. B. Gottschalk. On the scattering power of radiotherapy protons. Med. Phys. Volume 37(1):352367, January 2010. S. Agostinelli et al. Geant4-a simulation toolkit. Nuclear Instruments and Methods in Physics Research, 506:250–303, July 2003 2003. M.J. Berger, J.S. Coursey, M.A. Zucker, and J. Chang. Proton stopping power and ranges (PSTAR, NIST), http://physics.nist.gov/PhysRefData/Star/Text/PSTAR.html. Indrin J Chetty, Mihaela Rosu, Marc L Kessler, Benedick A Fraass, Randall K Ten Haken, FengMing Spring Kong, and Daniel L McShan. Reporting and analyzing statistical uncertainties in monte carlo-based treatment planning. Int J Radiat Oncol Biol Phys, 65(4):1249–1259, Jul 2006. J. Soltani-Nabipour, D. Sardari, and GH. Cata-Danil. Sensitivity of the Bragg peak curve to the average ionization potential of the stopping power. Rom. Journ. Phys., 54(3-4):321–330, August 2008. P. Andreo. On the clinical spatial resolution achievable with protons and heavier charged particle radiotherapy beams. Phys Med Biol, 54(11):N205–N215, Jun 2009. Bethesda. MD : ICRU Report 37 : Stopping Powers for Electrons and Positrons, 1984. Bethesda. MD : ICRU Report 49 : Stopping Powers and Ranges for Protons and Alpha Particles, 1993. David Sarrut and Laurent Guigues. Region-oriented CT image representation for reducing computing time of Monte Carlo simulations. Med Phys, 35(4):1452–1463, Apr 2008. H. Szymanowski, A. Mazal, C. Nauraye, S. Biensan, R. Ferrand, M. C. Murillo, S. Caneva, G. Gaboriaud, and J. C. Rosenwald. Experimental determination and verification of the parameters used in a proton pencil beam algorithm. Med Phys, 28(6):975–987, Jun 2001. IAEA 2004 Absorbed Dose Determination in External Beam Radiotherapy: An International Code of Practice for Dosimetry Based on Standards of Absorbed Dose to Water IAEA. TRS-398 (Vienna: IAEA). Technical report. T. Frisson, N. Zahra, P. Lautesse, and D. Sarrut. Monte-carlo based prediction of radiochromic film response for hadrontherapy dosimetry. Nuclear Instruments and Methods in Physics Research Section A: Accelerators, Spectrometers, Detectors and Associated Equipment, 606(3):749 – 754, 2009. D. Kirby, S. Green, H. Palmans, R. Hugtenburg, C. Wojnecki, and D. Parker. LET dependence of GafChromic films and an ion chamber in low-energy proton dosimetry. Phys Med Biol, 55(2):417–433, Jan 2010. PRESCRIBING, RECORDING, AND REPORTING PROTON-BEAM THERAPY: CONTENTS. JOURNAL OF THE ICRU, 7(2):NP–, 2007. F. Rademakers and R. Brun. Root: An object-oriented data analysis framework. Linux Journal, Issue 51, July, 1998. Radiation Therapy Committee Task Group No. 55, Radiochromic film dosimetry, AAPM Report No. 63, 1998. Technical report.