6th International & 27th All India Manufacturing Technology, Design and Research Conference (AIMTDR-2016), December 16-18, 2016 at College of Engineering., Pune, Maharashtra, INDIA.
OPTIMIZATION OF PLANT LAYOUT USING SIMULATION SOFTWARE Mr. Anurag A. Polshettiwar1, Mr. Divyesh P. Trivedi2, Mr. Vicky B. Sardar3, Dr. N R Rajhans4 1
[email protected],
[email protected],
[email protected], 4
[email protected] 1,2,3,4 Department
of Production Engineering and Industrial Management, College of Engineering, Pune, Maharashtra, India.
Abstract---Satpuda Engineering Pvt. Ltd. is mainly involved in the manufacturing of “Assembly suspension pedal component (BOLERO)” for Mahindra and Mahindra Ltd. Nasik, which is leading automotive vehicle manufacturing company. The manufacturing of Assembly suspension pedal component is done by using various press working operation, i.e., fabrication and bending. The type of production carried out is batch type production. The demand for component is not constant but keeps fluctuating as per the customer demand on monthly basis. The manufacturer wants to use effective utilization of resources so that they can increase the productivity. The research aims at simulating the existing layout, identifying the problems associated with it and generating optimum layout of the manufacturing facility.
patient transport trolleys, examination couches & tables, hospital furniture accessories etc. The manufacturing facilities include quality machinery by reputed machine tools manufacturers. To achieve desired output as stated earlier a detailed study of the process was conducted. After studying and scrutinizing various techniques available, computer simulation was selected to identify the optimum layout. Computer simulation has become a major tool for effectively portraying the working efficiency of any production system be it a continuous or a discrete production system. Its ability to simulate the stochastic and the dynamic properties of individual processes, and thus to predict their behavior over a user defined period makes it a more likable among the manufacturing and production companies.
Keywords- Simulation, Plant layout, Productivity.
Complex systems can be studied and their models can be prepared by using various statistical methods using this analytical tool of computer simulation [3]. By controlling certain sets of inputs, we can actually find the best suitable factor that can give us the optimum state of our production process. This is the principle of simulation optimization.
1. INTRODUCTION Satpuda Engineering Pvt. Ltd. manufactures precision components. The company develops many parts for industries mainly from the automobile and engineering sector in India. They are the vendors of leading automobile industries. Their core business lies in the development, production and distribution of high quality hospital furniture. The portfolio of products encompasses all hospital furniture categories viz. hospital beds,
1
6th International & 27th All India Manufacturing Technology, Design and Research Conference (AIMTDR-2016), December 16-18, 2016 at College of Engineering., Pune, Maharashtra, INDIA.
2. LITERATURE REVIEW
The objective of the paper was to determine the factor, which caused bottlenecks, unnecessary, material movement and unnecessary manufacturing and assembly leadtime. A plan consisting of studying the present production process in detail with respect to manufacturing, assembly and other important parameters and then simulating the manufacturing process to try to resolve all the bottlenecks from the manufacturing process and improve the productivity was decided.
Simulation software is one of the very useful tool adopted and implemented by manufacturing companies inorder to derive an optimum solution to their manufacturing problems and aim at higher returns from the process. Bronislav Chramcov [3] states that Simulation optimization is an extremely valuable technique for investigating the behavior of many business processes ranging from manufacturing layouts to the operation of modern contact centers, from the handling of patient influx into emergency departments to the processing of internet enquiries on a web site. He also stated some common application areas of discrete event simulation are service stations such as airports call centers and supermarkets road and rail traffic; industrial production lines and logistical operations like warehousing and distribution. With a simulation model, the creator simply sets up the correct real world rules at each stage where a real-world decision is made.
3. PROBLEM STATEMENT The manufacturing of Assembly suspension pedal component is done by using various press working operation, i.e., fabrication and bending. The type of production carried out is batch type production. The demand for component is not constant but keeps fluctuating as per the customer demand on monthly basis. The manufacturer wants to use effective utilization of resources so that they can increase the productivity. 4. METHODOLOGY The plant was visited for collecting the data. The manufacturing of this component is done by batch manufacturing process.
Roberto Revetria [4] suggested that the simulation model developed reproduces a widget production line, where different flows of parts and materials are managed. The objectives of the simulation model are to identify any criticalities in the system in order to validate a hypothetic plant layout considering a certain daily flow of materials, to dimension inter-operative and machine buffers and to evaluate the saturation coefficient of the different types of productive machines. The model allows formulating “What if” analysis in order to identify eventual bottlenecks on the system
A. PROCESS DESCRIPTION A batch of 40 pieces is normally carried out. The brake pedal is made by three parts; brake, push lever and metal pad. These three are welded together to form FBRAKE. Initially the brake is cut from a sheet of mild steel of thickness 8 mm on profile cutting machine. The batch of 40 is then sent to grinding machine. The burrs are removed in the grinding process. Then the drilling operation is carried out. Following the bending and welding shop.
The objective of the paper was to determine the factor, which caused bottlenecks, unnecessary, material movement and unnecessary manufacturing and assembly leadtime. The present production process was studied in detail with respect to manufacturing, assembly and other important parameters. Manufacturing process was simulated to try to resolve all the bottlenecks and improve the productivity.
The push lever is manufactured by following process. The raw material is of 3mm sheet of mild steel. A batch of 40 push levers is cut by using press machine. Then these send to grinding and drilling and finally to welding shop. The metal pad is manufactured by 3mm metal sheet by using shear machine. A batch of 40
2
6th International & 27th All India Manufacturing Technology, Design and Research Conference (AIMTDR-2016), December 16-18, 2016 at College of Engineering., Pune, Maharashtra, INDIA.
metal pads is send to bending machine to get his final shape and then send to welding shop. The FBRAKE is made by welding of one brake, one push lever and one metal pad. The welding is manually carried out. After the welding, the batch of 40 FBRAKE is sent to powder coating. After powder coating the FBRAKE is cleaned by drilling operation then the batch is sent to assembly by manual material handling. FFBRAKE is the final component. One FBRAKE, one rubber pad and one plastic bush is assembled together to get one final component. This is the current manufacturing process.
B. ANALYSIS OF DATA COLLECTED After a detail study and analysis of the process we analyzed the data from the point of view of our objectives. We would like to highlight the facts we came across during the study we conducted. There are a few constraints that are responsible for the increase in WIP and LEAD TIME to a great extent, which we shall describe in detail hence forth. The process study revealed the various constraints imposed by the manufacturing and assembly process. we seen that worker’s mostly time were consumed in material handling as the assembly work station is at first floor worker has to move material from ground floor to first floor and again at the delivery time first floor to ground floor. All material handling activity were carried out manually which lowers the productivity of workers. Hence we come to the conclusion that the bottlenecks in the process and excessive material handling are the major causes for high work in process and high manufacturing lead time and hence less productivity. C. INITIAL MODEL PREPARATION AND ANALYSIS A simulation model of the initial manufacturing process was built by using simulation software for modelling(Fig 2)in which it was found that the distance travelled by material is excessive and the WIP is more which leads to low productivity. The model was simulated for about 120 working hours which gives the statistics as shown in the table 2 and table 3. The numbered entered of push lever are 205,brake are 206,and the metal pad are 206. The welded FBRAKE was found to be 195 and the final assembled FFBRAKE are only 154 this is because of high WIP and high average WIP as seen in the table 3. The total material movement calculated from the table was found to be 2163 decimeter which is excessive as shown in table 1. It was concluded here that these are the major reasons for non productivity.
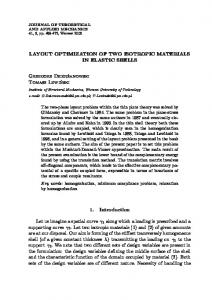
Fig 1. Generalise plant layout and material movement
3
6th International & 27th All India Manufacturing Technology, Design and Research Conference (AIMTDR-2016), December 16-18, 2016 at College of Engineering., Pune, Maharashtra, INDIA.
Fig 2. INITIAL MODEL Table 1 Path Distance Between Workstations(DM) Path P1
LT 80
WT 7200
TT 5683
Path P12
LT 96
WT 6025
TT 5932
P2
80
5850
5773
P13
64
6803
6741
P3
80
7200
5683
P14
30
6803
6774
P4
240
5930
5898
P15
147
6687
6544
P5
53
6025
5974
P16
80
6687
6609
P6
32
6047
6016
P17
298
7117
6830
P7
50
6803
6754
P18
99
6760
6664
P8
112
6047
5938
P19
84
7117
7036
P9
111
5858
5748
P20
102
7117
7018
P10
115
6025
5875
P21
83
6760
6680
P11
89
6025
Name Push Lever Brake Metal Pad Fbrake RubberPad FF Brake Plastic Bush
Profile Cutting Shear1 Grinding Drilling Bending Press1 Powder Coating Welding Drilling 2 Assembly
% Idle
% Busy
% Blocked
No of Opern
88.37
8.33
3.30
5
93.92 91.55 92.53 91.11 88.42
1.39 5.56 2.78 5.56 2.78
4.69 2.83 4.69 0 8.80
5 0 0 0 5
60
40
0
4
56.13 75.94 96.79
4.06 1.67 3.21
39.80 22.40 0
195 4 154
WIP
Time
205
0
160
45
2284
206
0
195
11
846
206
0
160
46
2382
195
0
60
35
1520
200
0
151
49
1454
154
154
0
0
0.03
200
0
151
49
1454
D.PROPOSED MODEL PREPARATION AND ANALYSIS As seen by the analysis of initial model process, the major areas of improvement are Use of group technology Reduction of excessive material movement Addition of machines It is further seen that the improvements in these areas will have a drastic effect on the reduction of the WIP and LEAD TIME. The small changes or improvements in these major causes will help To resolve the problem of WIP and LEAD TIME to a larger extent. With the help of the computer simulation following modifications were proposed to the company.
5939
Table 2 Machine Statistics NAME
Table 3 Part Statistics Assemb Ent. Shipped el
4
6th International & 27th All India Manufacturing Technology, Design and Research Conference (AIMTDR-2016), December 16-18, 2016 at College of Engineering., Pune, Maharashtra, INDIA.
Fig 3. Group Technology based Layout
2. Reduction of excessive material movement It was seen that worker’s time was mostly consumed in material handling as the assembly work station is at first floor. Worker has to move material from ground floor to first floor and again at the delivery time from first floor to ground floor. So it was suggested to them to relocate their assembly workplace to ground floor. In proposed layout the position of assembly workplace was relocated. By doing this changes it was found that the total material movement is of 1671 decimeter which is less than the initial model as shown in table 5 Work in Progress also have been reduced by reducing the the distance between the work stations as shown in table 4.
1. Use of group technology In group technology Different cells are formed for different components which then meet at a common station which is almost equal in proximity to all the three components. The benefits from the group technology aresimplification of material flow, material handling, and reduced work in process[5]. By simulating group technology layout minimum blockage of material was found. The model was run for 120 working hours which gives the statistics as shown in table 4.
Table 5 Path Distance Between Workstations(DM) Tabel 4 Part Statistics Name
Ent
PL BR
205 200
Shipped Assembele d 0 200 196 4
WIP
Time
5 0
224 911
Path P1
LT
WT
TT
Path
99
7200
5664
P12
LT 32
WT 5979
P2
136
5892
5760
P13
56
6121
P3
131
5930
5803
P14
40
5986
5948
P4
80
5928
5850
P15
24
6121
6098
TT 5948 6067
MP BK
205 206
0 0
200 200
6 5
206 276
P5
80
5959
5881
P16
99
6125
6029
P6
80
5987
5909
P17
80
6848
6770
RP FBR PB
200 192 200
0 192 188
188 0 0
12 0 12
361 0.03 361
P7
80
5928
5850
P18
107
7059
6956
P8
80
5959
5881
P19
59
6760
6703
The number of push lever(PL) entered are 205,metal pad (MP) are 205 and brake(BK) are 206. From this 200 welded brake(BR) were produced.Also the number of rubber pad(RP) and plastic bush(PB) are 200 each and final assembled component (FBR) were 192 which are more than the initial model with reduced WIP and average WIP as seen from table 4.
P9
80
5950
5873
P20
66
7059
6995
P10
64
5993
5931
P21
80
6760
6683
P11
35
6121
6087
P22
83
7059
6979
3.Addition of Machines In proposed layout two new machines were added sensitive drilling machine and hand grinding machine. Also the company has one spare bending machine which needs some maintenance work. A simulation model by using these machines proposed in the new layout.
5
6th International & 27th All India Manufacturing Technology, Design and Research Conference (AIMTDR-2016), December 16-18, 2016 at College of Engineering., Pune, Maharashtra, INDIA.
With the help of simulation software it can be seen that multiple whatif senarios can be generated without affecting the actual ongowing process, select the best possible outcome for the process, apply that optimum choice in the actual process and get the desired results. There are another two product being manufactured by the company on the same machines and hence their productivity will be increased too and this will add up in the profit earned by the company in a month which will also help in recovering the the initial investment in the machinery, overhead expenses of the company along with the additional wage to the extra employee.When a company adopts group technology it’s productivity is bound to increase because of single product dedicated production line and also any disruption in one machine does not effect other product manufacturing cell.
Table 6 Machine Statistics Name
%Idle
%Busy
%Blocked
No of Opern
PC
88.59
8.33
2.95
5
G
97.22
2.78
0
5
D
98.61
1.39
0
5
B
97.22
2.78
0
5
PR
95.66
2.78
1.56
5
G2
98.61
1.39
0
5
D2
98.75
1.25
0
5 5
S
96.35
1.39
2.26
B2
97.92
2.08
0
5
WL
95.83
4.17
0
200
PWD
50
50
0
5
D3
85.34
2.03
12.58
5
A
96
4
0
192
5.COST ANALYSIS Item
Cost
Sensitive Drilling Machine
45000/-
Hand grinding machine
2500/-
Repair of spare Bending Machine
10000/-
Total Investment
57500/-
REFERENCES 1. N.M.Z.NikMohamed,M.F.F.AbRashid, A.N.MohdRose,andW.Y.Ting “Production Layout Improvement for Steel Fabrication Works” Journal of Industrial and Intelligent Information Vol. 3, No. 2, June 2015. 2. Li Ma, Meiqiong Ma,Chao Ma,Jingwen Deng,Xingluo Liu,Lijun Zhao. “Simulation and Optimization Study on Layout planning of Plant Factory Based on WITNESS”.International Journal of Security and Its Applications http://dx.doi.org/10.14257/ijsia.2016.10.5.26 Vol. 10, No. 5 (2016) pp.275-282 3. Bronislav Chramcov “The Optimization of Production System Using Simulation Optimization Tools in Witness” ‘’International journal of mathametics and computers in simulation volume 7 2013 issue 2’’. 4. Enrico Briano, Claudia Caballini, Roberto
Currently the company makes about 10% profit from the sales of the product i.e the cost price comes out to be INR 150/- and the sales price upto INR 165/- i.e approx 15/- INR profit per piece.The current profit per week for 154 items comes out to be 2310/- INR. If we assume the same profit ratio is maintained by the company, the profit for 192 units per week would come out to be 2880/- INR ie. additional INR 570/- per week and INR 2850/- per month.So the total profit per month would come out to be 14400/- INR i.e the total investment will be recovered back in 4 months. CONCLUSION Parameter
Initial
Proposed
%Change
WIP
35% - 45%
0%-10%
-100% to -78%
MATERIAL MOVEMENT
2163 DM
1671 DM
-22.74%
PARTS PRODUCED PER WEEK
154 NO.
192 NO.
+24.67%
Mosca, Roberto Revetria. “Using WITNESSTM simulation software as a validation tool for an industrial plant layout”. 5. Martand Telsang, ‘Industrial engineering And Production Management’, 2nd Edition. S Chand and Company Ltd.
6