Jul 17, 2009 - programming for the purpose of truck dispatching to shovels. A case .... the total hourly cost is C1 + C2 N, where C1 is the cost per unit time of ...
text:Template Journal
7/17/09
1:25 PM
Page 433
Optimization of shovel-truck system for surface mining
T e c h n i c a l
by S.G. Ercelebi*, and A. Bascetin†
In surface mining operations, truck haulage is the largest item in the operating costs, constituting 50 to 60% of the total. In order to reduce this cost, it is necessary to allocate and dispatch the trucks efficiently. This paper describes shovel and truck operation models and optimization approaches for the allocation and dispatching of trucks under various operating conditions. Closed queuing network theory is employed for the allocation of trucks and linear programming for the purpose of truck dispatching to shovels. A case study was applied for the Orhaneli Open Pit Coal Mine in Turkey. This approach would provide the capability of estimating system performance measures (mine throughput, mean number of trucks, mean waiting time, etc.) for planning purposes when the truck fleet is composed of identical trucks. A computational study is presented to show how choosing the optimum number of trucks and optimum dispatching policy affect the cost of moving material in a truckshovel system. Keywords: Open pit mine, equipment selection, dispatching, linear programming, closed queuing network theory
Introduction In a surface mining operation, a materials handling system is composed of loading, hauling and dumping subsystems. Effective and efficient materials handling systems can be developed only through a detailed consideration of these subsystems in a systems analysis framework. The transport of material from production faces to dumping sites is accomplished by rail, truck, belt conveyor or hydraulic transport. Shovel-truck systems are most common in open pit mining. Two available techniques to analyse these systems, linear programming and queuing models, are used and compared in this study. The most important factor in every operation is profitability. Productivity of equipment used is an important factor of profitability. Profitability can be increased by optimization of the equipment combination used. Therefore the first goal in these models is to maximize productivity and hence increase production, which in turn will result in cost reduction. Studies conducted for the truck allocation were carried out by several authors. Muduli and Yegulalp (1999) studied the modelling The Journal of The Southern African Institute of Mining and Metallurgy
Proposed models Optimum number of truck assignments to shovels (by employing closed queuing network theory) In a shovel-truck model, trucks cycle between their assigned shovels and dumps or crushers,
* Istanbul Technical University, Mining Engineering Department, Maslak, Istanbul, Turkey. † Istanbul University, Engineering Faculty, Mining Engineering Department, Avcılar, Istanbul, Turkey. © The Southern African Institute of Mining and Metallurgy, 2009. SA ISSN 0038–223X/3.00 + 0.00. Paper received Oct. 2008; revised paper received May 2009.
VOLUME 109
JULY 2009
433
▲
Synopsis
truck-shovel systems as a closed queuing network with multiple job classes. Soumis et al. (1989) discussed the evaluation of the new truck dispatching in the Mount Wright mine using linear programming. Sgurev et al. (2003) studied an automated system for realtime control of the industrial truck haulage in open-pit mines. Alarie and Gamache (2002) studied the overview of solution strategies used in truck dispatching systems for open pit mines. Nenonen et al. (1981) used the interactive computer model for truck/shovel operations in an open pit mine; Ramani (1990) studied the haulage system simulation analysis in surface mining. Barnes et. al. (1972) studied the probability techniques for analysing open pit production systems. Carmichael (1986) applied cyclic queuing theory to determine the production of open-cut mining operations, and Koenigsberg (1982) used in his study some concepts of queuing theory. Shangyao et al. (2008) developed an integrated model that combines ready mixed concrete (RMC) production scheduling and truck dispatching in the same framework. Sabah et al. (2003) present a methodology based on the queuing theory, which is incorporated in a computer module to account for the uncertainties that are normally associated with the equipment selection process.
N o t e
text:Template Journal
7/17/09
1:25 PM
Page 434
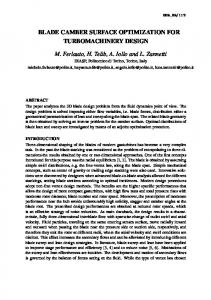
Optimization of shovel-truck system for surface mining over haul roads. When calculating cycle time for a truck, the time taken to spot and load, haul, dump and return needs to be considered. The nature of these activities includes variability in the cycle time. Trucks do not normally arrive at the shovel to be ‘serviced’ in a predictable manner, nor does it take exactly the same time for the shovel to service each truck. The interaction between the randomness of interarrival times of trucks and the shovel service time results in either trucks to queling at the shovel or the shovel being idle while waiting for a truck to arrive (Elbrond, 1990). Ore or waste is moved from shovel locations along a network of haulage roads, to several dumping or crusher stations. Through extensive time studies in the field, data are collected on the load times, the truck travel times, waiting times for the trucks at the shovel and at the dump location, and the truck dump times. Statistical distributions are fitted to the observed data. These distributions permit the random selection of event times for the defined sequence of operations. The queuing theory calculation is fast and simple. In truck dispatching this could be advantageous because forward estimates of waiting times are important information for the dispatcher. However, most mining applications are highly complex and accurate modelling results in complex queuing models that have no direct analytic solution. Usually, cyclic queuing models are solved by assuming that arrival and service mechanisms are Markovian. Approximation of times of loading hauling and dumping, with exponential distribution is a typical example of this situation. A typical cyclic queue in an open pit operation may be considered to consist of four phases (Figure1): 1. The shovel (service; loading the trucks) 2. The loaded haulage road (service; travelling loaded) 3. The dump site (service; emptying the trucks) 4. The empty haulage road (service; travelling empty). Since traveling, loading, waiting and dumping times are exponentially distributed, service rates are the inverse of mean service times. The cycle times of the trucks are calculated as: The average cycle time = load time + dump time + queuing time at the shovel + queuing time at the dump + loaded haul time + empty haul time. In the cyclic model the number of possible states for N cycling units (trucks) and M service centres:
on. P(N,0,…,0) may be obtained from the requirement that the sum of the probabilities equals 1, such as: [4] [5]
For N cycling units, [6] N = number of trucks M = number of phases μi = service rate at i th phase The probability that a phase is working (phase utilization) is: [7] The expected number of trucks in the queue at the i’th phase is: [8]
The expected time that a truck spends in the queue at the
i’th phase is: [9] Θ = η i μ i ; number of trucks being serviced at the i’th phase during one unit of time. The expected time that a truck spends in the i’th phase is: [10] Then average total cycle time for a truck to complete M phases becomes: [11]
[1] When phase 2 and 4 are transient phases such as travelling phases, the steady state probabilities are solved in terms of one of the unknowns P(N,0,…,0), (Carmichael 1987): [2]
[3]
(n1, n2, K, nM) shows the possible states, which means that there are n1 units in phase 1, n2 units in phase 2 and so
▲
434
JULY 2009
VOLUME 109
Figure 1—Phases of shovel-truck system The Journal of The Southern African Institute of Mining and Metallurgy
text:Template Journal
7/17/09
1:25 PM
Page 435
Optimization of shovel-truck system for surface mining Production over a given time period of interest (typically one shift) can be calculated by the number of loads that trucks take to the dump:
The objective function minimizes the number of trucks on the road + number of trucks at shovels (source points) + number of trucks at dump sites (sink points). Subject to the constraints of continuity:
[12]
[16] This means balancing equations at each node such as: incomings-outgoings = 0 and limiting rates at sources:
where N is the number of trucks in the system. Also production may be calculated from: [13]
ηshovel is shovel utilization and μshovel is shovel loading rate. For shovel-truck type operations, the minimum unit cost of moved material is the main concern. When the cost is of prime importance, a trade-off is sought between the cost of idle time of the shovel and the cost of providing extra trucks. The solution yields the optimum number of trucks of any given capacity that can be assigned to a shovel. For an operation involving single shovel and N trucks, the total hourly cost is C1 + C2 N, where C1 is the cost per unit time of shovel and C2 is the cost per unit time of a truck. Both costs include ownership and operating costs. So the total cost for unit production can be found from: [14]
[16] Meaning; Σoutgoings=1/loading time and, finally, non-negativity constraints: PI ≥ 0 where: NT = performance functional (number of trucks) NP = number of feasible paths NS = number of non-rate-limiting sinks NO = number of rate-limiting nodes PI = average rate over path i (trucks/min) TI = average travel time over path i (min) PJ = sum of all sink input rates (trucks/min) SJ = average sink processing time (min) RI = limiting node rate (trucks/min) The LP solution yields the desired path capacities in trucks/ unit time for each valid path.
N o t e
Case study
Dispatching of trucks to shovels (by linear programming) The linear programming model assumes no truck queuing under ideal conditions and guarantees maximum shovel utilization. LP model minimizes the number of trucks required for shovel coverage without truck queuing and is equivalent to maximizing overall production rate. The LP function to be minimized is the total number of trucks required to maintain all rate-limiting nodes at their maximum production rate, subject to continuity, rate limiting, and nonnegativity constraints. A pit is viewed as a fixed number of sources (load points) and sinks (dump points), called nodes, connected by valid transaction routes called paths. Shovels dump sites, and crushers are the nodes in an LP model. Roads are the paths between nodes. Some nodes are considered rate limiting (shovels), whereas others (waste dumps) are assumed capable of handling all transactions. If there are N nodes in a pit, then there are N*(N-1) directional paths interconnecting these nodes, although some paths may not used under normal operating conditions. For example, dump-to-dump and shovel-to-shovel are never used. Also some shovel-to-dump paths may not be feasible because of topography or non-existing roads, and not used. The general problem of allocating resources (trucks) to activities (node transactions) can be formulated as follows: (White et al. 1982) [15]
The Journal of The Southern African Institute of Mining and Metallurgy
Mine information In this case study, some research has been carried out to optimize the material handling system for overburden removal of an open-pit coal mine. The coal mine is situated about 65 km north of Bursa, in western Turkey, and has been in continuous operation since 1979. Currently, the mine supplies coal to Orhaneli power plant unit (1 × 210 MW) and to domestic users. In this case, the overall measurements of the mine should be designed again in terms of transporting system, equipment fleet, etc. Some technical parameters of the working site, which affect the system, have been researched thoroughly and summarized below in detail (Bascetin 2002; Bascetin 2004): The present extent of the open pit is 5 500 m by 3750 m and a total of 75 m of overburden removed in three 15 m high mine benches. The face inclination on individual benches is 75 degrees, while overall pit slope is 45 degrees. The mine will be worked over 18 years at the rate of one shift (12 h) per day, seven days a week for 300 days per year, and the scheduled operating time is 3600 h/year. The equipment in the inventory reported are given, briefly, in Table I.
Optimization study The overburden removal subsystem is analysed for the purpose of minimizing the truck fleet size and the minimizing unit cost composed of loading and hauling. The overburden removal subsystem employs two 15 yd3 and two 10 yd3 shovels both with 77 ton trucks. The mine has two dumping sites. The shovel truck system requires about 9 million m3 overburden removal yearly. The remaining 6 million m3 is handled by dragline. The present operation of the shovel truck system, is a closed system as shown in Figure 2. VOLUME 109
JULY 2009
435
▲
Once the unit production cost is found for a different number of trucks, the cost can be plotted vs. the number of trucks, and the optimum truck number, which minimizes the cost, can easily be determined.
T e c h n i c a l
text:Template Journal
7/17/09
1:25 PM
Page 436
Optimization of shovel-truck system for surface mining Table I
Equipment on the mine Equipment
Number Explanation
Drilling units
3
9’’ DM50
Rope shovels
2
Marion 191 MII -11,4 m3 (15 yd3)buckets (2 in waste)
Front shovels
5
PH 1900 AL-7.64 m3 (10 yd3) buckets (4—currently 2 in waste and 1 in ore)
Dragline
1
1260-W Bucyrus-Erie-25 m3 bucket
Trucks
50
Caterpillar 777-77 tonnes—(27) Komatsu 785-2, 77 tonnes—(13) Komatsu 785-2, 50 tonnes—(4) Komatsu HD 465-3—(6, coal trucks)
Bulldozer
9
Komatsu D355A-410 hp—(5) Caterpillar 81—(3) Cat 824 wheeled dozer—(1)
Loader
7
Caterpillar front-end loader—(4) Volvo front-end loader with 5.5–6 m3 buckets—(1) Champion-120 hp-(2)
Grader
1
An example of queuing calculations, from shovel S22 to dump site H6, is given below for 4 trucks allocated to the shovel. There area total of 35 states, and corresponding state probabilities are given in Table IV. Using Table IV, system performance measures can be calculated. Utilization of the shovel, η1 = 1–∑P(0, n2, n3, n4) = 1–∑(state 1, 2, 3, 5, 6, 8, 11, 12, 14, 17,21, 22, 24, 27, 31 possibilities) = 1–0.384 = 0.616 Table II
Lengths and travelling times for possible paths Path
Path length (m)
Travel loaded (min)
Travel empty (min)
780 1205 2615 1068 1500 1874 1337 1753
2.5 5.4 6.5 4.7 6.0 8.0 5.7 7.5
1.5 3.9 4.6 3.0 4.6 5.3 4.2 5.0
S11-W5 S11-W6 S12-W5 S12-W6 S21-W5 S21-W6 S22-W5 S22-W6
Caterpillar—(275 hp)
Figure 2—Shovel-truck system as closed system
In order to optimize the shovel truck system, two aspects are considered in order. ➤ Optimum number of truck assignments to shovels (by employing closed queuing network theory) ➤ Dispatching of trucks to shovels (by linear programming).
Figure 3—All possible truck paths
Optimum number of truck assignments to shovels All possible paths are analysed by the closed queuing network model, which is explained earlier. Path lengths and travelling times are shown at Table II. For this purpose all possible truck paths to shovels are shown in Figure 3. Manoeuvering + loading times of the 77 tons trucks are 2.03 and 3.0 minutes for 15 yd3 and 10 yd3 shovels respectively. Truck emptying time at waste site is 1.5 minutes. The cost of the shovels and trucks is given in Table III.
▲
436
JULY 2009
VOLUME 109
Table III
Cost of shovels and trucks Equipment
15 yd3 shovel 10 yd3 shovel 77 ton truck
Ownership cost $/h
Operating cost $/h
Total cost $/h
25.33 22.67 16.67
100.00 85.00 40.00
125.33 107.67 56.67
The Journal of The Southern African Institute of Mining and Metallurgy
text:Template Journal
7/17/09
1:25 PM
Page 437
Optimization of shovel-truck system for surface mining Table IV
System states and corresponding probabilities = 19.478 minutes State no.
System state
1
0 0 0 4
2 3
Coefficient
Prob. (state)
Production = 17.453 tons/minute
.321502
.005784
0 0 1 3
.385803
.006941
0 1 0 3
1.929013
.034704
4
1 0 0 3
.771605
.013882
5
0 0 2 2
.347222
.006247
6
0 1 1 2
1.736111
.031234
7
1 0 1 2
.694444
.012494
8
0 2 0 2
4.340279
.078085
9
1 1 0 2
3.472223
.062468
10
2 0 0 2
1.388889
.024987
11
0 0 3 1
.208333
.003748
12
0 1 2 1
1.041667
.018740
13
1 0 2 1
.416667
.007496
14
0 2 1 1
2.604167
.046851
15
1 1 1 1
2.083333
.037481
16
2 0 1 1
.833333
.014992
17
0 3 0 1
4.340279
.078085
18
1 2 0 1
5.208334
.093702
Dispatching of trucks to shovels
19
2 1 0 1
4.166667
.074961
20
3 0 0 1
1.666667
.029985
21
0 0 4 0
.062500
.001124
22
0 1 3 0
.312500
.005622
23
1 0 3 0
.125000
.002249
24
0 2 2 0
.781250
.014055
Figure 3 shows all possible feasible paths for Orhaneli openpit mine for overburden removal. In Figure 3, trucks are free to travel between shovels and waste sites. They are not assigned to a single shovel. In this way, after a truck dumps its load, it may travel to any shovel for the next load. LP
25
1 1 2 0
.625000
.011244
26
2 0 2 0
.250000
.004498
27
0 3 1 0
1.302084
.023425
28
1 2 1 0
1.562500
.028111
29
2 1 1 0
1.250000
.022488
30
3 0 1 0
.500000
.008995
31
0 4 0 0
1.627605
.029282
32
1 3 0 0
2.604167
.046851
33
2 2 0 0
3.125000
.056221
34
3 1 0 0
2.500000
.044977
35
4 0 0 0
1.000000
.017991
55.584150
1.000000
Total
The output from phase 1 = Θ1 = η1, μ1 = 0.616 x 0.3333 = 0.205 trucks/min Lq1 = average number of trucks waiting in the queue at the shovel, = 1 x ∑ (state 10, 16, 19, 26, 29, 33 probabilities) + 2 x ∑ (state 20, 30, 34 probabilities) + 3 x ∑ (state 35 probability) = 0.42 trucks
The above calculations are carried out for 2,3,…,6 trucks and results obtained are summarized in Table V, and cost per ton vs. number of trucks is plotted in Figure 4. The results of the queuing network solution to determine the optimum truck number, which minimizes the unit cost hauled for all possible paths along with shovel utilization and production are found in Table VI. As seen from Table VI, from S11 (shovel 11) to W5 (waste 5) with 3 trucks, from S12 to W6 with 5 trucks, from S21 to W5 with 6 trucks and from S22 to W5 with 4 trucks result in the lowest cost employing 18 trucks in total.
Table V
Summary of system measures from shovel S22 to dump site H6 Number of trucks
2 3 4 5 6
Waiting time (min) shovel
dump
0.529 1.199 2.045 3.108 4.426
0.132 0.277 0.433 0.595 0.759
Shovel utilization
Production (tons/min)
Unit cost (¢/ton)
0.339 0.487 0.616 0.724 0.811
9.624 13.799 17.453 20.706 22.187
38.27 33.54 31.93 31.47 33.63
Lq3 = average number of trucks waiting in the queue at the dump, = 1 x ∑ (state 5, 12, 13, 24, 25, 26 probabilities) + 2 x ∑ (state 11, 22, 23 probabilities) + 3 x ∑ (state 21 probability) = 0.09 trucks Wq1 = average waiting time in the queue at the loader, = Lq1/Θ = 2.045 min
The Journal of The Southern African Institute of Mining and Metallurgy
Figure 4—Unit cost vs. number of trucks VOLUME 109
JULY 2009
437
▲
Wq3 = average waiting time in the queue at the dump, = Lq31/Θ = 0.433 min
T e c h n i c a l N o t e
text:Template Journal
7/17/09
1:25 PM
Page 438
Optimization of shovel-truck system for surface mining Table VI
Optimum truck solution Path
S11-W5 S11-W6 S12-W5 S12-W6 S21-W5 S21-W6 S22-W5 S22-W6
Optimum truck fleet size
3 4 6 5 6 6 4 5
Waiting time(min) At waste
2.48 2.59 2.15 2.09 2.24 1.81 2.47 3.11
0.54 0.53 0.99 0.99 1.03 0.86 0.51 0.59
formulation determines the optimal path for trucks to follow. We assume that path to follow for a truck does not change in time, as in real time dispatching. If we call Xij the average number of trucks per minute over path i-j at an instant snapshot of the system, path variables are as shown in Table VII. The following LP formulation determines the optimal routes for trucks. The objective function minimizes the total number of trucks, the number of trucks on the road, the number of trucks at the shovels, and the number of trucks at waste dumps. Such as: Min Z = number of trucks on the road * travelling time over that path + number of truck at sink points (incoming) * duration at that point + number of trucks at source points (shovels) MIN = 2.5*X15+1.5*X51+5.4*X16+3.9*X61+6.5*X25+4.6 *X52+4.7*X26+3.0*X62+6.0*X35+4.6*X53+8.0*X 36+5.3*X63+5.7*X45+4.2*X54+7.5*X46+5.0*X64 +1.5*X15+1.5*X25+1.5*X35+1.5*X45+1.5*X16+1. 5*X26+1.5*X36+1.5*X46+4; Subject to: Balancing equations at each node (incoming-outgoing = 0); X51+X61–X15–X16 = 0; X52+X62–X25–X26 = 0; X53+X63–X35–X36 = 0; X54+X64–X45–X46 = 0; X15+X25+X35+X45–X51–X52–X53–X54 = 0; X16+X26+X36+X46–X61–X62–X63–X64 = 0; Limiting rates at sources (truck rates being processed at source points, i.e. ∑outgoing = 1/loading time): X15+X16 = 1/3; X25+X26 = 1/2.033; X35+X36 = 1/2.033; X45+X46 = 1/3; Nonnegativity constraints; (X15,X51,X16,X61,X25,X52,X26,X62,X35,X53,X36,X6 3,X45,X54,X46,X64)>=0 The result of the above LP formulation (Table VIII) shows that the optimum path for trucks should be such that nonzero values and path capacities are in trucks/min for each valid path. Figure 6 illustrates the optimum paths as determined by the LP model for a given set of travel times and shovel loading times. The optimal paths are: from S11 (shovel 11) to
▲
438
JULY 2009
Utilization of shovel
At shovel
VOLUME 109
Production tons/min
0.781 0.709 0.686 0.785 0.701 0.625 0.690 0.724
22.137 20.095 28.683 29.69 29.292 26.157 19.563 20.706
Unit cost cents/ton
20.91 ** 27.73 27.04 22.94 ** 26.48 ** 29.65 28.48 ** 31.47
W5 (waste 5), from S12 to W6, from S21 to W5 and from S22 to W5. This result is in close agreement with the queuing network solution. Figure 5 shows the optimal dispatching paths. When one examines the optimal paths, they are the same paths which queuing solution results with minimum loading and hauling costs. The optimizing study for Orhaneli open pit mine results in producing about 10.1 million m3 overburden removal in a year with 4 shovels (2 units of 15 yd3 and 2 units of 10 yd3) and 18 units of 77 tons trucks (which is the objective function value) over the required minimum 9 million m3 yearly overburden removal. This analysis does not include equipment breakdown. The average cost of hauling is 19.07 ¢/m3
Table VII
Path variables for LP modelling Path S11-W5 S11-W6 S12-W5 S12-W6 S21-W5 S21-W6 S22-W5 S22-W6
Path variable
Path
Path variable
X15 X16 X25 X26 X35 X36 X45 X46
W5-S11 W6-S11 W5-S12 W6-S12 W5-S21 W6-S21 W5-S22 W6-S22
X51 X61 X52 X62 X53 X63 X54 X64
Table VIII
Result of LP problem Variable
Value
X15 X16 X25 X26 X35 X36 X45 X46 X51 X61 X52 X62 X53 X63 X54 X64
0.3333 0.0000 0.0000 0.4918 0.4918 0.0000 0.3333 0.0000 0.3333 0.0000 0.0000 0.4918 0.4918 0.0000 0.3333 0.0000
The Journal of The Southern African Institute of Mining and Metallurgy
text:Template Journal
7/17/09
1:25 PM
Page 439
Optimization of shovel-truck system for surface mining (waste 5), from S12 to W6, from S21 to W5 and from S22 to W5. This result is in close agreement with the queuing network solution, which provided the minimum loading and hauling costs.
Acknowledgements This work was supported by the Research Fund of Istanbul University. Project number: 62/23012003 and UDP887/05122006.
Appendixes List of symbols N M μI Lqi Θ
Total production = 100.682 tons/min = 50x100.682 = 5034 tons /h (assuming 50 minutes work per hour) = 12x5034 = 60,408 tons/day (12h per working day) = 300x60,408=18 122 400 tons/year (300 working days per year) = 14,048 372 m3/year (loose) = 10 106 743 m3/year (in place) Average cost = 24.60 ¢/ton or 19.07 ¢/m3
Conclusion The methodologies developed and presented in this paper have the potential to be useful for mine operators for loading and haulage planning in open pit mines and/or at the stage of equipment procurement. Since the cost of shovels and trucks is several hundred dollars per hour, the application of the methodologies has potential for substantial savings. The methodologies developed have been validated for a range of shovels and off-highway dump trucks. The process has proven the applicability of the theoretical model proposed by the authors. The first stage consisted of determining of the optimal number of trucks working with each shovel in the system using a model based on the closed queuing network theory. A complete example has been provided for shovels working with identical trucks. The results clearly demonstrate the applicability of such an approach for the issues under study. As a result of the queuing network solution, the optimum truck number, which minimizes the unit cost hauled for possible paths along with shovel utilization and production/minute ise found to be: from S11 (shovel 11) to W5 (waste 5) with 3 trucks, from S12 to W6 with 5 trucks, from S21 to W5 with 6 trucks and from S22 to W5 with 4 trucks, which result in lower costs using 18 trucks in total. At the next stage, it has been determined how the trucks should be dispatched to shovels, using the LP model. Results obtained are interesting and applicable to planning loading and haulage operations in open pit mines or at the procurement stage of the equipment. The optimal route of trucks for Orhaneli coal mine is: from S11 (shovel 11) to W5 The Journal of The Southern African Institute of Mining and Metallurgy
N o t e
number of cycling units (trucks) number of service centers service rate at i th phase expected number of trucks number of trucks being serviced at the i’th phase during one unit time expected time that a truck spends in the i’th phase cost per unit time of shovel cost per unit time of a truck total cost for unit production
References ALARIE, S. and GAMACHE, M. (2002), Overview of solution strategies used in truck dispatching systems for open pit mines, International Journal of Surface Mining, Reclamation and Environment, vol. 16, no. 1, 2002. pp. 59–76. BASCETIN, A. An Applıcatıon of the Analytic Hierarchy Process in Equipment Selection at Orhaneli Open Pit Coal Mine, Transactions of the Institutions of Mining and Metallurgy-(AusIMM), Section A-Mining Technology. vol. 113, no. 3, 2004. pp.192–199(8). BASCETIN, A. Investigation of Costs of an Open Pit Mine by the 3D-Modelling of Mine Basin, Scientific Research, Istanbul University Research Fund, 2002, Project No : 1607/30042001.2002. BARNES, R.J., KING, M.S., and JOHNSON, T.B. Probability Techniques for Analyzing Open Pit Production Systems, Application of Computers and Operations Research in the Mineral Industry (16th APCOM Symposium), 1978. pp. 462–476. CARMICHAEL, D.G. Shovel-truck queues: a reconciliation of theory and practice, Constr. Mgmt. And Economics, vol. 4, 1986. pp. 161–177. CARMICHAEL, D.G. Engineering Queues in Construction and Mining, Ellis Horwood Ltd., Toronto, Canada, 1987. ELBROND, J. Haulage system analysis. Queuing theory, Surface Mining, 1990. pp. 743-748. KOENIGSBERG, E. Twenty Five Years of Cyclic Queues and Closed Queue Networks, A Review, Journal of Operational Research Society, vol. 33, 1982. pp. 605–619. MUDULI, P.K. and YEGULALP, T.M. Modeling truck-shovel systems as closed queuing network with multiple job classes, International Transactions in Operational Research, vol. 3, no. 1, 1999. pp. 89–98. NEONEN, L.K., GRAEFE, P.W.U., and CHAN, A.W. Interactive computer model for truck/shovel operations in an open-pit mine, Winter Simulation Conference. Proceedings of the 13th conference on Winter simulation, Atlanta, Georgia, vol. 1, 1981. pp. 133–139. RAMANI, R.V. Haulage system simulation analysis in surface mining, SME publications, B.A. Kennedy, (ed.), 1990. p. 724–742. SABAH, A., KHALIL, M., and MOHAMED, A.A. Computer model for selecting equipment for earthmoving operations using queuing theory, Construction Informatics Digital Library available at: http://itc.scix.net paper w782003-1.content. 2003. SGUREV, V., VASSILEV, V., DOKEV, N., GENOVA, K., DRANGAJOV, S., KORSEMOV, C., and ATANASSOV, A. An automated system for real-time control of the industrial truck haulage in open-pit mines, Institute of Industrial Cybernetics and Robotics, Sofia, Bulgaria, 2003. p. 1113. SHANGYAO, Y., WEISHEN, L., and MAONAN, C. Production scheduling and truck dispatching of ready mixed concrete, Transportation Research: Part E (1366-5545), vol. 44, no. 1, 2008. pp. 164-179. SOUMIS, F., ETHIER, J., and ELBROND, J. Evaluation of the new truck dispatching in the Mount Wright mine, Application of Computers and Operations Research in the Mineral Industry (27th APCOM Symposium), 1989. pp. 674–682. WHITE, J.W., ARNOLD, M.J., and CLEVENGER, J.G. Automated Open Pit Truck Dispatching at Tyrone, Engineering and Mining Journal, vol. 6, 1982. pp. 76–84. ◆ VOLUME 109
JULY 2009
439
▲
Figure 5—Optimum truck routes for dispatching
Wi C1 C2 C
T e c h n i c a l