are the first to report on modeling and optimization of an industrial styrene ... (
1993) developed a rigorous heterogeneous model for styrene reactor based on ...
International Journal of Chemical Reactor Engineering Volume
Article A
Optimization of Styrene Reactor Design for Two Objectives using a Genetic Algorithm Yue Li∗
Gade P. Rangaiah† Ajay Kumar Ray‡
∗ National
University of Singapore,
[email protected] University of Singapore,
[email protected] ‡ National University of Singapore,
[email protected] † National
ISSN 1542-6580 c Copyright 2003 by the authors. All rights reserved. No part of this publication may be reproduced, stored in a retrieval system, or transmitted, in any form or by any means, electronic, mechanical, photocopying, recording, or otherwise, without the prior written permission of the publisher, bepress, which has been given certain exclusive rights by the author.
Optimization of Styrene Reactor Design for Two Objectives using a Genetic Algorithm Yue Li, Gade P. Rangaiah, and Ajay Kumar Ray
Abstract Optimization of industrial styrene reactor design for two objectives using the non-dominated sorting genetic algorithm (NSGA) is studied. Both adiabatic and steam-injected reactors are considered. The two objectives are maximization of styrene production and styrene selectivity. The study shows that styrene reactor design can be optimized easily and reliably for two objectives by NSGA. It provides a range of optimal designs, from which the most suitable design can be selected based on other considerations. KEYWORDS: Multi-objective optimization, styrene, reactor design, genetic algorithm, Pareto
Li et al.: Multiobjective Optimization of Styrene Reactor
1
1. INTRODUCTION Styrene is one of the most important monomers produced worldwide, and finds major use in the production of polystyrene, acrylonitrile-butadiene-styrene resins (ABS), and a variety of miscellaneous polymers in the petrochemical industry. Catalytic dehydrogenation of ethylbenzene is the common process for styrene manufacture, and the average plant capacity is over 100,000 tons/year. Hence, a slight improvement in the selectivity of styrene can increase the profit significantly. This requires an optimal design of the styrene reactor. Sheel and Crowe (1969) are the first to report on modeling and optimization of an industrial styrene reactor. They employed six reactions and a pseudo homogeneous model for modeling both adiabatic and steam-injected reactors. Sheel and Crowe used Rosenbrock’s multivariable search technique to optimize a profit function with steam temperature, steam rate, and bed length as the decision variables. Steam split to each of the two beds in the steam-injected reactor was also varied. The results show that existing reactor operation can be improved and that the performance of the steam-injected reactor is better than that of the adiabatic reactor. Clough and Ramirez (1976) developed a dynamic model for a styrene pilot plant reactor based on the main reactions selected by Sheel and Crowe (1969), and also performed steady state optimization of both adiabatic and steam-injected reactors. Sheppard et al. (1986) selected several kinetic models from the literature and calibrated rate expressions using isothermal integral data provided by catalyst manufactures. Elnashaie et al. (1993) developed a rigorous heterogeneous model for styrene reactor based on dusty gas model for diffusion and reaction in the catalyst pellets. In another study, Elnashaie and Elshishini (1994) employed both pseudo-homogeneous and heterogeneous models for simulating an industrial styrene reactor. Both these works used the six reactions employed by Sheel and Crowe (1969). All the optimization studies on styrene reactor reviewed above, involve only a single objective. Recently, Yee et al. (2002) successfully optimized the operation of both adiabatic and steam-injected reactors for multiple objectives using non-dominated sorting genetic algorithm (NSGA). The decision variables are operating conditions such as feed conditions and flow rate. However, additional decision variables are available for optimization at design stage. Hence, in this study, design of styrene reactors is optimized for multiple objectives using NSGA. The results obtained are compared with those for operation optimization of an existing reactor.
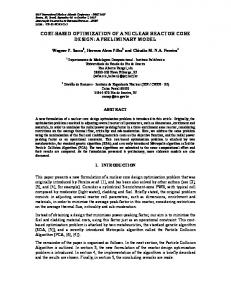
2. PROCESS DESCRIPTION In a typical styrene production operation, ethylbenzene is mixed with saturated steam and preheated by heat exchange with the reactor effluent. Major portion of saturated steam is superheated to about 1000 K in a furnace. The hot ethylbenzene plus steam stream and this superheated steam to reactor inlet temperature of over 875K (Li and Hubbell, 1982; Denis and Castor, 1992) are injected into the fixed bed catalytic reactor (Fig. 1). Superheated steam provides the necessary heat of reaction, inhibits coke formation and reduces the partial pressure of styrene and hydrogen to shift the thermodynamic equilibrium in favor of styrene production. Steam is usually added at a molar ratio of 15:1. The reactor effluent is cooled to stop the reactions and then sent to the separation section to recover styrene and unconverted ethylbenzene for recycle. The six main reactions occurring in a styrene reactor are: Reaction (1):
C6H5CH2CH3
C6H5CHCH2 + H2
(1)
Reaction (2):
C6H5CH2CH3
C6H6 + C2H4
(2)
Reaction (3):
C6H5CH2CH3
C6H5CH3 + CH4
(3)
Reaction (4):
2H2O + C2H4
2CO + 4H2
(4)
Reaction (5):
H2O + CH4
CO + 3H2
(5)
Reaction (6):
H2O + CO
CO2 + H2
(6)
As dehydrogenation of ethylbenzene (Eq. 1) is an endothermic reversible reaction producing two moles of product from one mole of reactant, low pressure and high temperature favor the forward reaction. This reaction results in about 80% conversion of ethylbenzene at equilibrium. However, the time and temperature necessary to achieve this give rise to excessive thermal cracking. The competing thermal reactions (Eqs. 2 and 3) degrade ethylbenzene to benzene and toluene, and reduce the yield. As the rate of formation of by-products increases with
Produced by The Berkeley Electronic Press, 2003
International Journal of Chemical Reactor Engineering
2
Vol. 1 [2003], Article A13
temperature, operating temperature is selected to compromise conversion of ethylbenzene to styrene and by-product formation. To promote high styrene production at low temperature, selective catalyst is employed to minimize side reactions. Length of the reactor, L
Teb Mixture of fresh ethylbenzene (EB), recycled EB and Saturated steam
Tmix1
Fixed-bed catalytic reactor
Fsteam
Superheated steam: Fsteam
L
Tmix2
Reactor Effluent
(1- )Fsteam
Figure 1: Configuration of a steam-injected reactor.
3. REACTOR MODEL The styrene reactor model used in this study is the pseudo-homogeneous model which assumes conditions on the catalyst surface are the same as bulk conditions (Elnashaie and Elshishini, 1994). Further, the reactor is assumed to be adiabatic with plug flow and radial uniformity. The rate expressions and kinetic data for six reactions as well as other required data given by Elnashaie and Elshishini (1994) were successfully used by Yee et al. (2002) for modeling the industrial reactor in Elnashaie and Elshishini (1994) by both pseudo-homogeneous and heterogeneous models. Results obtained by Yee et al. (2002) show that both the models predicted reactor exit conditions comparable to the industrial data as well as to those reported in Elnashaie and Elshishini (1994). Further, the pseudohomogeneous model is simpler to simulate and hence suitable for optimization. For completeness, the governing equations for the pseudo-homogeneous model as well as design and operating conditions of the reactor are summarized in Appendix A. Catalyst activity is considered constant due to lack of available data, even though it varies with both time and reactor length. The results for pseudo-homogeneous model are shown in Table A3. Computational time for simulating the industrial reactor by pseudo-homogeneous model is 0.062s. Industrial styrene reactors could be adiabatic or steam-injected type. In the former, ethylbenzene feed and the entire superheated steam are fed at the inlet of reactor. In the latter reactor (see Fig. 1), a fraction ( ) of superheated steam is mixed with ethylbenzene at the reactor inlet while the remaining steam is injected at a certain point along the reactor, say, at fraction of the total reactor length. The pseudo-homogeneous model is used to describe both these reactors.
4. OPTIMIZATION FORMULATION Since the profitability of a styrene reactor/plant is strongly correlated with the amount of styrene produced (Fst) and cost data vary from plant to pant and from time to time, we have selected Fst as one of the objectives. Selectivity of styrene (Sst) also affects economics and hence was chosen as the second objective function. We emphasize that there is no end to the variety of multiobjective optimization problems that can be formulated and studied. Particularly, when considering optimization at the design stage one can use fixed cost and operating cost as the two objective functions, but we did not want to use cost as an objective function since it is time and site specific. After generating a Pareto set for Fst and Sst, one can always calculate overall profit for each of the points on the Pareto set to determine the most meaningful operating point.
http://www.bepress.com/ijcre/vol1/A13
Li et al.: Multiobjective Optimization of Styrene Reactor
Maximize: Maximize:
3
J1 = Fst
(7)
J 2 = S st =
Fst o Feb
Fsto × 100 Feb
(8)
For optimizing the design of an adiabatic reactor, six decision variables with suitable bounds are chosen. 550 < Teb < 800 K
(9)
1 < Pin < 2.63 bar o
7 < SOR < (F 20 < F
o eb
(10) o
steam/F eb)
(11)
< 40 kmol/h
(12)
1.5 < D < 4.0 m
(13)
0.7 < L/D < 1.5
(14)
The lower bound on ethylbenzene feed temperature, Teb is to ensure that the temperature of ethylbezene and steam mixture at the reactor inlet, Tmix1 (Fig. 1) is high enough for the reaction to occur. The upper bound of Teb is set at 800K to prevent undesirable side reaction before ethylbenzne enters in to the reactor (Clough and Ramirez, 1976). The range for the inlet pressure, Pin is chosen based on the industrial practice. The lower limit of the steam to ethylbenzene molar ratio, SOR (steam over reactant) is set at 7 to prevent coke formation on the catalyst surface and to remove coke deposits from the catalyst surface thereby regenerating it. However, if SOR is increased to a high value, it will increase operating cost as extra energy is required to produce the excess steam and its subsequent condensation at the downstream of the reactor. The upper bound of SOR is the ratio of total steam flow rate, Fosteam to another decision variable: initial ethylbenzene flowrate (Foeb). In this study, Fosteam and temperature of superheated steam at the exit of superheater are selected respectively as 454 kmol/h and 1025 K based on possible limits on furnace producing superheated steam and downstream condenser. The bounds on Foeb, reactor diameter (D) and length to diameter (L/D) are based on the industrial reactor data (Foeb = 36.87 kmol/h, D = 1.95 m and L/D = 0.87) in Sheel and Crowe (1969) and Elnashaie and Elshishini (1994). As reported in these papers, ethylbenzene feed is assumed to contain 0.67 kmol/h of styrene, 0.11 kmol/h of benzene and 0.88 kmol/h of toluene in addition Foeb kmol/h of pure ethylbenzene. To optimize the steam-injected reactor, the fraction of steam used at the reactor inlet ( ) and the location of the injection port for the remaining steam (expressed as a fraction of the total reactor length, ) are also available in addition to the above six decision variables. The bounds used for these variables are: 0.1 < < 1
(15)
0.1
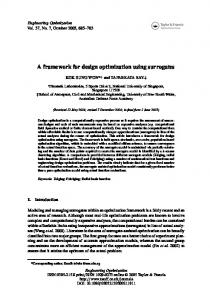
1.4 bar. The resulting Pareto set is shown in Fig. 2 along with the data for the industrial reactor (Sheel and Crowe, 1969). It can be observed that the points indeed constitute a Pareto set, that is when we move from one point to another Fst increases while Sst decreases. One cannot improve both the objectives simultaneously. Each point on the Pareto is associated with a set of decision variables as shown in Fig. 3. Values of objectives and decision variables corresponding to selected points on the Pareto are shown in Table 2. Note that yield, Yst is defined as
http://www.bepress.com/ijcre/vol1/A13
Li et al.: Multiobjective Optimization of Styrene Reactor
5
F Fsto × 100 Yst = st o Feb
(27)
100
Sst (%)
95
A
H D
I
B
90
C F
J
E
85 G
80 5
10
15
20
25
Fst (kmol/h) Figure 2: Comparison of Pareto sets for different lower bounds on reactor inlet pressure and existing reactor dimensions. ( : Pin =1.4 bar -: Pin = 2.4 bar : existing reactor, : Steam-injected reactor ×: industrial data). Table 2: Objective function values and operating conditions for selected chromosomes and for the industrial data Parameter
A
B
C
D
E
F
G
Fst (kmol/h)
13.63
16.09
18.65
15.59
16.31
15.45
15.98
Industrial data 15.57
Sst (%)
93.66
91.84
88.12
87.07
85.23
86.52
85.63
85.45
Yst (%)
32.54
38.75
45.16
37.36
39.47
37.06
38.47
39.94
Teb (K)
675.56
706.32
784.96
753.65
790.42
778.06
795.87
800.0
Pin (bar)
1.469
1.467
1.467
2.41
2.43
2.47
2.42
2.4
Pexit (bar)
1.429
1.411
1.412
2.328
2.336
2.409
2.349
2.32
SOR
10.41
11.15
11.05
11.28
11.38
11.32
11.36
12.38
D (m)
39.82 2.71
39.81 2.71
39.83 2.71
39.95 2.01
39.62 2.01
39.87 1.95
39.81 1.95
36.87 1.95
L/D
0.83
0.99
0.97
1.07
0.95
0.87
0.87
0.87
o
F
eb (kmol/h)
From Table 2, we find that from point A to C, Fst increases while Sst decreases and Teb also increases from 675 to 785 K. The decrease in Sst is primarily due to the increase in Teb. As can be seen in Fig. 3 and Table 2, results from
Produced by The Berkeley Electronic Press, 2003
International Journal of Chemical Reactor Engineering
6
Vol. 1 [2003], Article A13
multi-objective optimization are much better than the industrial data. However, Pexit for the latter is 2.32 bar, higher than the lower limit of 1.4 bar used in the design optimization. Since pressure affects reactor performance and to make a fair comparison, multi-objective optimization was performed using Pexit > 2.32 bar as the constraint. Comparison of the Pareto sets (Fig. 2) shows that high Pexit leads to lower selectivity and styrene flow rate. Values of objectives and decision variables for two chromosomes (D and E) on the Pareto for higher pressure and in the neighborhood of the industrial point are also shown in Table 2. These show that the multi-objective optimization result is better than the existing reactor: for the same Fst, Sst improves from 85.45 to 87.07% while for the same Sst, Fst increases from 15.57 to 16.31 kmol/h; however, a larger reactor is required to achieve this since both the optimum D and L/D values are higher than the industrial operating point.
(a)
(b)
(c)
(d)
(e)
(f)
(g)
(h)
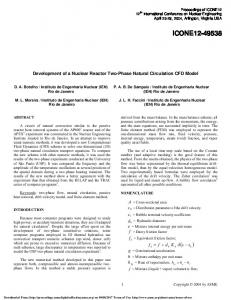
Figure 3: Decision variables corresponding to the Pareto sets in Fig. 2 ( : Adiabatic reactor : Steam-injected reactor ×: Industrial data ) To confirm the benefit of optimization, another trial has also been done holding the reactor dimensions the same as those of the industrial reactor and shown in the Fig. 2 as open circles (existing reactor). The Pareto is shown in Fig. 2 and the operating conditions for two chromosomes, F and G in Fig. 2 are shown in Table 2. Even for the
http://www.bepress.com/ijcre/vol1/A13
Li et al.: Multiobjective Optimization of Styrene Reactor
7
same reactor, optimal solutions given by points F and G are superior to the industrial operation. This shows that the operation of the industrial reactor can be improved to achieve higher Fst and/or Sst. In general, multi-objective optimization gives a broad range of optimal points for better understanding and for selecting the most suitable point meeting the plant requirements. Depending on location and cost of reactants and products, one can calculate profit for each of the points in the Pareto set to determine the most favorable optimum operating point. The decision variables corresponding to the points on the Pareto for design optimization with Pexit > 1.4 bar are plotted against one of the objectives, Fst in Figs. 3(a) to (f). These figures show that the optimum values of Pin, SOR, Foeb and D are nearly constant. Optimum L/D shows some scatter in the range 0.8 to 1.1. When simulation was performed using different values of L/D in the optimum range it was found that the effect of L/D is insensitive to the objective function values. Only Teb has a strong and conflicting effect on Sst and Fst (Fig. 3(a)). Low Teb gives high selectivity but lower Fst whereas high Teb is required for achieving larger Fst albeit at lower selectivity. Reactor inlet pressure is selected close to the lower bound since lower pressure favors the forward path of the main reaction (Eq. 1). The optimal Foeb is at the upper bound because high reactant flow rate will produce more styrene. High SOR shifts the main reaction (Eq.1) in the forward direction. The optimal SOR is the highest possible subject to the bound in Eq. 11. Larger diameter and consequently area of the reactor is good for conversion according to mass balances; but temperature drops with conversion thus decreasing further reaction. Optimal diameter is about 2.7 m. In a similar way, L/D beyond a certain value does not increase styrene flow rate and selectivity as temperature decreases due to the reaction.
Table 3: Objective function values and operating conditions corresponding to chromosomes H, I and J in Fig. 2. Parameter
H
I
J
Fst (kmol/h)
16.19
18.58
20.43
Sst (%)
92.98
90.98
87.57
Yst (%)
39.21
44.78
49.69
Teb (K)
714.41
767.77
798.53
Pin (bar)
1.496
1.496
1.499
SOR
11.37
11.31
11.39
39.6 2.555
39.76 2.536
39.75 2.740
1.04 0.213 0.690
1.14 0.172 0.585
0.97 0.145 0.677
o
F
eb (kmol/h)
D (m) L/D
5.2 Steam-injected Reactor Fig. 1 shows the configuration of a steam-injected reactor in which the total superheated steam is divided into two portions: one part ( Fsteam) is introduced at the reactor inlet while the remaining portion [(1- )Fsteam] is injected at some location along the reactor length (z = L) to achieve pseudo-isothermal condition. The Pareto sets for both adiabatic and steam-injected reactors in Fig. 2 reveal that the latter gives a better optimal result with higher Fst and Sst. Values of eight decision variables associated with the two Paretos in Fig. 2, are shown in Fig. 3. Note that and = 1 are not involved in the adiabatic reactor.
Produced by The Berkeley Electronic Press, 2003
8
International Journal of Chemical Reactor Engineering
Vol. 1 [2003], Article A13
(a)
(b)
(c)
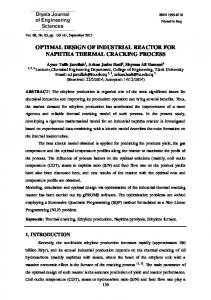
Figure 4: Comparison of temperature, yield and pressure profiles for chromosomes A, B and C, and for the industrial data. Optimal values of Teb, Pin, SOR, Foeb and D in the case of steam-injected reactor are similar to those of the adiabatic reactor. The optimal L/D is some what higher and more scattered for steam-injected reactor compared to that for adiabatic reactor. Once again it was found that effect of L/D is insensitive to the objective function values in the optimum range. Fig. 3(h) shows that the optimal value of steam split is about 70% injected at the reactor inlet, with rest of the steam injected at about 20% of the reactor length (Fig. 3(g). Table 3 lists values of objectives and decision variables corresponding to three chromosomes, H, I and J selected from the Pareto for steam-injected reactor in Fig. 3. The temperature, yield and pressure profiles for these three chromosomes are shown in Fig. 5. From Table 3, we find that from point H to point J, Fst increases while Sst decreases and Teb also increases from 714 to 798 K.
http://www.bepress.com/ijcre/vol1/A13
Li et al.: Multiobjective Optimization of Styrene Reactor
9
This trend is as for adiabatic reactor. The temperature profile in Fig. 5(a), as expected, shows a jump of about 40 K at the steam injection point. Yield and pressure profiles for the steam-injected case are similar to those for adiabatic reactor (Fig. 4) except for better yield. Note that pressure profiles in Fug. 4c and 5c are quite insensitive for different chromosomes.
(a)
(b)
(c)
Figure 5: Temperature, yield and pressure profiles for chromosomes H, I and J.
Produced by The Berkeley Electronic Press, 2003
International Journal of Chemical Reactor Engineering
10
Vol. 1 [2003], Article A13
6. CONCLUSIONS Multiobjective optimization of styrene reactors design for both adiabatic and steam-injected was formulated, and then solved by NSGA. Pareto optimal sets were successfully obtained for all situations considered. The Pareto optimal sets and operating conditions for all cases can be explained qualitatively, showing that the multiobjective optimization results obtained by NSGA are reliable. The results of multiobjective optimization shows that objectives, production rate and selectivity can be improved compared to the current operating condition. As expected, steaminjected is better than adiabatic operation.
NOTATION D F L N P p r S SOR T X Y
Diameter of reactor, m Molar flow rate, kmol/h Total length of reactor, m Number, [-] Total pressure, bar Partial pressure, bar Reaction rate, kmol/kg h Selectivity, % Steam to reactant (ethylbenzene) molar ratio Temperature, K Conversion, (%) Yield, (%)
Greek symbols Fraction of steam distributed, [-] Fraction of reactor bed where steam is injected, [-] Subscripts o Initial exit Exit in inlet eb ethylbenzene st Styrene steam Steam
REFERENCES Clough, D.E. and Ramirez, W.F., “Mathematical Modeling and Optimization of the Dehydrogenation of Ethylbenzene to form Styrene”, AlChE J., Vol. 22, 1097-1105 (1976). Denis, H.J. and Castor, W.M., “Styrene” in Ullmann’s Encyclopedia of Industrial Chemistry, A25, Ed. by B. Elvers, S. Hawkin and W. Russey, New York: John Wiley and Sons., p325-335 (1992). Elnashaie, S.S.E.H., Abdulla, B.K. and Hughes, R. “Simulation of the Industrial Fixed Bed Catalytic Reactor for the Dehydrogenation of Ethylbenzene to Styrene: Heterogeneous Dusty Gas Model”, Industrial and Engineering Chemistry Research, Vol. 32, 2537-2541(1993). Elnashaie, S.S.E.H and Elshishini, S.S., “Modelling, Simulation and Optimization of Industrial Fixed Bed Catalytic Reactors”, Gordon and Breach Science Publisher, London. p364-379 (1994). James, C. H. and Castor, W. M., “Styrene” in Ullmann’s Encyclopedia of Industrial Chemistry, A25, Ed. by B. Elvers., S. Hawkins and Schulz(Eds.), Weinheim, Germany: VCH. p329-344 (1994).
http://www.bepress.com/ijcre/vol1/A13
Li et al.: Multiobjective Optimization of Styrene Reactor
11
Li, C.H. and Hubbell, O.S., “Styrene” in Encyclopedia of Chemical Processing and Design, 55, ed by J.J. Mcketta and G.E. Weismantel, New York: John Wiley and Sons., p197-217 (1982). Sheel, J.G.P and Crowe, C.M., “Simulation and Optimization of an Existing Ethylbenzene Dehydrogenation Reactor”, Canadian Journal of Chemical Engineering, Vol. 47, 183-187 (1969). Sheppard, C.M. and Maler, E.E., “Ethylbenzene Dehydrogenation Reactor Model”, Industrial and Engineering Chemical Process Design Development, Vol. 25, 207-210 (1986). Yee, A.K.Y., Ray, A. K. and Rangaiah, G. P., “Multiobjective Optimization of an Industrial Styrene Reactor”, Computers and Chemical Engineering, Vol. 27, No. 1, 111-130 (2003).
Produced by The Berkeley Electronic Press, 2003
International Journal of Chemical Reactor Engineering
12
Vol. 1 [2003], Article A13
Appendix A. Model, Design and Operating Conditions for a Styrene Reactor The governing equations for the pseudo-homogeneous model, which was used for the multiobjective optimization, are given below (Sheel and Crowe, 1969; Elnashaie and Elshishini, 1994).
Mass balance: dX i Ar = b t i o dz Feb
(A1)
where Xi is the fractional conversion of ethyl benzene in each of the three reactions, i = 1, 2 and 3. For the other three reactions, i = 4, 5 and 6, Xi is given by dX i Ar = b t i o dz Fsteam
(A2)
Energy balance: 6
( dT i =1 = dz
H i ) b At ri
(A3) F j Cp j j
Momentum balance: ( 1 )Go 150( 1 )µ G dP = 1 × 10 5 + 1.75Go dz Dp Dp 3 G
(A4)
Rate expression and kinetic data for the six reactions are summarized in Table A1, while the design and operating conditions for an industrial reactor are shown in Table A2. The predicted results by the model are compared with the industrial data in Table A3.
Table A1. Rate expression and data for the six reactions (Elnashaie and Elshishini, 1994). Reaction expression r1 = k1(peb – pstpH2/Keb )
Ei (kJ/kmol) 90,981.4
Ai - 0.0854
r2 = k2peb
207,989.2
13.2392
r3 = k3pebpH2 r4 = k4psteam peth 0.5 r5 = k5psteampmeth r6 = k6 (P/T3)psteampCO
915,15.3 103,996.7 65,723.3 73,628.4
0.2961 - 0.0724 - 2.9344 21.2402
Notes: ki (kmol/kg/s/barn) = exp(Ai - Ei/RT); p refers to partial pressure of the reactant given in the subscript; equilibrium constant, Keb for reaction 1 is given by exp[-(122,725126.3T-0.002194T2)/8.314T].
http://www.bepress.com/ijcre/vol1/A13
Li et al.: Multiobjective Optimization of Styrene Reactor
13
Table A2. Design and Operating Conditions for the industrial reactor (Sheel & Crowe, 1969; Elnashaie & Elshishini, 1994). Quantity Numerical Value Reactor diameter 1.95 m Reactor Length/Catalyst bed depth 1.7 m Catalyst bulk density 2146 kg/m3 Catalyst particle diameter 0.0047m Bed void fraction 0.445 Catalyst composition 62% Fe2O3, 36% K2CO3, 2% Cr2O3 Inlet pressure 2.4 bar Inlet temperature 922.59 K Ethyl benzene in the feed 36.87 kmol/h Styrene in the feed* 0.67 kmol/h Benzene in the feed* 0.11 kmol/h Toluene in the feed* 0.88 kmol/h Steam 453.1 kmol/h * These three components are present as impurities in the ethyl benzene feed.
Table A3. Comparison of the simulation results with the industrial data. (Sheel and Crowe, 1969; Elnashaie and Elshishini, 1994). Quantity at reactor exit Exit temperature, K Exit Pressure, bar
Industrial data 850.0
Simulation results 849.75
2.32
2.33
Ethyl benzene conversion, %
47.25
46.74
Ethyl benzene flow rate, kmol/h
19.45
19.63
Styrene flow rate, kmol/h
15.57
15.40
Benzene flow rate, kmol/h
1.5
1.44
Toluene flow rate, kmol/h
2.03
2.05
Produced by The Berkeley Electronic Press, 2003
14
International Journal of Chemical Reactor Engineering
Vol. 1 [2003], Article A13
Appendix B: A note on Genetic Algorithm GA is a search technique that mimics the process of natural selection and natural genetics. In this algorithm, a set of decision variables are first coded in the form of a set of randomly generated binary numbers (0 and 1), called strings or chromosomes, thereby creating a ‘population (gene pool)’ of such binary strings. Each chromosome is then mapped into a set of real values of the decision variables, using the upper and lower bounds of each of these. A model of the process is then used to provide values of the objective function for each chromosome. The value of the objective function of any chromosome reflects its ‘fitness’. The Darwinian principle of ‘survival of the fittest’ is used to generate a new and improved gene pool (new generation). This is done by preparing a ‘mating pool’, comprising of copies of chromosomes, the number of copies of any chromosome being proportional to its fitness (Darwin's principle). Pairs of chromosomes are then selected randomly, and pairs of daughter chromosomes generated using operations similar to those in genetic reproduction. The gene pool evolves, with the fitness improving over the generations. Three common operators are used in GA to obtain an improved (next) generation of chromosomes. These are referred to as reproduction, crossover and mutation. Reproduction is the generation of the mating pool, where the chromosomes are copied probabilistically based on their fitness values. However, no new strings are formed in the reproduction phase. New strings are created using the crossover operator by exchanging information among pairs of strings in the mating pool. Pair of daughter chromosomes is produced by selecting a crossover site (chosen randomly) and exchanging the two parts of the pair of parent chromosomes (selected randomly from the mating pool). The effect of crossover may be detrimental or beneficial. It is hoped that the daughter strings are superior. If they are worse than the parent chromosomes, they will slowly die a natural death over the next few generations (the Darwinian principle at work). In order to preserve some of the good strings that are already present in the mating pool, not all strings in the pool are used in crossover. A crossover probability, Pcross, is used, where only 100Pcross percent of the strings in the mating pool are involved in crossover while the rest continue unchanged to the next generation. After a crossover is performed, mutation takes place. The mutation operator changes a binary number at any location in a chromosome from a 1 to a 0 and vice versa, with a small probability, Pmute. Mutation is needed to create a point in the neighborhood of the current point, thereby achieving a local search around the current solution and to maintain diversity in the population. The entire process is repeated till some termination criterion is met (the specified maximum number of generations is attained, or the improvements in the values of the objective functions become lower than a specified tolerance). The optimal solutions to a multiobjective function optimization problem are non-dominated (or Pareto-optimal) solutions. In order to handle multiple objective functions and find Paretooptimal solutions, the simple genetic algorithm (SGA) has been modified. The new algorithm, Non-dominated Sorting Genetic Algorithm (NSGA), differs from SGA only in the way the selection operator works. NSGA uses a ranking selection method to emphasize the good points and a niche method to create diversity in the population without losing a stable sub-population of good points. In the new procedure, several groups of nondominated chromosomes from among all the members of the population at any generation are identified and classified into ‘fronts’. Each of the members in a particular front is assigned a large, common, front fitness value (a dummy value) arbitrarily. To distribute the points in this (or any other) front evenly in the decision variable domain, the dummy fitness value is then modified according to a sharing procedure by dividing it by the niche count of the chromosome. The niche count is a quantity that represents the number of neighbors around it, with distant neighbors contributing less than those nearby. The niche count, thus, gives an idea of how crowded the chromosomes are in the decision variable space. Use of the shared fitness value for reproduction, thus, helps spread out the chromosomes in the front since crowded chromosomes are assigned lower fitness values. This procedure is repeated for all the members of the first front. Once this is done, these chromosomes are temporarily removed from consideration, and all the remaining ones are tested for non-dominance. The non-dominated chromosomes in this round are classified into the next front. These are all assigned a dummy fitness value that is a bit lower than the lowest shared fitness value of the previous front. Sharing is performed thereafter. The sorting and sharing is continued till all the chromosomes in the gene pool are assigned shared fitness values. The usual operations of reproduction, crossover and mutation are now performed. It is clear that the non-dominated members of the first front that have fewer neighbors will get the highest representation in the mating pool. Members of later fronts, which are dominated, will get lower representations (they are still assigned some low fitness values, rather than ‘killed’, in order to maintain the diversity of the gene pool). Sharing forces the chromosomes to be spread out in the decision variable space. The population is found to converge very rapidly to the Pareto set. It is to be noted that any number of objectives (both minimization and maximization problems) can be solved using this procedure.
http://www.bepress.com/ijcre/vol1/A13